Abstract
Cleaved amplified polymorphic sequence (CAPS) markers are useful tools for detecting single nucleotide polymorphisms (SNPs). This study detected and converted SNP sites into CAPS markers based on high-throughput re-sequencing data in watermelon, for linkage map construction and quantitative trait locus (QTL) analysis. Two inbred lines, Cream of Saskatchewan (COS) and LSW-177 had been re-sequenced and analyzed by Perl self-compiled script for CAPS marker development. 88.7% and 78.5% of the assembled sequences of the two parental materials could map to the reference watermelon genome, respectively. Comparative assembled genome data analysis provided 225,693 and 19,268 SNPs and indels between the two materials. 532 pairs of CAPS markers were designed with 16 restriction enzymes, among which 271 pairs of primers gave distinct bands of the expected length and polymorphic bands, via PCR and enzyme digestion, with a polymorphic rate of 50.94%. Using the new CAPS markers, an initial CAPS-based genetic linkage map was constructed with the F2 population, spanning 1836.51 cM with 11 linkage groups and 301 markers. 12 QTLs were detected related to fruit flesh color, length, width, shape index, and brix content. These newly CAPS markers will be a valuable resource for breeding programs and genetic studies of watermelon.
Introduction
Watermelon (Citrullus lanatus [Thunb.] Matsum. and Nakai) is a horticultural crop of high economic importance. Moreover, watermelon fruit has been demonstrated to provide a variety of healthful benefits, even preventing cancer and cardiovascular diseases (Feng et al. 2010). The genetic study of important traits in watermelon has been addressed thoroughly by researchers and breeders. However, the narrow genetic diversity among watermelon cultivars makes the differential identification of important traits through cultivars difficult and time-consuming. With the development of molecular biology techniques, some progress has been made in watermelon genetic map construction and understanding main trait inheritance, but many problems remain.
Molecular markers are a valuable tool for analyzing genetic diversity, map construction, marker-assisted breeding, and quantitative trait locus (QTL) analysis. The narrow genetic distance in watermelon has been a constraint for map construction and other genetic studies. Before the use of molecular markers, isozyme markers were the main markers used in the study of plant genetics. Navot et al. (1990) reported the first genetic map of watermelon, using an inter-specific backcross population derived from C. lanatus and C. colocynthis, with 7 linkage groups and only 24 isozyme markers.
In the past, amplified fragment length polymorphisms (AFLPs), randomly amplified polymorphic DNA (RAPD) markers, and simple sequence repeats (SSRs) (Levi et al. 2006, Ren et al. 2012, Zhang et al. 2004) were the three main molecular markers used in genetic analysis and watermelon breeding. Of these, SSR markers are relatively easy to analyze with moderate cost, as the resolution of allelic fragments can be performed via polyacrylamide gel electrophoresis. A disadvantage is that SSR markers are usually located in non-coding sequences, where the replicated blocks are less well conserved than coding regions (Wang et al. 2014). In addition, false alleles, null alleles, and size homoplasy may occur in genotyping because of technical artefacts and blurry bands (Pompanon et al. 2005). Other kinds of markers such as sequence-related amplified polymorphisms (SRAPs) (Li and Quiros 2001) and high-frequency oligonucleotides targeting active genes (HFO-TAGs) (Levi et al. 2013) have also been applied in watermelon and other studies of plant genetic diversity and cultivar identification. However, in watermelon the amounts of these and polymorphisms are too limited for linkage map construction and gene location.
Single nucleotide polymorphisms (SNPs) and cleaved amplified polymorphic sequence (CAPS) markers have been routinely used in agricultural breeding programs (plant and animal variation studies), and for the fine mapping of important traits in different kinds of plants (Kim et al. 2010, Kole and Abbott 2008, Lv et al. 2013, Pirona et al. 2013). Ling et al. (2009), working with watermelon, used a CAPS marker (CAPS-2) derived from an SNP locus in F2 and BC1R populations that could distinguish the phenotype for susceptibility to zucchini yellow mosaic virus. For fine mapping, Kim et al. (2010) identified SNPs at specific sites in specific intervals between SNP markers Satt435 and ss107918249 using the soybean draft genome sequence to develop markers closely linked to the gene for soybean aphid resistance (Rag1). By comparing the re-sequencing data of 4 parents and the reference genome sequence, Pirona et al. (2013) detected a sequence variant in the NAC (NAM/ATAF1, 2/CUC2) gene ppa008301m, which was shown to be closely related to the maturity date locus and implicated ppa008301m as a candidate gene controlling the ripening time in peach. Lv et al. (2013) developed indel primers related to Fusarium wilt resistance in cabbage, designed using the cabbage reference sequence and whole-genome re-sequencing data of the parental lines. The primers revealed a higher number of polymorphisms. Furthermore, 7 markers obtained in this study were located on chromosome C06, showing that the resistance gene FOC (Fusarium oxysporum f. sp. conglutinans) was also on this chromosome. In addition, 2 indel markers, M10 and A1, placed the gene in a 1.8-cM range, which laid the foundation for fine mapping and cloning of the target gene.
For watermelon, the development of SNP markers has been increasingly important for genetic study and traits mapping. Guo et al. (2013) reported that 6,784,860 candidate SNP markers were identified among 20 re-sequenced lines. Nimmakayala et al. (2014a) reported the generation of 11,485 SNPS from 183 watermelon accessions using the genotyping-by sequencing-approach, which represents domesticated watermelon; 5254 SNPs with a minor allele frequency (MAF) of ≥0.05 were detected distributed across the genome. Reddy et al. (2014) used the technology of TASSEL-GBS (Genotyping by Sequencing) to identify a set of 67,897 SNPs, and 13,693 SNPs were selected by a cutoff of MAF ≥0.01 based on 86 accessions of watermelon and an F2 population derived from a cross of PI 482362 and PI 270306. Bang et al. (2010) identified one CAPS marker (Phe226), which could perfectly co-segregate the flesh color phenotype, and was able to distinguish between red and canary yellow flesh color in watermelon.
For linkage map construction in watermelon, 6 SNP maps have been published (Lambel et al. 2014, Reddy et al. 2014, Ren et al. 2015, Sandlin et al. 2012). Three SNP watermelon linkage maps with 378, 357, and 388 SNP markers were constructed by Sandlin et al. (2012). The enriched watermelon SNP linkage map was constructed by Reddy et al. (2014) with 10,480 SNP markers distributed in 11 linkage groups. Genotyping by sequencing was also a new approach to finding SNPs and using them for mapping. It was used by Lambel et al. (2014) to produce 266 SNP markers, representing the 11 chromosomes of watermelon. Nimmakayala et al. (2014b) incorporated 232 SNPs and 50 SSRs into a watermelon linkage map spanning 924.72 cM with an average distance of 3.28 cM between markers with the method of VeraCode 384-plex assays. The genome-wide map for watermelon was constructed by Ren et al. (2012). The linkage map involved 698 SSRs, 219 indels and 36 structural variants that covered 800 cM with a mean marker interval of 0.8 cM (Ren et al. 2012). Compared with the sequence data, this map positioned 234 watermelon genome-sequence scaffolds, and accounted for 93.5% of the assembled 353-Mb genome size. A high-density DArTseq SNP-based genetic linkage map of watermelon was reported by Ren et al. (2015) with an F2 population derived from a cross between elite watermelon cultivar K3, and wild watermelon germplasm PI 189225. SNP markers (3465) were mapped onto 11 linkage groups corresponding to the chromosomes of watermelon.
Recently, whole genome sequences have been developed for a range of economically important plants, such as pear (Chagne et al. 2014), sweet orange (Xu et al. 2013), radish (Kitashiba et al. 2014), and eggplant (Hirakawa et al. 2014). The draft genome of watermelon was reported by Guo et al. (2013). This resource is now the reference genome, facilitating the development of sequence-based molecular markers to underpin genetic improvement of watermelon crops. The discovery of large numbers of SNPs and indels in genome-scale sequencing initiatives provides an alternative approach to develop high-density markers. Liu et al. (2013) developed 387 polymorphic indel markers between 2 Brassica accessions, based on re-sequencing data. The developed markers were used to check universal applicability with 7 B. rapa accessions; most of them were polymorphic. Gujaria et al. (2011) constructed a transcript map for chickpea (Cicer arietinum L.) using genetic molecular markers including SNPs (CAPSs), SSRs, and markers based on intron spanning regions. The SNPs were detected through chickpea allele re-sequencing, and 220 candidate genetic regions were obtained with 1893 SNP loci. Using SNP2CAPS software, 192 CAPS locus candidates were acquired. With another 87 pairs of reported CAPS markers, 279 pairs of CAPS markers were used for CAPS assays on 5 kinds of chickpeas, and 143 pairs of CAPS markers were gained.
Bachlava et al. (2012) detected SNPs in the re-sequencing data of sunflowers for high-density genotyping and genetic diversity analysis. The results showed that more than 95% of the SNP markers gained polymorphisms, and more than 90% of the successful markers could be successfully applied in wild species (Bachlava et al. 2012). Specific-locus amplified fragment sequencing (Sun et al. 2013), QTL sequencing (Hirokin et al. 2013) and genotyping by sequencing (Lambel et al. 2014) were originally based on DNA sequencing data, and these provide us with new methods of QTL detection.
Although many linkage maps were developed with SNP markers, the high cost and complexity of technique were a bottleneck for marker development in watermelon. It is now possible to detect genome-wide CAPS polymorphisms among different accessions using whole-genome re-sequencing. In this study, we used the re-sequencing data from two watermelon lines to identify CAPS loci across the assembled genome. Using the F2 population to construct a CAPS-based linkage map, we detected QTLs related to agronomic traits. The CAPS markers could represent the different linkage region of the watermelon genome.
Materials and Methods
Plant materials
Two inbred watermelon lines, LSW-177 and COS, were selected for their different phenotypes to exploit CAPS markers for high-throughput sequencing. The seeds of LSW-177 and COS were offered by Angela R. Davis from the United States Department of Agriculture, Agricultural Research Service, South Central Agricultural Research Laboratory, who is currently with the company HM. Clause in the United States.
Both LSW-177 and COS are midseason and monoecious. In LSW-177, the fruit is elongated with red flesh, and the Brix content is 7% in the center and 5.5% at the edge (Davis et al. 2008). The flesh color of COS is pale yellow, and the Brix content is 10.88 ± 1.37% in the center and 7.98 ± 0.91% at the edge (our data). To test the co-dominance of the CAPS markers, we crossed LSW-177 (female) and COS (male) to produce the F1 generation. 352 individuals of the F2 generation were generated from a single F1 plant.
The P1, P2, F1, and F2 generations were grown in a greenhouse at Xiangfang Experimental Agricultural Station of Northeast Agricultural University, Harbin, China (44°04′N, 125°42′E), during the summer of 2014. The two parents and F1 plants were grown in triplicate, with 15 plants each. To prepare for linkage map construction, 352 F2 generation plants were planted in the greenhouse.
Phenotyping of plant materials
Fruit lengths and widths were measured by ruler and the results were expressed in centimeters. The fruit shape index was the fruit length divided by the fruit width. Brix content in the center and at the edge was measured using a hand refractometer (ATAGO, PAL-1). Visual observation was used to evaluate flesh color, and marked as 3 for red, 2 for canary yellow, and 1 for pale yellow.
DNA preparation and construction of sequencing library
The DNA of young leaf tissue from 15 plants of each line, i.e., LSW-177, COS, and the F1 generations, was isolated. For the F2 generation, genomic DNA was extracted from fresh-frozen leaves of each individual using the modified hexadecyltrimethylammonium bromide (CTAB) method described by Luan et al. (2008).
LSW-177 and COS were re-sequenced using an Illumina HiSeq 2000 high-throughput sequencing platform (more than 20-fold coverage of the genome) by BGI (China). The complexity of the genome DNA was reduced randomly into fragments by the physical method (Ultrasonic). The ends of the DNA fragments were repaired, and an A base was added to the 3′ sequences. The fragments were then ligated to adapter pairs and one adapter contained the barcode sequence and a binding site Illumina sequencing primer. The samples were then pooled, purified, and amplified with primers compatible to the adapter sequences to construct the DNA fragment library with sequence reads of 90 bp. Temperature cycling consisted of 72°C for 5 min; 98°C for 30 s; then 18 cycles of 98°C for 30 s, 65°C for 30 s, and 72°C for 30 s; with a final extension step at 72°C for 5 min. The PCR products were quantified, and diluted for re-sequencing on the Illumina HiSeq 2000 platform.
Development of CAPS markers from high-throughput sequencing data
For the re-sequencing, the two watermelon lines were grown in soil, 15 plants for each line. The genomic DNA was extracted from the leaves of 4-week-old seedlings for high-throughput sequencing analysis. The quality and quantity of extracted DNA was verified via 1.0% agarose gel. 66 million (66,600,000) and nearly 63 million (62,786,132) paired-end reads were generated from the two materials, respectively.
The process employed to detect CAPS markers involved 3 steps. Firstly, the reads were mapped to the watermelon reference genome (http://www.icugi.org/cgi-bin/ICuGI/index.cgi) using Burrows-Wheeler Aligner (BWA; version 0.6.2) Li H. and R. Durbin (2009) with its default settings. Secondly, the mapped reads were sorted, and indexed by the protocol of SAMtools (version 0.1.18) software (Li et al. 2009, http://www.htslib.org/) with a mapping score of >20. Candidate SNP sequences were excavated by self-compiled script on Perl between LSW-177 and COS by using the mpileup algorithm of SAMtools and bcftools, with a filtering threshold (Q = 20). Five hundred base pair flanking sequences were extracted on both sides of the SNP loci. The average frequency of SNPs and indels was also analyzed by the self-compiled script on Perl.
The third step was CAPS locus exploitation, in which all the SNP candidate sequences were analyzed using SNP-2CAPS software (Thiel et al. 2004). Candidate CAPS sequences were detected using 16 restriction endonucleases as the parameter (i.e., EcoRI, BsaHI, HindIII, MboII, PstI, ScaI, BamHI, MluI, AluI, DraI, PvuI, XhoI, BclI, TaqI, KpnI, and MspI) (Thermo Scientific, Massachusetts, United States).
CAPS candidate sequences were selected based on 3 criteria. Firstly, to design primers suitable for amplification, the candidate sequence contained a restriction enzyme cutting site located in the middle of the sequence. Secondly, based upon the resolution ratio of the 1% agarose gel electrophoresis (100 bp), the positions at the enzyme site in the candidate sequences were >100 bp away from each of the sequence ends. Finally, if more than one enzyme site was located in the candidate sequence, the enzyme site position was taken into consideration for the primer design.
CAPS primer design and experimental validation of DNA polymorphisms
To construct a linkage map of the whole watermelon genome, 15 to 25 CAPS sequences, evenly distributed on each chromosome, were chosen for PCR primer design. The PCR products were digested by restriction endonuclease to verify polymorphisms of the CAPS markers. The primer design was analyzed using Primer Premier 6.0 software, with the appropriate CAPS candidate sequences. The design of the primers conformed to the following criteria: 18–26 bp long; GC content 40–60%; annealing temperature range 56–60°C and the difference in the annealing temperature in a primer pair was <3°C with PCR products 200–1000 bp.
The PCR mixture for CAPS amplification contained 20 ng plant genomic DNA, 8–10 pmol primers, 0.25 mM dNTPs, 10× Taq buffer, and 1 unit of Taq polymerase in a total volume of 10 μL. Touchdown PCR was performed by preheating samples for 7 min at 94°C; then 30 cycles of 60 s at 94°C, 20 s at 60°C with step-wise decreases of 0.5°C for each cycle, and 60 s at 72°C; 10 cycles of 20 s at 94°C, 20 s at 45°C, and 60 s at 72°C; and a post-heating for 7 min at 72°C. The reaction mixture for the enzyme digestion contained: 5 μL PCR product, 9 μL ddH2O, and 0.3 μL restriction enzyme (10 U/μL), which were then incubated at 37°C, 55°C, and 65°C, respectively, in accordance with the instructions for the restriction enzyme, for 1–16 h.
All the CAPS markers were subsequently tested in the genotypes of LSW-177, COS, and their F1 generation. The enzyme-digested products were examined via 1% agarose gel electrophoresis. The results of agarose gel electrophoresis were photographed using a Gel Documentation and Image Analysis System (ChampGel 6000). Co-dominant polymorphic markers among LSW-177, COS, and the F1 generation were selected for map construction.
SSR markers
For SSR marker selection, 449 pairs of watermelon SSR markers (including 23 pairs of core watermelon SSR markers) and 556 pairs of melon SSR markers were used. All of the SSR markers were derived from published literature (Danin-Poleg et al. 2001, Fazio et al. 2002, Fernandez-Silva et al. 2008, Gonzalo et al. 2005, Joobeur et al. 2006, Silberstein et al. 2003, Yi et al. 2003, Zalapa et al. 2007, Zhang et al. 2012) and provided by Yiqun Weng (University of Wisconsin). The PCR mixture for SSR amplification contained 20 ng plant genomic DNA, 8–10 pmol primers, 0.25 mM dNTPs, 10× Taq buffer, and 1 unit of Taq polymerase in a total volume of 10 μL. PCR was performed by preheating samples for 5 min at 94°C; and then 35 cycles of 60 s at 94°C, 60 s at 50°C, and 90 s at 72°C; finishing with post-heating for 5 min at 72°C. SSR amplification products were run on a 6% denaturing polyacrylamide gel via electrophoresis and detected by silver staining.
Map construction and QTL analysis
The linkage map was constructed by using IciMapping V3.3 software (Institute of Crop Science Chinese Academy of Agricultural Sciences, Beijing, China). A minimum logarithm of odds (LOD) score of 3.0 and a maximum threshold recombination fraction value of 0.35 were used to group the markers. The translation from recombination frequency to map distance was performed with IciMapping V3.3 software, using the Kosambi mapping function. The order of the markers in each linkage group was determined by the method of maximum likelihood. The distortion segregation markers were defined as the segregation ratios, which differed from the expected 1:2:1, at P < 0.05. Graphical output of the linkage groups was performed using the software package Map Chart 2.2 (Plant Research International, Wageningen, Netherlands). QTL analyses were performed using IciMapping V3.3 software. Interval mapping, multiple QTL model, and permutation analysis were used for QTLs and their significance calculating. The QTL starting threshold in the permutation analysis (1000 permutations at P = 0.05) ranged between 2.0 and 2.3 for the various traits. The LOD score of 3.0 was used for QTL detection.
Statistical analyses
SPSS 19.0 (SPSS, United States) was utilized to perform statistical analyses such as mean, standard deviation, trait distribution, and correlation analysis.
Results
Characterization of SNP and indel loci
Using the BWA software, 65 million (65,465,200) and 61 million (61,496,376) paired-end reads for LSW-177 and COS, respectively, were mapped to the assembly of the reference genome. For LSW-177, approximately 88.7% of the assembled 353 Mb genome could be covered by the reference genome while for COS performed 78.5% of the 366 Mb assembled data of the reference genome. Between them, 225,693 SNPs and 19,268 indels (one base insertion and deletion) were detected and used as potential markers for genotyping while comparing the assembled data from chromosome 1 to chromosome 11. The average frequency of SNPs and indels was analyzed by the self-compiled script on Perl (Fig. 1, Table 1). The density range of SNP loci was 64/1000 to 2,800/1000 kb between the two watermelon materials, while the frequency of indel loci (one base insertion and deletion) was 11/1000 to 202/1000 kb.
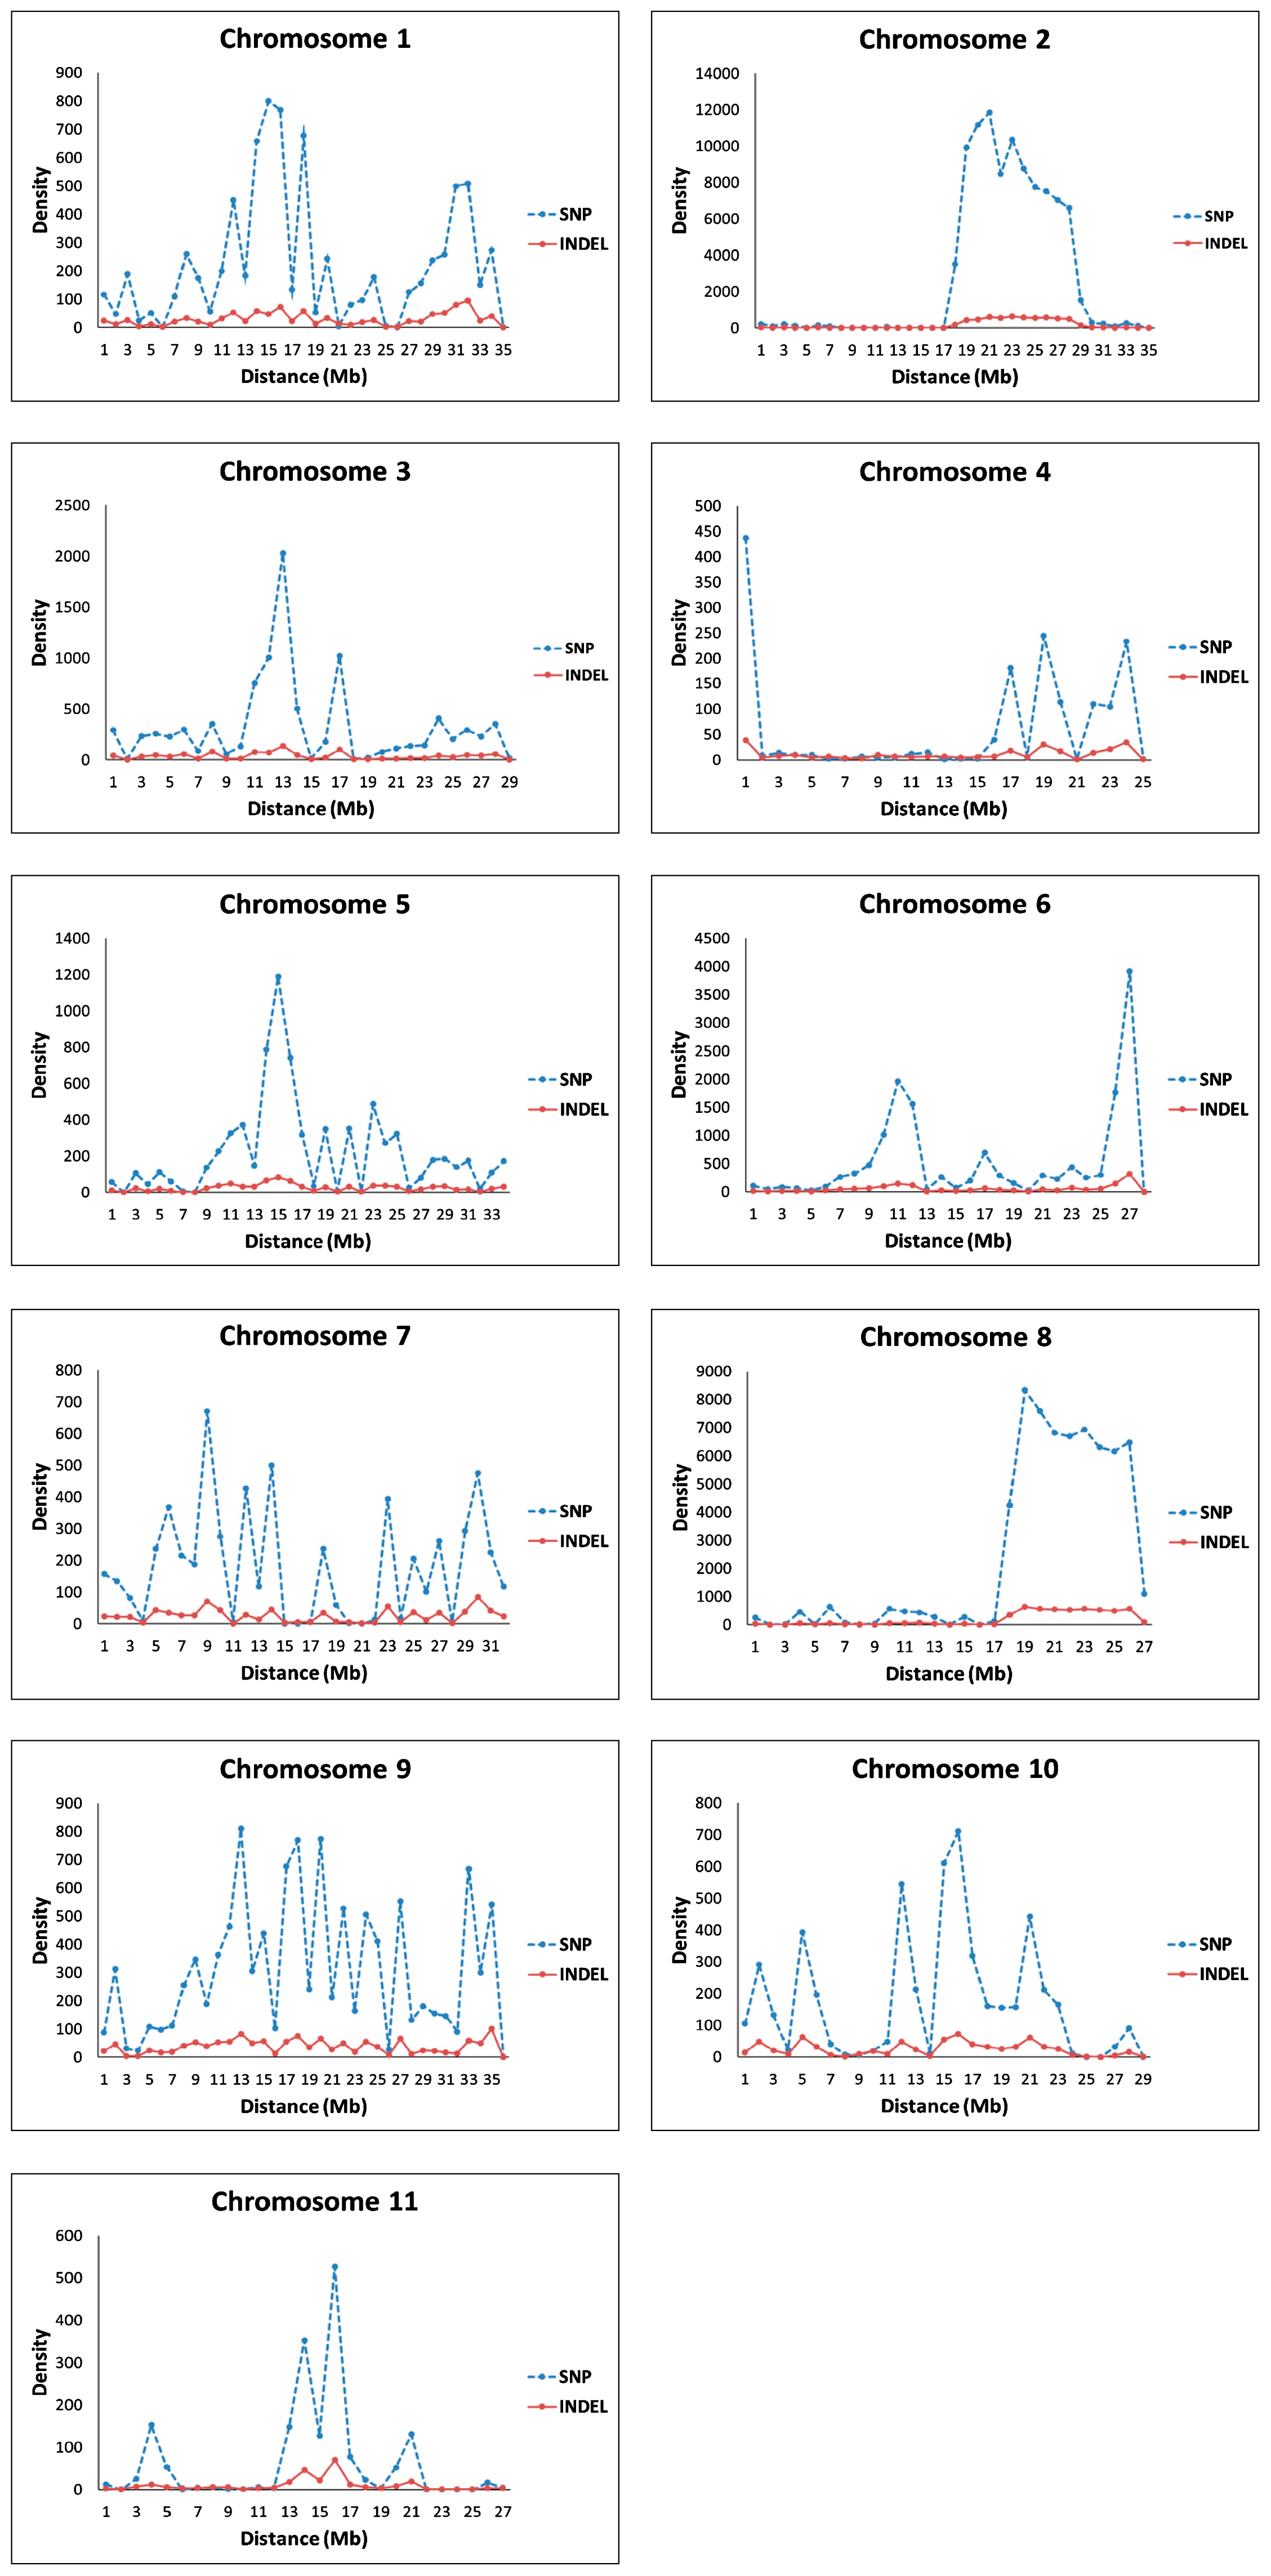
Table 1
The average SNP density and indel loci in 11 chromosomes in LSW-177 and COS
| Chr |
SNPs |
Indels |
| Loci,/103 kb |
Total |
Loci,/103 kb |
Total |
| 1 |
228 |
7772 |
30 |
1036 |
| 2 |
2800 |
96379 |
175 |
6014 |
| 3 |
327 |
9470 |
38 |
1107 |
| 4 |
64 |
1567 |
11 |
277 |
| 5 |
224 |
7546 |
26 |
861 |
| 6 |
552 |
14906 |
55 |
1488 |
| 7 |
184 |
5799 |
26 |
803 |
| 8 |
2458 |
64274 |
202 |
5288 |
| 9 |
318 |
11139 |
40 |
1391 |
| 10 |
180 |
5103 |
25 |
718 |
| 11 |
64 |
1738 |
11 |
285 |
| Total |
— |
225693 |
— |
19268 |
The lowest numbers of SNPs were on chromosomes 11 and 4, while the highest was detected on chromosome 8. Chromosomes 11 and 4 had the lowest indel frequency score and chromosome 8 had the highest. Among all the 11 chromosomes, chromosome 2 contained the most SNPs and indel loci, with 96,379 and 6014, respectively. Chromosome 4 had the lowest number of SNP loci (1567) and the fewest indels (277).
The number of transversions, transitions, and single-base indels were 72,285, 153,408, and 19,268, respectively. Regarding the transversions, the largest number was AT→TA (20,027, 27.7%) while the smallest number were CG→GC (13,027, 18.0%). SNP transitions were CT→TC (76,633, 49.95%) and AG→GA (76,675, 50.05%; Table 2). For the indels (only one base insertion or deletion), the highest number were base T (7,359, 38.2%) and the lowest were base G (2,359, 12.2%). Based on this distribution of SNPs, it was possible to construct genetic maps and select SNPs within specific regions for fine mapping.
Table 2
Analysis of the candidate SNP types
|
Type |
Amount |
Ratio |
Total |
| Transversions |
AT→TA |
20027 |
27.7% |
72285 |
|
AC→CA |
19527 |
27.0% |
|
|
TG→GT |
19704 |
27.3% |
|
|
CG→GC |
13027 |
18.0% |
|
| Transitions |
CT→TC |
76633 |
49.95% |
153408 |
|
AG→GA |
76775 |
50.05% |
|
| Indels |
A |
7170 |
37.2% |
19268 |
|
T |
7359 |
38.2% |
|
|
C |
2380 |
12.4% |
|
|
G |
2359 |
12.2% |
|
By re-sequencing at a depth of 20.0×, we detected a large number of CAPSs with a dense distribution across each of the 11 watermelon chromosomes. The potential CAPS markers were detected using the SNP2CAPS program with the re-sequencing data according to the absence or presence of the restriction site on the SNP position. The 16 restriction enzymes yielded 14,246 CAPS loci, excavated with the SNP2CAPS software. After eliminating CAPS loci that were not suitable, 3,192 pairs of sequences were selected as the CAPS candidate sequences, which were appropriate for the primer design in accordance with the conditions which we considered. In total, 532 pairs of sequences were chosen for the primer design and polymorphism analysis, with the parental materials and the F1 generation; 516 pairs of primers (97.0%) could amplify clear PCR products. No amplification was found in 16 pairs (3.0%). The expected size was obtained for 296 pairs, while approximately 42.64% of the primer pairs amplified additional fragments or failed in enzyme digestion reaction. Among the 3 tested genotypes (P1, P2 and F1), 271 pairs of primers revealed expected fragment lengths and polymorphisms, with a polymorphic rate of 50.94%, according to the results of the restriction enzyme reaction. The fragment lengths of the PCR products ranged from 1874 bp (WII04EBsaHI-6) to 312 bp (WII08EXhoI-1), while the enzyme-digested products ranged from 1350 bp (WII04EBsaHI-6) to 158 bp (WII10EBclI-7).
Linkage map construction with newly developed CAPS markers
Twenty-three pairs of SSR markers previously derived by Zhang et al. (2012) were used for primer selection as the core SSR markers. Among them, 13 pairs of primers showed polymorphisms between the 2 parental lines. Finally, 10 pairs of polymorphic core primers were arranged into 8 groups (chromosomes 2, 3, 4, 6, 7, 8, 9, and 11). Another 27 pairs of watermelon and melon SSR markers were also selected as the polymorphisms for map construction. A linkage map with 301 markers (264 CAPS, 37 SSR) was constructed used the F2 population (352 plants) derived from LSW-177 and COS, with 7 CAPS markers removed (Fig. 2, Table 3). For all the molecular markers, 275 gave the expected Mendelian ratio of 1:2:1 (P > 0.05), except 26 pairs of CAPS markers with a distorted segregation ratio of 8.64%. Most of the chromosomes included segregation distorted markers except chromosome 1 and 2. Chromosome 9 contained the most distorted segregation markers (8 pairs).
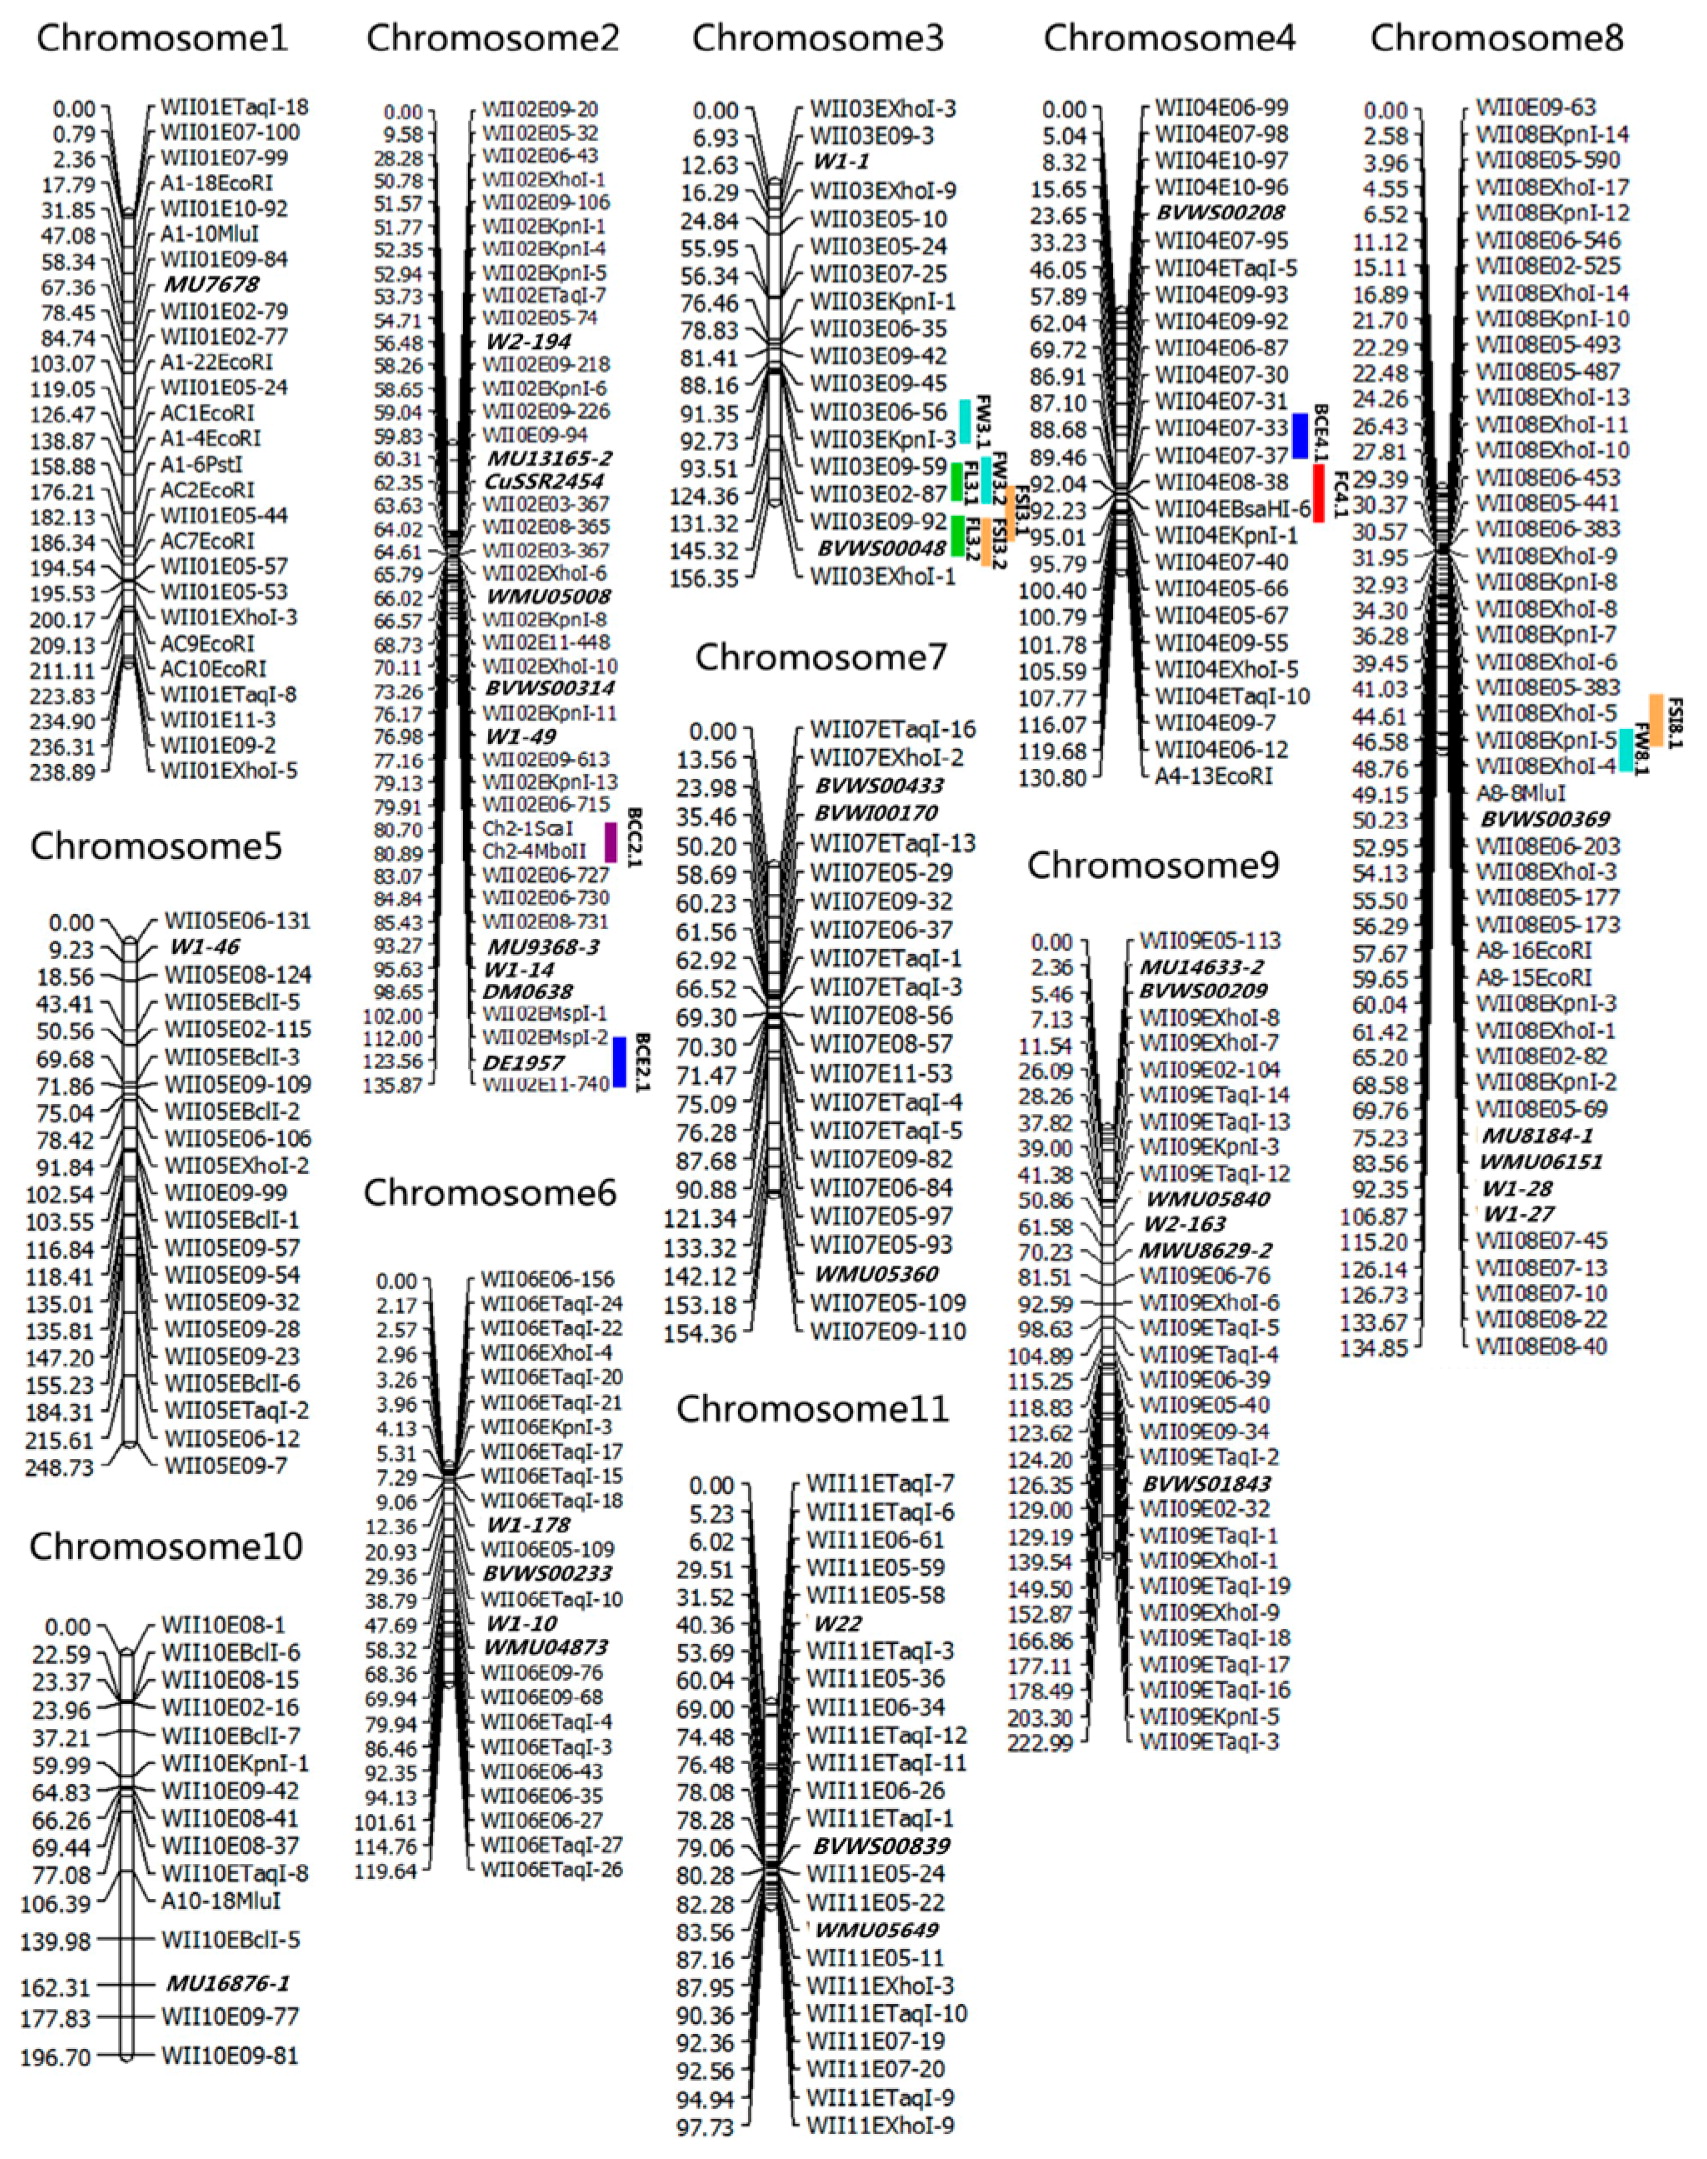
Table 3
Summary of the watermelon linkage map based on a F
2 population of a cross between LSW-177 and COS parental strains
| Chr |
Marker, n |
Mb |
Distance of linkage groups, cM |
| Genetic distance |
Average distance |
| 1 |
27 |
34.09 |
238.89 |
8.85 |
| 2 |
43 |
34.42 |
135.87 |
3.16 |
| 3 |
18 |
28.94 |
156.35 |
8.69 |
| 4 |
26 |
24.32 |
130.80 |
5.03 |
| 5 |
21 |
33.72 |
248.73 |
11.84 |
| 6 |
25 |
27.02 |
119.64 |
4.79 |
| 7 |
22 |
31.48 |
154.36 |
7.02 |
| 8 |
48 |
26.15 |
134.85 |
2.81 |
| 9 |
32 |
34.99 |
222.99 |
6.97 |
| 10 |
15 |
28.42 |
196.70 |
13.11 |
| 11 |
24 |
27.11 |
97.33 |
4.06 |
| Total |
301 |
330.66 |
1836.51 |
6.10 |
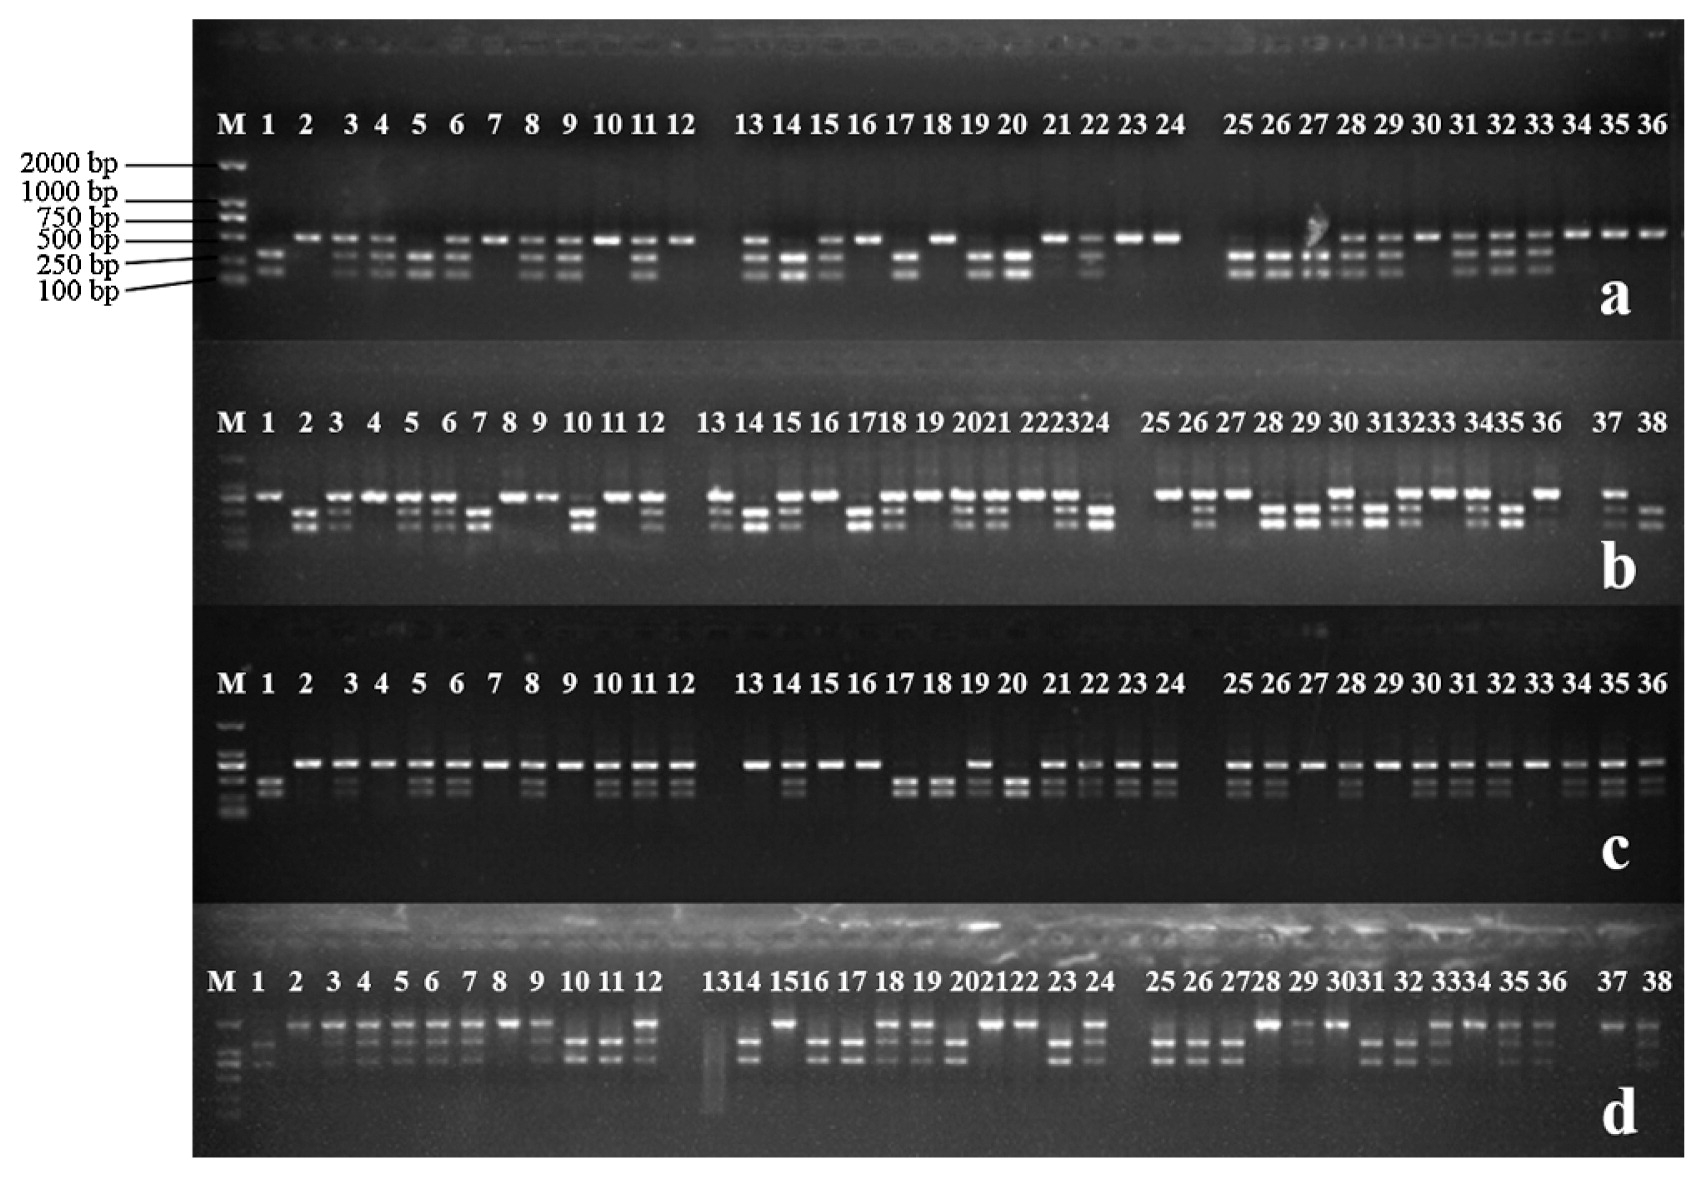
The linkage map consisted of 11 linkage groups. The largest group (chromosome 8) contained 48 markers and spanned 134.85 cM. Chromosome 10, with the smallest number of markers, contained 15 markers spanning 196.70 cM. All the 11 linkage groups covered a total genetic distance of 1836.51 cM, with a mean distance between markers of 6.1 cM. The order of most marker locations corresponded to the physical map. Using this linkage map as the reference, based on alignment most of the CAPS markers appeared to be evenly distributed across the 11 linkage groups. This provided encouragement that it would be possible to select appropriate markers for fine mapping and construction of high-density genetic maps. The genotyping of the F2 generation with CAPS markers is shown in Fig. 3.
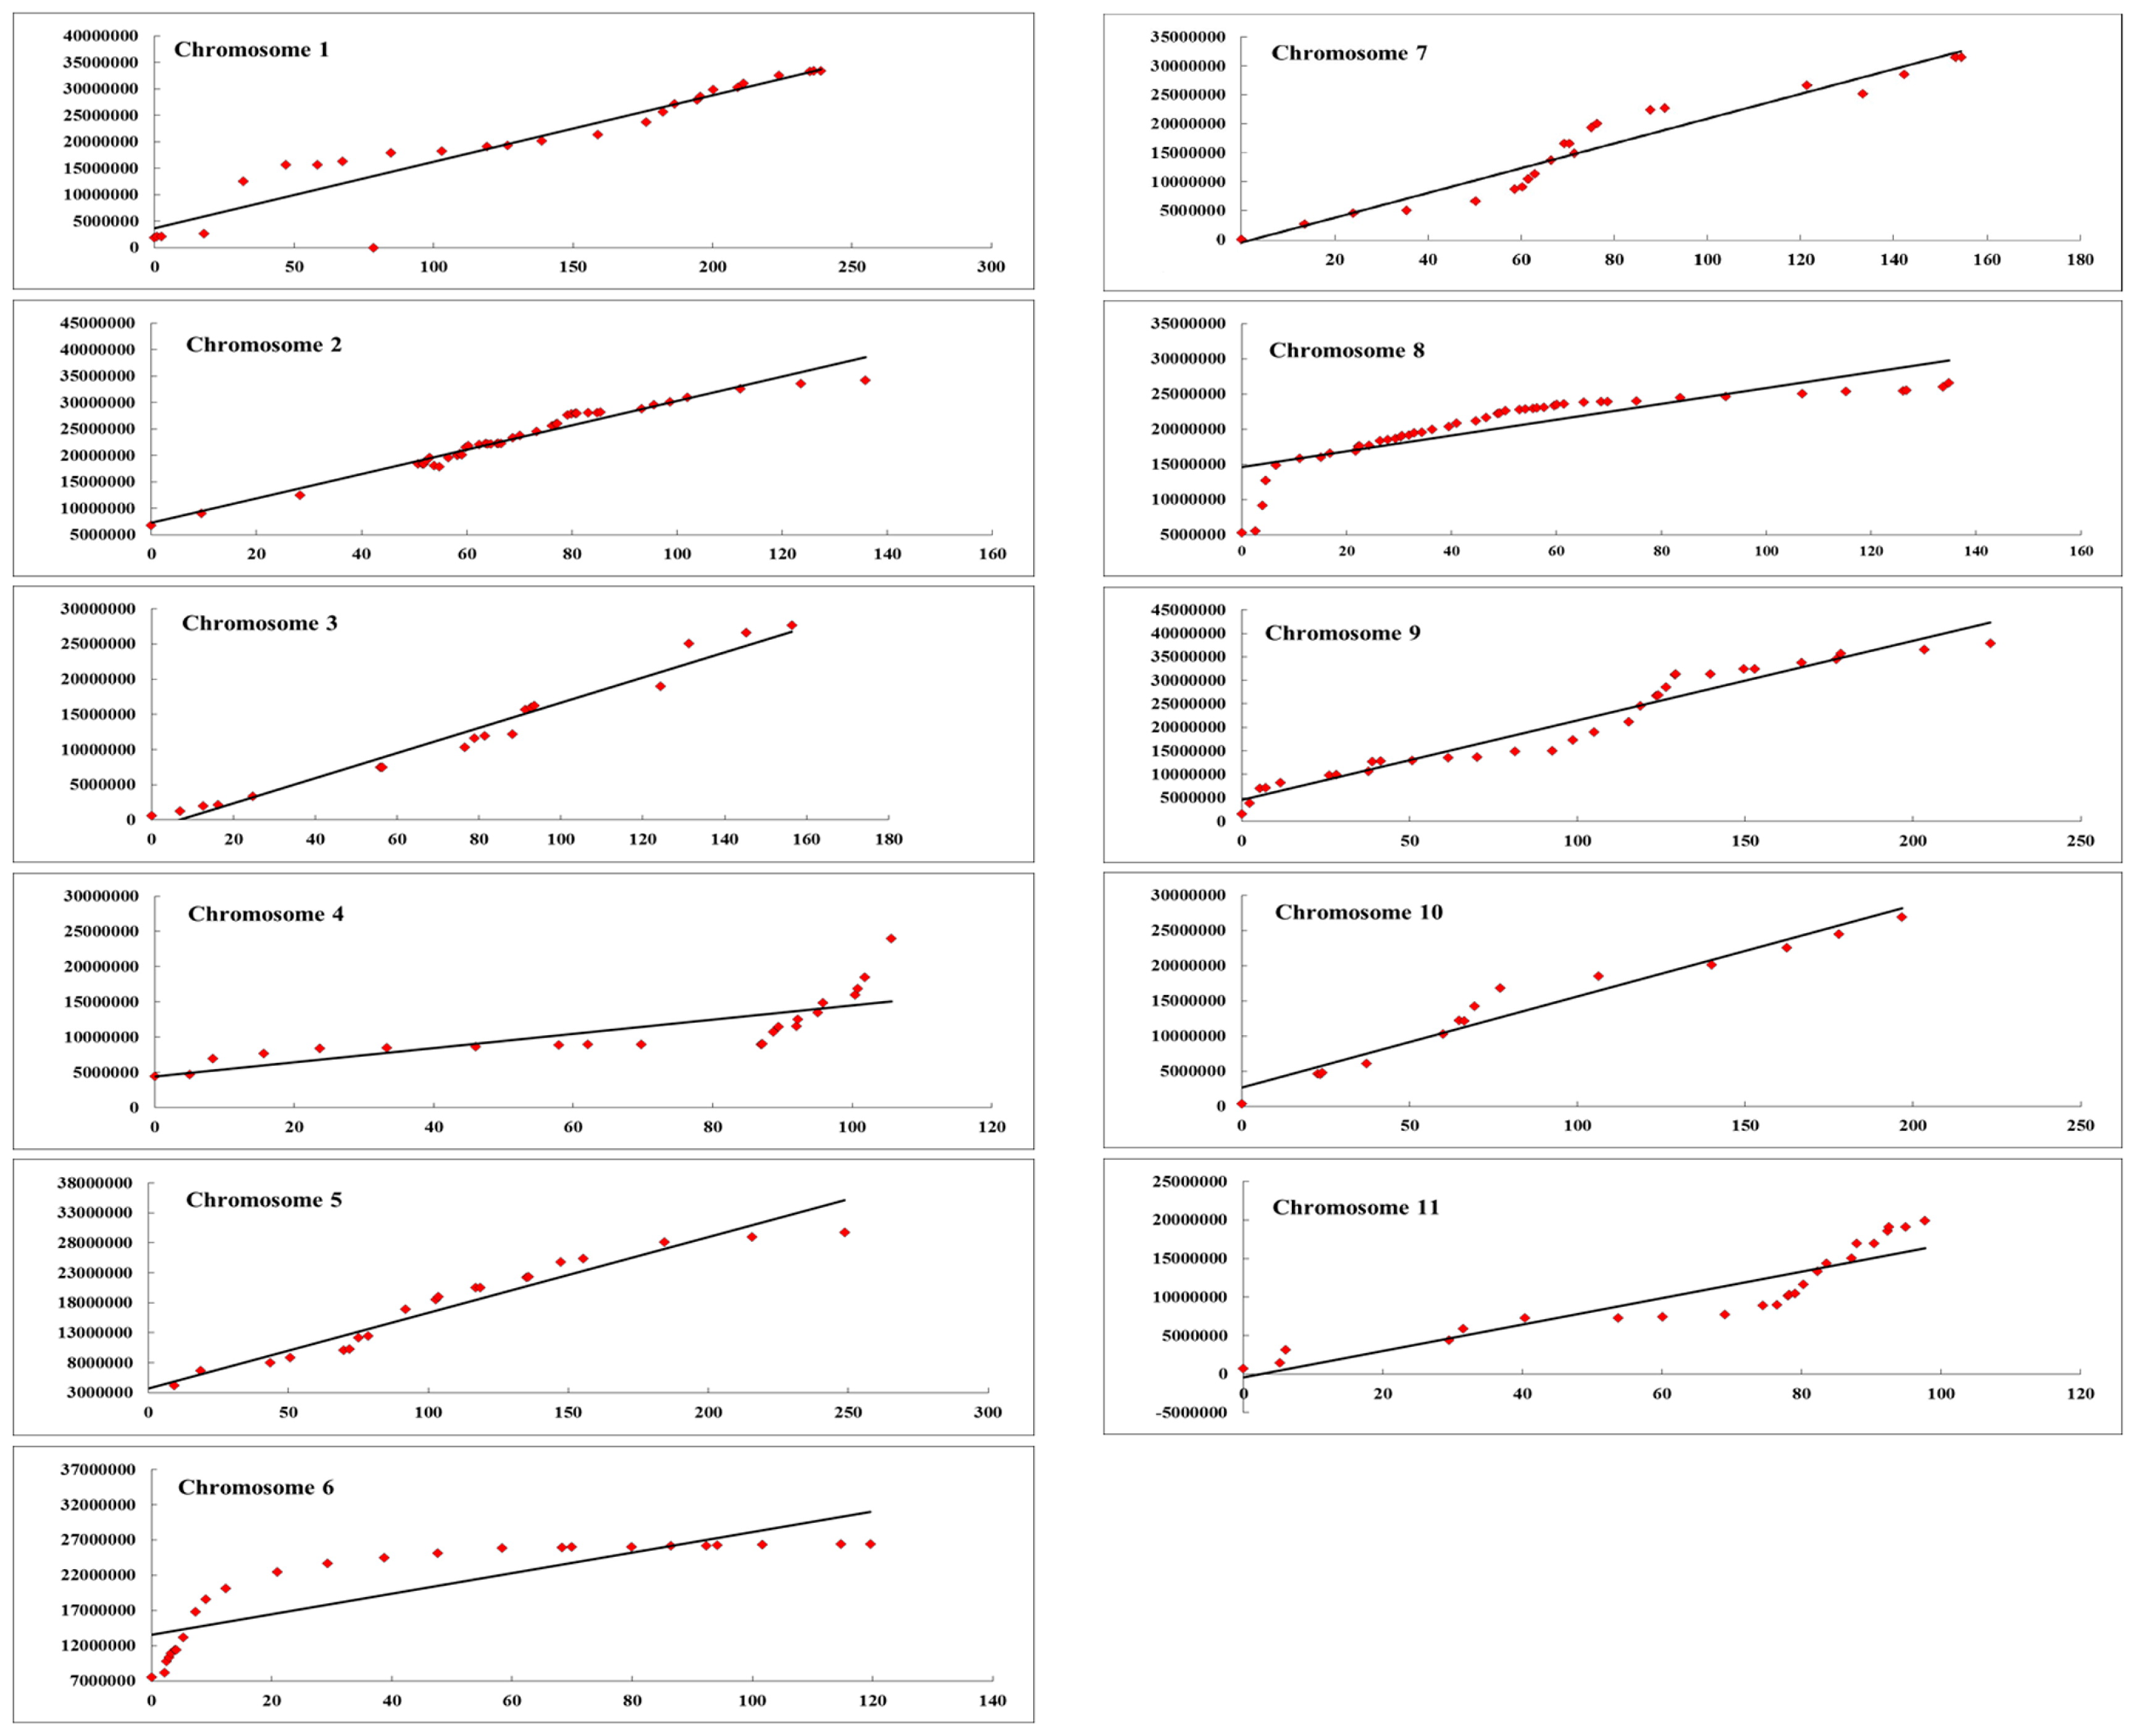
The collinearity test was also taken between the linkage map and the physical map for each chromosome. According to the result of the collinearity test (shown in Fig. 4), most of the 11 chromosomes were highly colinear with respect to their physical positions. Chromosomes 4, 6, and 8 were not properly represented on the physical map. The region on the collinearity test curve was displayed as a gently increased region and revealed an appropriate trend between the linkage groups and the physical map with a suitable marker distance. For chromosomes 4, 6 and 8, most of the curve gently increased, while some regions increased sharply, indicating that genetic gaps existed between the two regions. To solve these gaps, more markers should be developed to fill the linkage groups, based on re-sequencing data.
Phenotype performance of the F2 population and parental materials
Fruit width and fruit length
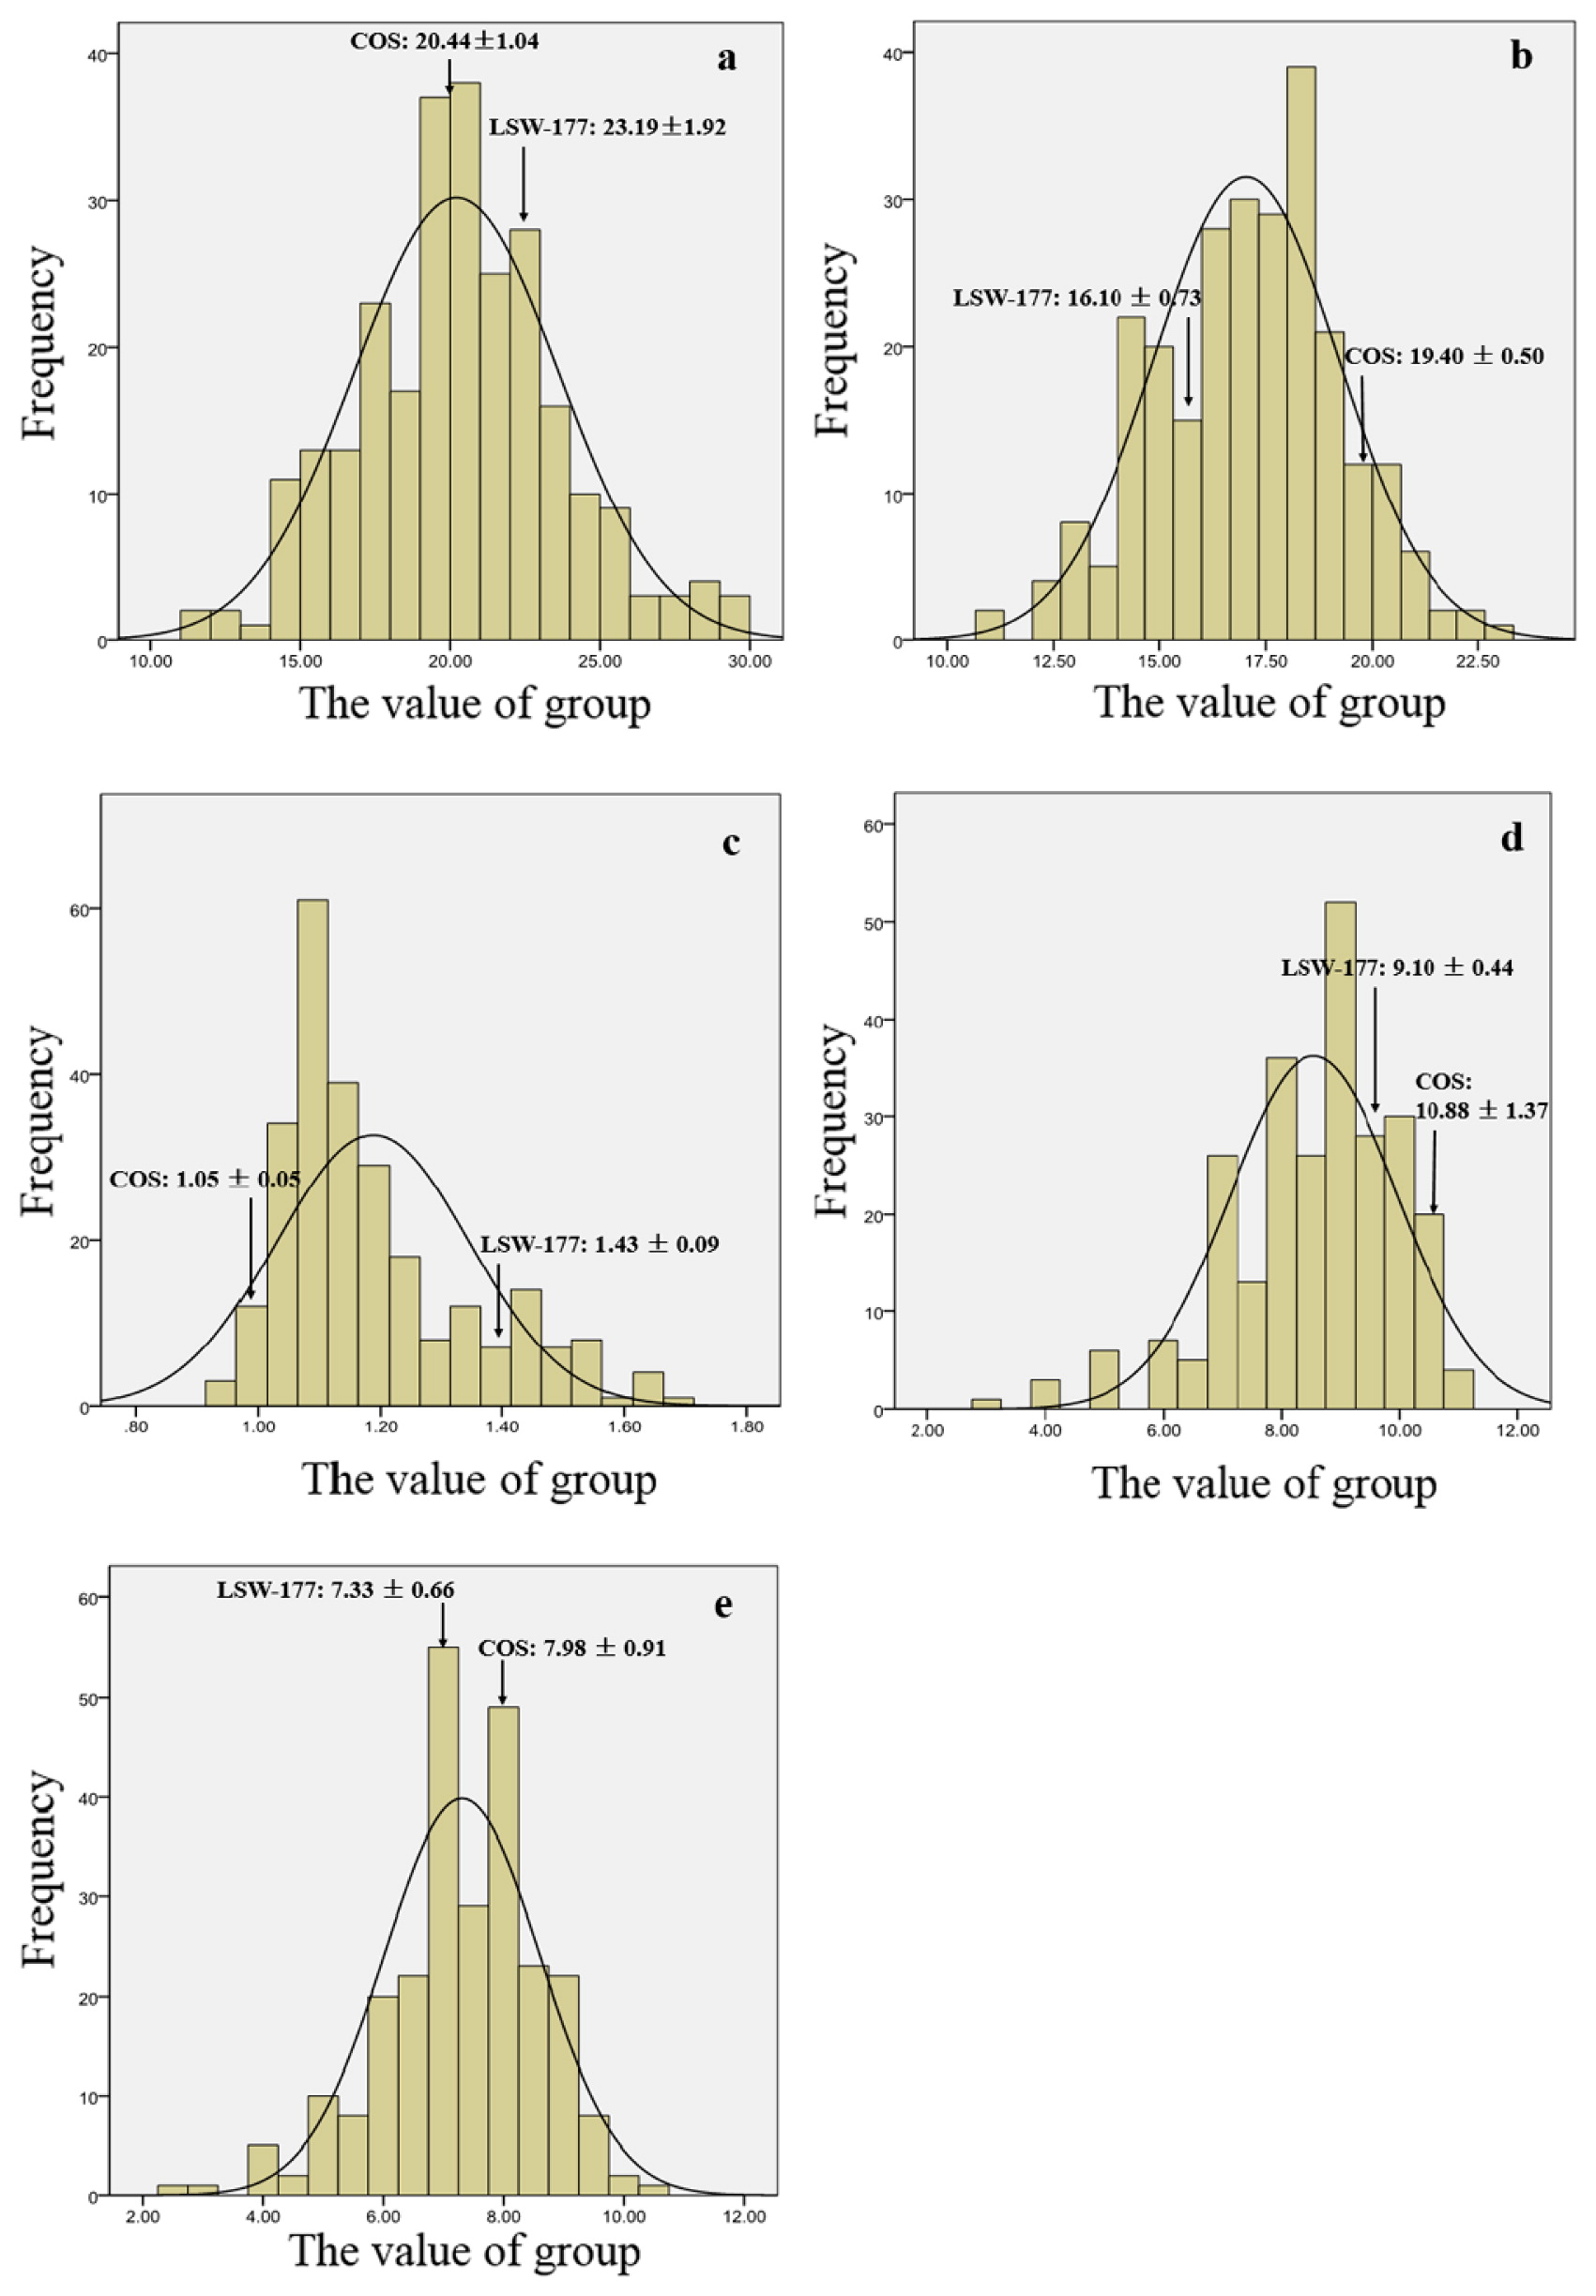
The fruit lengths and widths of the two parental materials were differed from each other. For LSW-177 and COS the mean fruit lengths were 23.09 ± 1.92 cm and 20.44 ± 1.04 cm, respectively, and the fruit widths were 16.10 ± 0.73 cm and 19.40 ± 0.50 cm. In the F1 generation, the fruit length was 24.03 ± 0.88 cm, and the width was 19.78 ± 1.17 cm, which was close to the high end of the scale for the parental materials. Among the F2 generation, fruit lengths ranged from 11.2 to 29.6 cm, and fruit widths from 10.9 to 22.7 cm, exhibiting a continuous distribution. This suggested that the parental materials of larger size exhibited some dominance, if there is a non-additive component.
Brix content
The Brix content of both the central and edge part of the fruits were measured within the P1, P2, F1, and F2 populations. In the parental strains, COS is rich in soluble solids, averaging 10.88 ± 1.37% and 7.98 ± 0.91% in the central and edge regions, respectively, which is more than that of LSW-177 (9.10 ± 0.44% and 7.33 ± 0.66%). The Brix contents of the central and edge of the fruit for the F1 generation were 9.33 ± 0.42% and 7.83 ± 0.57%, respectively. In the F2 generation, the Brix of the central part ranged from 3.0% to 11.1% and the edge ranged from 2.5% to 10.5%. For the F2 generation, both of the traits showed a continuous distribution, a characteristic of quantitative character, indicating that the Brix content was controlled by polygenes. Phenotypic values and ranges of traits were measured in the parental lines and the F1 and F2 populations (Table 4). The distribution of values for the fruit length, fruit width, and Brix content both in the central and edge portions in the F2 population are shown in Fig. 5.
Table 4
Mean phenotypic values with standard errors and ranges for traits measured in the parental strains and F
1 (30 plants) and F
2 (352 plants) populations
| Traits |
|
LSW-177 |
COS |
F1 |
F2 |
F2 range |
| Length, cm |
|
23.09 ± 1.92 |
20.44 ± 1.04 |
24.03 ± 0.88 |
20.24 ± 3.41 |
11.2–29.6 |
| Width, cm |
|
16.10 ± 0.73 |
19.40 ± 0.50 |
19.78 ± 1.17 |
17.06 ± 2.18 |
10.9–22.7 |
| Fruit shape index |
|
1.43 ± 0.09 |
1.05 ± 0.05 |
1.22 ± 0.05 |
1.19 ± 0.16 |
0.94–1.68 |
| Brix, % |
Central |
9.10 ± 0.44 |
10.88 ± 1.37 |
9.33 ± 0.42 |
8.64 ± 1.93 |
3.0–11.1 |
|
Edge |
7.33 ± 0.66 |
7.98 ± 0.91 |
7.83 ± 0.57 |
7.31 ± 1.29 |
2.5–10.5 |
The data regarding flesh color were collected by visual analysis. The flesh color of the fruits of LSW-177 and COS are red and pale yellow, respectively. For the F1 generation, the flesh color was canary yellow, close to pale yellow, suggesting dominance of the pale yellow parental trait. In the F2 generation, there were 5 categories of flesh color: red, pale yellow, canary yellow, and 2 irregular color patterns consisting of mixed pale and canary yellow, or red swirled together in separate sectors or in mixed patterns in the heart and placental tissues of the fruit. In the F2 generation, there were 87 red flesh color plants, 48 pale yellow plants and 173 canary yellow plants. Eighteen and 26 plants displayed mixed colors, respectively. Mixed pale and canary yellow was defined as flesh color >50% canary or pale yellow in cross sectional areas, so the two mixed-color plants could be classified as canary yellow and pale yellow. For the entire F2 generation, 199, 66, and 87 plants were respectively judged to have canary yellow, pale yellow and red flesh color. The ratio of the three kinds of flesh color was 9:3:4, indicating that the flesh color was affected by two genes.
QTLs detected for fruit traits
The F2 population (352 plants) derived from LSW-177 and COS was used for genetic mapping. With the CAPS-based linkage map, 12 QTLs were identified for fruit width, length, fruit shape index, Brix content (central and edge), and flesh color (Table 5).
Table 5
QTLs detected for fruit traits based on interval mapping in the F
2 population from the LSW-177 and COS cross
| Traits |
|
QTL |
Interval |
Chr |
Position |
LOD |
R2, % |
Additive |
Dominance |
| Flesh color |
|
FC4.1 |
WII04E08-38 to WII04EBsaHI-6 |
4 |
8,979,787 to 8,960,685 |
91.21 |
81.45 |
1.96 |
−0.25 |
| Length |
|
FL3.1 |
WII03E09-59 to WII03E02-87 |
3 |
16,276,758 to 23,690,289 |
6.29 |
12.5 |
1.84 |
−0.07 |
|
|
FL3.2 |
WII03E09-92 to WII03EXhoI-1 |
3 |
25,064,560 to 27,653,193 |
4.32 |
6.87 |
0.99 |
−1.03 |
| Width |
|
FW3.1 |
WII03E06-56 to WII03EKpnI-3 |
3 |
15,666,886 to 15,979,391 |
3.71 |
5.89 |
0.79 |
0.12 |
|
|
FW3.2 |
WII03E09-92 to WII03EXhoI-1 |
3 |
25,064,560 to 27,653,193 |
3.43 |
5.61 |
0.71 |
0.05 |
|
|
FW8.1 |
WII08EXhoI-4 to WII08EKpnI-5 |
8 |
20,888,282 to 21,176,544 |
7.13 |
11.67 |
−1.02 |
0.17 |
| Fruit shape index |
FSI3.1 |
WII03E02-87 to WII03E09-92 |
3 |
25,064,560 to 27,653,193 |
8.72 |
10.01 |
0.07 |
−0.02 |
|
|
FSI3.2 |
WII03E09-92 to WII03EXhoI-1 |
3 |
27,653,193 to 27,653,193 |
30.13 |
38.22 |
0.12 |
−0.09 |
|
|
FSI8.1 |
WII08EKpnI-5 to WII08EXhoI-5 |
8 |
21,176,544 to 21,690,036 |
2.85 |
2.47 |
0.03 |
0.01 |
| Brix |
Central |
BCC2.1 |
Ch2-1ScaI to Ch2-4MboII |
2 |
31,682,387 to 31,690,311 |
3.19 |
5.76 |
−0.65 |
−1.63 |
|
Edge |
BCE2.1 |
WII02E11-740 to WII02EMspI-2 |
2 |
34,170,854 to 30,501,626 |
4.31 |
8.02 |
−0.52 |
−0.09 |
|
|
BCE4.1 |
WII04E07-32 to WII04E07-37 |
4 |
8,538,374 to 8,938,685 |
3.2 |
5.4 |
0.41 |
−1.6 |
Two QTLs were detected for fruit length, and 3 QTLs for fruit width. The 2 QTLs related to fruit length (FL3.1 and FL3.2) were located on chromosome 3, and had an additive effect of 1.84 and 0.99 with R2 values of 12.50% and 6.87%. For fruit width, 3 QTLs were detected (FW3.1, FW3.2, and FW8.1) on chromosomes 3 and 8; FL3.2 and FW3.2 were located in the same region. FW3.2 and FW8.1 exhibited a reduced additive effect of 0.71 and −1.02, while the FW3.1 performed a positive additive effect with a value of 0.79. The 3 QTLs could account for the phenotypic variation of 23.2%, with R2 values of 5.89%, 5.60%, and 11.67%.
In addition, another three QTL loci (FSI3.1, FSI3.2, and FSI8.1) related to fruit shape index were also detected. FSI3.1 and FSI3.2 overlapped with FW3.1, FL3.1 and FL3.2. FSI8.1 was also located at the same position with FW8.1. FSI3.2 was a major QTL for fruit shape index with an R2 of 38.22%.
Three QTLs were found to be significant for Brix content (one for the central, and 2 for the edge portions). The 3 QTLs were distributed over chromosomes 2 and 4, and all the three QTLs were minor loci and no major QTL was detected; because there was no obvious difference between the two parental materials in Brix content. The two QTLs for the Brix content at the edge (BCE2.1 and BCE4.1) were located on chromosomes 2 and 4, with LOD scores of 4.31 and 3.20, respectively, and with individual trait variation effects of 8.02% and 5.40%. The combined effect was 13.41% of the total phenotypic variance. An additional QTL for Brix content of the central region (BCC2.1) was found with a LOD score of 3.19 on chromosome 2.
One major QTL related with flesh color (FC4.1), in the F2 population, localized on chromosome 4, may account for most of the phenotypic variation. On chromosome 4 it was between the newly developed CAPS markers WII04E08-38 and WII04EBsaHI-6, just 0.15 cM and 0.05 cM away, with a high R2 (81.45%) and LOD score of 91.21. The two CAPS markers could perfectly co-segregate with the red, pale yellow and canary yellow groups in the F2 population (data not shown). According to the re-sequencing data, we obtained the sequences between the CAPS markers WII04E08-38 and WII04EBsaHI-6; 19,731 bp were present in this region and 5 candidate genes (which can encode the protein normally, Table 7) were detected by consulting the data from the Cucurbit Genomics Database (http://www.icugi.org/cgi-bin/ICuGI/index.cgi). With the results of the open reading frame (ORF) and Basic Local Alignment Search Tool (BLAST) analysis, the lycopene beta-cyclase (LCYB) mRNA, LCYB-red allele, and Complete Coding Sequence (CDS) was only in this region with a high sequence similarity with candidate gene Cla0050011. The CAPS marker WII04EBsaHI-6 was only located in the gene Cla005011. The candidate genes are listed in Table 7.
Table 6
Simple linear correlations among traits measured in the LSW-177 and COS cross F
2 population
| Traits |
FL |
FW |
FSI |
| FL |
1 |
|
|
| FW |
0.649** |
1 |
|
| FSI |
0.672** |
−0.119* |
1 |
FL, fruit length; FW, fruit width; FSI, fruit shape index.
Table 7
Candidate genes annotation result for the flesh color
| Gene No. |
GO Molecular Functions |
| Cla005009 |
GO:0016757-transferase activity, transferring glycosyl groups |
|
GO:0016740-transferase activity |
| Cla005011 |
GO:0034019-capsanthin/capsorubin synthase activity |
|
GO:0016853-isomerase activity |
|
GO:0045435-lycopene epsilon cyclase activity |
|
GO:0016491-oxidoreductase activity |
| Cla005012 |
GO:0005524-ATP binding |
|
GO:0003774-motor activity |
|
GO:0008569-minus-end-directed microtubule motor activity |
|
GO:0008017-microtubule binding |
|
GO:0005515-protein binding |
|
GO:0000166-nucleotide binding |
|
GO:0003777-microtubule motor activity |
|
GO:0016887-ATPase activity |
| Cla005015 |
GO:0003885-D-arabinono-1,4-lactone oxidase activity |
|
GO:0042802-identical protein binding |
|
GO:0016633-galactonolactone dehydrogenase activity |
|
GO:0050660-FAD binding |
|
GO:0003824-catalytic activity |
|
GO:0050582-xylitol oxidase activity |
|
GO:0005515-protein binding |
|
GO:0050105-L-gulonolactone oxidase activity |
|
GO:0016491-oxidoreductase activity |
|
GO:0016899-oxidoreductase activity, acting on the CH-OH group of donors, oxygen as acceptor |
| Cla005016 |
GO:0016757-transferase activity, transferring glycosyl groups |
|
GO:0016740-transferase activity |
Discussion
In this study, we used the re-sequencing data from the watermelon lines LSW-177 and COS to identify CAPS loci across the assembled genome, and 271 CAPS markers displayed polymorphisms and co-dominance among the COS, LSW-177, and their F1 generation plants. A linkage map with 301 markers was constructed with an F2 population derived from LSW-177 and COS. In all, 12 QTLs related to agronomic traits were detected with the new CAPS-based linkage map.
Re-sequencing data and polymorphisms of the CAPS markers
In some published reports, the number of the SNPs were much higher than the indels. Yonemaru et al. (2015) re-sequenced 5 indica, 2 aus, and 3 tropical japonica cultivars and Japanese elite cultivar ‘Koshihikari’ to exploit the indel markers and there were 5-fold more SNPs than indels. Zhang et al. (2012) also compared 16 watermelon genotypes with the watermelon line 97103 based on whole genome re-sequencing data. The number of the SNPs were also much larger than the indels. In addition, the ratio of SNP-to-indel rose from 1.97 (PI 482271 to 97103) to 22.64 (PI 386019 to 97103), implying that different accessions had different polymorphisms when the sequences were aligned.
In our study, 225,693 SNPs and 19,268 indels (one base insert and deletion) were detected according to the re-sequencing data. The numbers of SNPs were much higher than the indels than reported in a previous study (>11-fold). Guo et al. (2013) reported that a total of 6,784,860 candidate SNPs and 965,006 indels were identified among 20 watermelon accessions when re-sequenced (the SNPs were ~7-fold that of the indels). In our research, we re-sequenced two materials for marker development so the number of the SNPs and indels were much smaller than in Guo’s research. For the indels in our study, we exploited the one base insert and deletion locus, and the ratio of the SNPs-to-indels was higher than Guo’s research.
Among each of the 11 chromosomes in watermelon, the density of SNPs and indels were very different. The different lengths of the chromosomes may contribute this phenomenon (Table 3). On the other hand, some chromosomal regions with a high SNP linkage disequilibrium (e.g., chromosomes 3 and 9) might have contributed to the process of watermelon domestication, and the regions were not uniformly distributed among the 11 watermelon chromosomes (Nimmakayala et al. 2014a). Finally, the two parental materials in our research performed quite differently from each other with regard to many traits, and the genes related to these traits were also distributed unevenly within the genome. This could have influenced the various densities in SNPs and indels.
In our study, we demonstrated the feasibility and ease of using genomic re-sequencing data to identify putative CAPS polymorphisms. These CAPS loci can then be validated to generate informative genetic markers with a reliably high rate of polymorphisms.
CAPS markers have been developed based on re-sequencing data for various crops, and polymorphisms ranged from 39.5% to 56.83% (Ganal et al. 2009, Henry 2008, Kole and Abbott 2008, Ling et al. 2009, Shu et al. 2009). Markers developed with re-sequencing data could be more accurate and efficient as research materials. Zhang et al. (2013), working with 8 tea cultivars, exploited SNP loci from derived ESTs and converted them into CAPS markers with polymorphisms of 35.9%. Pootakham et al. (2011) reported SNP markers in rubber tree, based on high-throughput 454 sequencing technology. Twenty-seven putative SNPs were evaluated and 10 positions (37%) were shown to be polymorphic among the 28 accessions used. Shu et al. (2009) designed 139 pairs of CAPS markers based on the re-sequencing data in soybean, and 79 primers (56.83%) led to finding polymorphisms among 9 varieties.
Previous studies (Levi et al. 2009, 2013, Nimmakayala et al. 2014a, Zhang et al. 2012) reported a narrow molecular diversity of 2 to 4% for cultivated watermelon, with low levels of polymorphisms. In our research, 50.94% of the designed primers showed polymorphisms after the digest reaction, a great improvement in polymorphisms. There were still 220 pairs of primers displaying nonspecific amplification in the whole genome, represented by multiple homologs. To reduce nonspecific amplification, we note that the sequence of the designed primer region should be aligned to the genome, and if there are multiple sites covering more than 30% of the sequence, these sequences should be removed as candidates (Liu et al. 2013). In addition, in future research, in silico PCR is appropriate for marker mining before the PCR reaction.
CAPS markers compared with other molecular markers
Polymorphic markers have been an important factor for map construction, gene location, diversity analysis, and linkage disequilibrium analysis of watermelon and other plants. However, for watermelon, progress in the development of molecular markers and a genetic map has been slow, although significant progress has been made in the former in recent years. In previous reports, molecular markers were used for genetic analysis of watermelon, but their effectiveness was limited due to the extremely narrow genetic background among watermelon genotypes; the number of molecular markers and polymorphisms was not satisfactory for researchers or breeders. Che et al. (2003), working with watermelon, used AFLP markers to develop a DNA fingerprint based on 15 bands amplified with 4 primer combinations, and converted one of the specific AFLP bands into a sequence characterized amplified region (SCAR) marker. However, in general, the AFLP procedure is too complicated for breeders.
In watermelon, the SSR is another important marker that has been used in research, and some researchers have reported the application of SSR markers in watermelon genetic analyses (Levi et al. 2009, Mujaju et al. 2010, Padmavathi et al. 2010, Zhang et al. 2010). Ren et al. (2012) designed SSR markers with re-sequencing data, and 41.9% of the primers revealed polymorphisms after PCR amplification between the watermelon lines 97103 and PI 296341-FR. Patricai et al. (2004) detected 700 clones including SSR sequences from a Tsp-AG/TC SSR-enriched library, and designed 144 primer pairs. Sixty-seven SSR markers were tested on melon and other cucurbit crops, and among the melon accessions, 65 pairs of markers revealed polymorphisms (45.12%). Thus, the polymorphism results using SSR markers were better than that of other markers, but the number of published SSR markers remained limited for research. Another important problem with SSRs is that they are usually located in non-coding sequences. Based on re-sequencing data, we found a good number of new markers. For some anchoring regions, we also obtained some markers for fine gene mapping (Kim et al. 2010, Lv et al. 2013).
With progress in high-throughput re-sequencing, SNP markers became more and more utilitarian for genetic studies. As a simple and low cost detection method, CAPS markers have an immense advantage. Compared with other kinds of markers, CAPS are easier to use and more widely throughout the genome. We were able to develop 271 pairs of primers via 16 restriction enzymes, and more markers could be exploited by other kinds of enzymes if needed. More importantly, since the coordinates of the CAPS markers are known in relation to a reference genome, it is possible to develop genetic markers within specific regions of the genome to assist in efficient construction of genetic maps and for fine mapping. For marker-assisted selection, CAPS markers could also be effective, (Bang et al. 2010). This is a powerful new method to identify SNPs, more useful and effective than traditional methods for developing markers.
Map construction based on re-sequencing data
In previous studies, mapping markers were determined through marker selection, largely according to published primers and the genetic distance between the parental materials. Based on re-sequencing data, molecular markers have been developed for many crops (Bachlava et al. 2012, Gujaria et al. 2011, Liu et al. 2013), but the number of newly developed CAPS markers, and CAPS-based map construction, was limited, especially in watermelon. In our research, a linkage map based on CAPS markers was constructed with an F2 population of 352 plants, derived from the parental lines LSW-177 and COS. The genetic linkage map is a useful tool for gene mapping, and many watermelon linkage maps have been constructed using different kinds of markers (Hashizume et al. 2003, Levi et al. 2006, Navot et al. 1990, Zhang et al. 2004), mostly from the genomic library and EST-public databases, which cannot anchor marker locations. For most linkage maps, we cannot correspond linkage groups to chromosomes, and unpredictable location markers has been a factor slowing the progress of watermelon research. Using re-sequencing data, each CAPS marker can be located among the 11 watermelon chromosomes. In the present research, 11 linkage groups were obtained after analysis with IciMapping V3.3 software, and all the linkage groups could be assigned to the corresponding chromosomes. The order of the CAPS markers on the linkage map mostly conformed to the distribution of the physical map.
In recent years, some watermelon linkage maps with SNP markers based on re-sequencing and genotyping via the sequencing techniques were reported, which largely improved the precision and the saturability of the linkage maps (Lambel et al. 2014, Reddy et al. 2014, Sandlin et al. 2012). Here, we developed a CAPS-based watermelon linkage map with 301 CAPS and SSR markers that were suitable for genetic mapping and studies. The genetic map covered all 11 chromosomes spanning 1 836.51cM. Sandlin et al. (2012) first constructed three SNP watermelon linkage maps with 378, 357, and 388 SNP markers spanning 1 438, 1 514 and 1 144 cM, respectively. In Ren et al. (2012), genetic maps of <800 cM agreed well with watermelon’s small genome size of 450 Mb. For our research and most of the reported SNP maps, the map lengths were much higher than the 800 cM. An important reason for the large map length is the quantity and density of the markers. The position of the markers was another factor affecting the genetic distance; a large gap between the adjacent markers on the linkage groups results in a large genetic distance. The linkage map constructed by Ren et al. (2012) incorporated 953 markers covering 800 cM with a mean interval of 0.8 cM, which is the most highly saturated map for watermelon in the current studies.
Gaps >20 cM in the linkage groups were still generated in some studies (Hashizume et al. 2003, Nimmakayala et al. 2014b). Furthermore, most of the SSR markers used for map construction were derived from published primers, which were not specific enough for the experimental materials. For this reason, the linkage maps could not identify the amount of genome covered, and this was a limiting factor in the genetic study of watermelon. Colinearity is another important reference point for linkage map construction. Most of the linkage groups revealed high colinearity to the physical map.
There were still some parts which disagree with the draft genome, and the same results were also obtained in the other SNP watermelon linkage maps (Reddy et al. 2014, Ren et al. 2015). Firstly, the CAPS (SNP) locus in some regions on the chromosomes were not evenly distributed, as reflected by the different slopes of the curves of each chromosome (Fig. 1), leading some loci away from the base line. Secondly, the re-sequencing data of the two parental materials were assembled based on the reference genome, and there were still some gaps that could not be sequenced, and some fragments could not be assembled. For these regions, markers could not be designed, and the trend of the curves was not upward smoothly, also making some loci deviate away from the base line. Thirdly, a larger mapping population would more accurately reflect the linear relationship between the genetic and physical positions. To solve this problem, some other kinds of markers, such as indels, SSRs, or AFLPs should be added in the map construction as well as more watermelon genome data.
More markers need to be developed in the region where there are genetic gaps. With the re-sequencing data, many markers could be developed in the gap region. According to the re-sequencing data, about 12,023 pairs of sequences which could not be assembled to the genome were named chromosome 0. WII0E09-94, WII0E09-99, and WII0E09-63 were designed and assigned to Chromosomes 2, 5, and 8. For the SSR marker selection, 23 pairs of the core SSR markers reported by Zhang et al. (2012) were also used. As a result, 10 SSR markers detected polymorphisms between the two parental materials, and 9 pairs of SSR markers with their locations on chromosomes, assigned in our linkage map distributed among 8 chromosomes. Both the CAPS markers and the core SSR markers could be used as anchor markers for future map integration. The polymorphic melon SSR markers can also be helpful as anchor markers for a comparative map of watermelon and melon.
As a suitable resource for marker development, with the re-sequencing data specific markers could be exploited to fill the gap in the linkage groups, increasing marker density. The CAPS-based map in this study, which can be used as a bridge to other watermelon genetic maps, will assist the construction of a watermelon reference map.
QTL analysis based on CAPS markers
Re-sequencing data provided us a new approach for QTL detection and marker-assisted selection (Chai et al. 2012, Majer et al. 2014, Neelam et al. 2013). QTL detection for watermelon has been an important mission in watermelon breeding. The main flesh pigments in cultivated watermelons are lycopene, carotene, and xanthophyll (Sato et al. 1981) which greatly affect the flesh color of watermelon and other cucurbit plants. One major QTL for flesh color was mapped in our study, on chromosomes 4 (LOD, 91.21) with a trait variation of 81.45%. This location is the same as reported by Zhang et al. (2014) in watermelon based on F2, recombinant inbred lines, and (back cross)-F2 genetic populations crossed with a red and a white fresh-colored watermelon. The adjacent markers from FC4.1 were WII04E08-38 and WII04EBsaHI-6, which co-segregated with the red, pale yellow, and canary yellow flesh color in the F2 generation. Bang et al. (2007) also developed a CAPS marker (Phe226) which could also co-segregate with the canary yellow and red flesh color phenotype. Compared with Phe226, WII04E08-38 and WII04EBsaHI-6, the three markers were located on chromosome 4 in the same region but not the same position. According to the results of Bang et al. (2007) and the BLAST analysis results, the full-length of LCYB cDNA was in this region. Lycopene β-cyclase (LCYB) was regarded as the gene determining lycopene content or the color dominant gene in watermelon, and lycopene was the predominant carotenoid responsible for the red flesh color of watermelon (Bang et al. 2010, 2014).
For melon and cucumber, some studies reported that flesh color was controlled by both major genes and polygenes. Eleven QTLs for orange flesh color and carotenoid content in melon was reported by Harel-Beja et al. (2010) using a recombinant inbred line population derived from two melon subspecies. For both cucumber and melon, the flesh color of the endocarp and mesocarp differs, reflecting the β-carotene content, to some extent. Some studies have reported that the flesh color of the two parts is controlled by at least 2 recessive genes (Clayberg 1992, Cuevas et al. 2010). Cuevas et al. (2008) and Monforte et al. (2004) suggested that a gene stimulating the carotenoid metabolic pathway was located on linkage group 6 in melon, which led to the formation of β-carotene. Bo et al. (2011) detected seven SSR markers that are closely related with the β-carotene content in cucumber, and SSR marker SSR07706 may serve as a marker for cucumber germplasm selection. Tzuri et al. (2015), developed a “golden” SNP marker that governs the CmOr gene responsible for the non-orange and orange melon flesh color in melon. Measuring the content of other pigments in watermelon flesh could alleviate this limitation of the present preliminary study. However, we identified the location of the flesh color QTL in the linkage map.
Brix content is an important trait in watermelon breeding. It is thought to be polygenic, and is known to be influenced by both genetic background and environment (Gusmini and Wehner 2006, Hashizume et al. 2003). In our research, both the central and edge portions of the fruit flesh of the 2 parental lines were analyzed for Brix content. With the linkage map, 3 QTLs were detected and they are all minor, based upon the similarity between the two parental materials in Brix content. The 13.41% phenotypic variation can be explained by 2 QTLs related to the brix content of the edge. A QTL related to the Brix content of the center was also detected on chromosome 2, but with a low R2 value (5.76%).
Some other studies have reported QTLs related with the Brix or sugar content. Guo et al. (2006) detected 2 major QTLs related with Brix content using a recombinant inbred line population in a 2-year and 3-environment study of watermelon. The 2 QTLs were located on group 1, with stable expression in different environments. Sandlin et al. (2012) used an SNP linkage map to detect QTLs related to Brix content on chromosomes 7, 8 and 9, with R2 ranging from 7.0% to 21.6%. Combined with previous reports, the three QTLs detected in our study are all novel loci. It appears that different watermelon genetic backgrounds have yielded different results. More markers should be added for further research, or new materials should be selected for a larger significant difference in Brix content.
Fruit length and width are the main determinants of fruit size. Fruit size has been well studied in many plants, but seldom in watermelon. However, some research has been reported for melon. Périn et al. (2002) reported 6 fruit shape QTLs in 2 populations of melon recombinant inbred lines. Monforte et al. (2004) detected 7 QTLs in melon. According to the two reports, 4 QTLs associated with fruit shape were detected in common. For watermelon, recent research for fruit shape has been reported by Sandlin et al. (2012), who detected QTLs related to fruit length, width, and shape index in chromosomes 5, 6, 9, 10, and 11, with R2 values ranging from 2.8% to 40.8%. In this study, there was a significant difference in the fruit shape index between LSW-177 and COS. LSW-177 producing an elongated fruit while COS had a spherical fruit shape. Five QTLs were detected in our research with the linkage map; FSI3.2 showed a higher R2 value than the other loci (38.22%). Our results may supplement theirs regarding QTLs related to fruit length and width. As in the findings of Sandlin et al. (2012), most QTL regions of the three traits (fruit length, fruit width, and fruit shape index) overlapped indicating that the three traits had a high correlation. The field data also showed a high correlation among the 3 traits (Table 6).
Our study shows that whole-genome sequence data substantially enhances the efficiency of polymorphic marker development for linkage map construction, QTL fine mapping, and the identification of possible candidate genes.
Acknowledgments
This research was supported by the National Nature Science Foundation of China (31272186). This work was also supported by the China Agriculture Research System (CARS-26-02).
Literature Cited
- Bachlava, E., C.A. Taylor, S. Tang, J.E. Bowers, J.R. Mandel, J.M. Burke and S.J. Knapp (2012) SNP discovery and development of a high-density genotyping array for sunflower. PLoS ONE 7: e29814.
- Bang, H., S. Kim, D. Leskovar and S. King (2007) Development of a codominant CAPS marker for allelic selection between canary yellow and red watermelon based on SNP in lycopene β-cyclase (LCYB) gene. Mol. Breed. 20: 63–72.
- Bang, H., A.R. Davis, S. Kim, D.I. Leskovar and S.R. King (2010) Flesh color inheritance and gene interactions among canary yellow, pale yellow, and red watermelon. J. Amer. Soc. Hort. Sci. 135: 362–368.
- Bang, H., G. Yi, S. Kim, D. Leskovar and B.S. Patil (2014) Watermelon lycopene β-cyclase: promoter characterization leads to the development of a PCR marker for allelic selection. Euphytica 3: 363–378.
- Bo, K., H. Song, J. Shen, C. Qian, J.E. Staub, P.W. Simon, Q. Lou and J. Chen (2011) Inheritance and mapping of the ore gene controlling the quantity of β-carotene in cucumber (Cucumis sativus L.) endocarp. Mol. Breed. 30: 335–344.
- Chagne, D., R.N. Crowhurst, M. Pindo, A. Thrimawithana, C. Deng, H. Ireland, M. Fiers, H. Dzierzon, A. Cestaro, P. Fontana et al. (2014) The draft genome sequence of European Pear (Pyrus communis L. ‘Bartlett’) PLoS ONE 9: e92644.
- Chai, Y.C., X.M. Hao, X.H. Yang, W.B. Allen, J.M. Li, J.B. Yan, B. Shen and J.S. Li (2012) Validation of DGAT1-2 polymorphisms associated with oil content and development of functional markers for molecular breeding of high-oil maize. Mol. Breed. 29: 939–949.
- Che, K.P., Y. Xu, C.Y. Liang, G.Y. Gong, M.L. Weng, H.Y. Zhang, D.M. Jin and B. Wang (2003) AFLP fingerprint and SCAR marker of watermelon core collection. Acta Bot. Sin. 45: 731–735.
- Clayberg, C.D. (1992) Interaction and linkage test of flesh color genes in Cucumis melo L. Cucurbit Genet. Coop. Rep. 15: 53.
- Cuevas, H.E., J.E. Staub, P.W. Simon, J.E. Zalapa and J.D. McCreight (2008) Mapping of genetic loci that regulate quantity of beta-carotene in fruit of US Western shipping melon (Cucumis melo L.). Theor. Appl. Genet. 117: 1345–1359.
- Cuevas, H.E., H. Song, J.E. Staub and P.W. Simon (2010) Inheritance of beta-carotene-associated flesh color in cucumber (Cucumis sativus L.) fruit. Euphytica 171: 301–311.
- Danin-Poleg, Y., N. Reis, G. Tzuri and N. Katzir (2001) Development and characterization of microsatellite markers in Cucumis. Theor. Appl. Genet. 102: 61–72.
- Davis, A.R., J. Collins, P. Perkins-Veazie and A. Levi (2008) LSW-177 and LSW-194: Red-fleshed watermelon lines with low-total soluble solids. HortScience 43: 538–539.
- Fazio, G., J.E. Staub and S.M. Chung (2002) Development and characterization of PCR markers in cucumber. HortScience 127: 545–557.
- Feng, D., W.H. Ling and R.D. Duan (2010) Lycopene suppresses LPS-induced NO and IL-6 production by inhibiting the activation of ERK, p38MAPK, and NF-k B in macrophages. Inflamm. Res. 59: 115–121.
- Fernandez-silva, I., I. Eduardo, J. Blanca, C. Esteras, B. Pico, F. Nuez, P. Arus, J. Garcia-Mas and A.J. Monforte (2008) Bin mapping of genomic and EST-derived SSRs in melon (Cucumis melo L.). Theor. Appl. Genet. 118: 139–150.
- Ganal, M.W., T. Altmann and M.S. Röder (2009) SNP identification in crop plants. Curr. Opin. Plant Biol. 12: 211–217.
- Gonzalo, M.J., M. Oliver, J. Garcia-Mas, A. Monfort, R. Dolcet-Sanjuan, N. Katzir, P. Arus and A.J. Monforte (2005) Simple-sequence repeat markers used in merging linkage maps of melon (Cucumis melo L.). Theor. Appl. Genet. 110: 802–811.
- Gujaria, N., A. Kumar, P. Dauthal, A. Dubey, P. Hiremath, A.B. Prakash, A. Farmer, M. Bhide, T. Shah, P.M. Gaur et al. (2011) Development and use of genic molecular markers (GMMs) for construction of a transcript map of chickpea (Cicer arietinum L.). Theor. Appl. Genet. 122: 1577–1589.
- Guo, S.G., Y. Xu, H.Y. Zhang and G.Y. Gong (2006) QTL analysis of soluble solids content in watermelon under different environments. Mol. Plant Breed. 4: 393–398.
- Guo, S.G., J.G. Zhang, H.H. Sun, J. Salse, L.Y. Mao, Y. Ren and Z.W. Wang (2013) The draft genome of watermelon (Citrullus lanatus) and resequencing of 20 diverse accessions. Nat. Genet. 45: 51–U82.
- Gusmini, G. and T.C. Wehner (2006) Qualitative inheritance of rind pattern and flesh color in watermelon. J. Hered. 97: 177–185.
- Harel-Beja, R., G. Tzuri, V. Portnoy, M. Lotan-Pompan, S. Lev, S. Cohen, N. Dai, L. Yeselson, A. Meir, S.E. Libhaber et al. (2010) A genetic map of melon highly enriched with fruit quality QTLs and EST markers, including sugar and carotenoid metabolism genes. Theor. Appl. Genet. 121: 511–533.
- Hashizume, T., I. Shimamoto and M. Hirai (2003) Construction of a linkage map and QTL analysis of horticultural traits for watermelon [Citrullus lanatus (Thunb.) Matsum and Nakai] using RAPD, RFLP and ISSR markers. Theor. Appl. Genet. 106: 779–785.
- Henry, R.J. (2008) Plant genotyping II: SNP technology. CABI, Wallingford in watermelon, Citrullus lanatus Thunb. Matsum. and Nakai. 186: 329–342.
- Hirakawa, H., K. Shirasawa, K. Miyatake, T. Nunome, S. Negoro, A. Ohyama, H. Yamaguchi, S. Sato, S. Isobe, S. Tabata et al. (2014) Draft genome sequence of eggplant (Solanum melongena L.): the representative solanum species indigenous to the Old World. DNA Res. 21: 649–660.
- Joobeur, T., G. Gusmini, X. Zhang, A. Levi, Y. Xu, T.C. Wehner, M. Oliver and R.A. Dean (2006) Construction of a watermelon BAC library and identification of SSRs anchored to melon or Arabidopsis genomes. Theor. Appl. Genet. 2: 1553–1562.
- Kim, K.S., S. Bellendir, K.A. Hudson, C.B. Hill, G.L. Hartman, D.L. Hyten, M.E. Hudson and B.W. Diers (2010) Fine mapping the soybean aphid resistance gene Rag1 in soybean. Theor. Appl. Genet. 120: 1063–1071.
- Kitashiba, H., F. Li, H. Hirakawa, T. Kawanabe, Z.W. Zou, Y. Hasegawa, K. Tonosaki, S. Shirasawa, A. Fukushima, S. Yokoi et al. (2014) Draft sequences of the radish (Raphanus sativus L.) genome. DNA Res. 21: 481–490.
- Kole, C. and A.G. Abbott (2008) Principles and practices of plant genomics, vol. 1. Genome mapping Science Publishers, Enfield.
- Lambel, S., B. Lanini, E. Vivoda, J. Fauve, W.P. Wechter, K.R. Harris-Shultz, L. Massey and A. Levi (2014) A major QTL associated with Fusarium oxysporum race 1 resistance identified in genetic populations derived from closely related watermelon lines using selective genotyping and genotyping-by-sequencing for SNP discovery. Theor. Appl. Genet. 127: 2105–2115.
- Levi, A., C.E. Thomas, T. Trebitsh, A. Salman, J. King, J. Karalius, M. Newman, O.U.K. Reddy, Y. Xu and X. Zhang (2006) An extended linkage map for watermelon based on SRAP, AFLP, SSR, ISSR, and RAPD markers. J. Amer. Soc. Hort. Sci. 131: 393–402.
- Levi, A., P. Wechter and A. Davis (2009) EST-PCR markers representing watermelon fruit genes are polymorphic among watermelon heirloom cultivars sharing a narrow genetic base. Plant Genet. Resour. 7: 16–32.
- Levi, A., J.A. Thies, W.P. Wechter, H.F. Harrison, A.M. Simmons, U.K. Reddy, P. Nimmakayala and Z.F. Fei (2013) High frequency oligonucleotides: targeting active gene (HFO-TAG) markers revealed wide genetic diversity among Citrullus spp. accessions useful for enhancing disease or pest resistance in watermelon cultivars. Genet. Resour. Crop. Ev. 2: 427–440.
- Li, G. and C.F. Quiros (2001) Sequence-related amplified polymorphism (SRAP), a new marker system based on a simple PCR reaction: its application to mapping and gene tagging in Brassica. Theor. Appl. Genet. 103: 455–461.
- Li, H. and R. Durbin (2009) Fast and accurate short read alignment with Burrows-Wheeler transform. Bioinformatics 25: 1754–1760.
- Li, H., B. Handsaker, A. Wysoker, T. Fennell, J. Ruan, N. Homer, G. Marth, G. Abecasis, R. Durbin and 1000 Genome Project Data Processing Subgroup (2009) The Sequence alignment/map (SAM) format and SAMtools. Bioinformatics 25: 2078–2079.
- Ling, K.S., K.R. Harris, J.D.F. Meyer, A. Levi, N. Guner, T.C. Wehner, A. Bendahmane and M.J. Havey (2009) Non-synonymous single nucleotide polymorphisms in the watermelon eIF4E gene are closely associated with resistance to Zucchini yellow mosaic virus. Theor. Appl. Genet. 120: 191–200.
- Liu, B., Y. Wang, W. Zhai, J. Deng, H. Wang, Y. Cui, F. Cheng, X.W. Wang and J. Wu (2013) Development of indel markers for Brassica rapa based on whole-genome re-sequencing. Theor. Appl. Genet. 126: 231–239.
- Luan, F., I. Delannay and J.E. Staub (2008) Chinese melon (Cucumis melo L.) diversity analyses provide strategies for germplasm curation, genetic improvement, and evidentiary support of domestication patterns. Euphytica 164: 445–461.
- Lv, H.H., L.M. Yang, J.G. Kang, Q.B. Wang, X.W. Wang, Z.Y. Fang, Y.M. Liu, M. Zhuang, Y.Y. Zhang, Y. Lin et al. (2013) Development of indel markers linked to Fusarium wilt resistance in cabbage. Mol. Breed. 32: 961–967.
- Majer, A., B. Javornik, A. Cerenak and J. Jakse (2014) Development of novel EST-derived resistance gene markers in hop (Humulus lupulus L.). Mol. Breed. 33: 61–74.
- Monforte, A.J., M. Oliver, M.J. Gonzalo, J.M. Alvarez, R. Dolcet-Sanjuan and P. Arús (2004) Identification of quantitative trait loci involved in fruit quality traits in melon (Cucumis melo L.). Theor. Appl. Genet. 108: 750–758.
- Mujaju, C., J. Sehic, G. Werlemark, L. Garkava-Gustavsson, M. Fatih and H. Nybom (2010) Genetic diversity in watermelon (Citrullus lanatus) landraces from Zimbabwe revealed by RAPD and SSR markers. Hereditas 147: 142–153.
- Navot, N., M. Sarfatti and D. Zamir (1990) Linkage relationships of genes affecting bitterness and flesh color in watermelon. J. Hered. 81: 162–165.
- Neelam, K., G. Brown-Guedira and L. Huang (2013) Development and validation of a breeder-friendly KASPar marker for wheat leaf rust resistance locus Lr21. Mol. Breed. 31: 233–237.
- Nimmakayala, P., A. Levi, L. Abburi, V.L. Abburi, Y.R. Tomason, T. Saminathan, V.G. Vajja, S. Malkaram, R. Reddy, T.C. Wehner et al. (2014a) Single nucleotide polymorphisms generated by genotyping by sequencing to characterize genome-wide diversity, linkage disequilibrium, and selective sweeps in cultivated watermelon. BMC Genomics 15: 767.
- Nimmakayala, P., V.L. Abburi, A. Bhandary, L. Abburi, V.G. Vajja, R. Reddy, S. Malkaram, P. Venkatramana, A. Wijeratne, Y.R. Tomason et al. (2014b) Use of VeraCode 384-plex assays for watermelon diversity analysis and integrated genetic map of watermelon with single nucleotide polymorphisms and simple sequence repeats. Mol. Breed. 34: 537–548.
- Padmavathi, N., Y.R. Tomason, J. Jeong, S.K. Ponniah, A. Karunathilake, A. Levi, R. Perumal and U.K. Reddy (2010) Genetic reticulation and interrelationships among citrullus species as revealed by joint analysis of shared AFLPs and species-specific SSR alleles. Plant Genet. Resour. 8: 16–25.
- Périn, C., L.S. Hagen, N. Giovinazzo, D. Besombes, C. Dogimont and M. Pitrat (2002) Genetic control of fruit shape acts prior to anthesis in melon (Cucumis melo L.). Mol. Genet. Genomics 266: 933–941.
- Pirona, R., I. Eduardo, I. Pacheco, C.D.S. Linge, M. Miculan, I. Verde, S. Tartarini, L. Dondini, G. Pea, D. Bassi et al. (2013) Fine mapping and identification of a candidate gene for a major locus controlling maturity date in peach. BMC Plant Biol. 13: 166.
- Pompanon, F., A. Bonin, E. Bellemain and P. Taberlet (2005) Genotyping errors: Causes, consequences and solutions. Nat. Rev. Genet. 6: 847–859.
- Pootakham, W., J. Chanprasert, N. Jomchai, D. Sangsrakru, T. Yoocha, K. Therawattanasuk and S. Tangphatsornruang (2011) Single nucleotide polymorphism marker development in the rubber tree, Hevea brasiliensis (euphorbiaceae). Am. J. Bot. 98: e337–e338.
- Reddy, U.K., P. Nimmakayala, A. Levi, V.L. Abburi, T. Saminathan, Y.R. Tomason, G. Vajja, R. Reddy, L. Abburi, T.C. Wehner et al. (2014) High-resolution genetic map for understanding the effect of genome-wide recombination rate on nucleotide diversity in watermelon. G3 (Bethesda) 4: 2219–2230.
- Ren, R.S., R. Ray, P.F. Li, J.H. Xu, M. Zhang, G. Liu, X.F. Yao, A. Kilian and X.P. Yang (2015) Construction of a high-density DArTseq SNP-based genetic map and identification of genomic regions with segregation distortion in a genetic population derived from a cross between feral and cultivated-type watermelon. Mol. Genet. Genomics 290: 1457–1470.
- Ren, Y., H. Zhao, Q.H. Kou, J. Jiang, S.G. Guo, H.Y. Zhang, W.J. Hou, X.H. Zou, H.H. Sun, G.Y. Gong et al. (2012) A high resolution genetic map anchoring scaffolds of the sequenced watermelon genome. PLoS ONE 7: e29453.
- Sandlin, K., J. Prothro, A. Heesacker, N. Khalilian, R. Okashah, W. Xiang, E. Bachlava, D.G. Caldwell, C.A. Taylor, D.K. Seymour et al. (2012) Comparative mapping in watermelon [Citrullus lanatus (Thunb.) Matsum. et Nakai]. Theor. Appl. Genet. 125: 1603–1618.
- Sato, H., B. Takanishi, S. Hirota, M. Chino, T. Saito and K. Watanabe (1981) Studies of various watermelon color and their color and color-difference measurements (Tokyo, Japan). Annu. Rep. Coll. Agr. Vet. Med. Nihon. Univ.
- Shu, Y.J., Y. Li, X. Bai, H. Cai, W. Ji and Y.M. Zhu (2009) Development of soybean gene-driven functional CAPS markers based on gene resequencing. Acta Agron. Sin. 35: 2015–2021.
- Silberstein, L., I. Kovalski, Y. Brotman, C. Perin, C. Dogimont, M. Pitrat, J. Klingler, G. Thompson, V. Portnoy, N. Katzir et al. (2003) Linkage map of Cucumis melo including phenotypic traits and sequence-characterized genes. Genome 46: 761–773.
- Thiel, T., R. Kota, I. Grosse, N. Stein and A. Graner (2004) SNP2CAPS: a SNP and INDEL analysis tool for CAPS marker development. Nucleic Acids Res. 32: e5.
- Tzuri, G., X.J. Zhou, N. Chayut, H. Yuan, V. Portnoy, A. Meir, U. Sa’ar, F. Baumkoler, M. Mazourek, E. Lewinsohn et al. (2015) A ‘golden’ SNP in CmOr governs the fruit flesh color of melon (Cucumis melo). Plant J. 2: 267–279.
- Wang, Y., S.L. Sun, B. Liu, H. Wang, J. Deng, Y.C. Liao, Q. Wang, F. Cheng, X.W. Wang and J. Wu (2014) A sequence-based genetic linkage map as a reference for Brassica rapa pseudochromosome assembly. BMC Genomics 12: 239.
- Xu, Q., L.L. Chen, X.A. Ruan, D.J. Chen, A.D. Zhu, C.L. Chen, D. Bertrand, W.B. Jiao, B.H. Hao, M.P. Lyon et al. (2013) The draft genome of sweet orange (Citrus sinensis). Nat. Genet. 45: 59–66.
- Yi, K., X.L. Xu, X.Y. Lu, Y. Xu, L.T. Xiao, Y.J. Wang and G. Kang (2003) Construction of molecular genetic map of watermelon by SSR and ISSR technology. J. Hunan Agric. Univ. (Nat. Sci. Ed.) 29: 333–337.
- Yonemaru, J.I., S.H. Choi, H. Sakai, T. Ando, A. Shomura, M. Yano, J.Z. Wu and S. Fukuoka (2015) Genome-wide indel markers shared by diverse Asian rice cultivars compared to Japanese rice cultivar ‘Koshihikari’. Breed. Sci. 3: 249–256.
- Zalapa, J.E., J.E. Staub, J.D. McCreight, S.M. Chung and H. Cuevas (2007) Detection of QTL for yield-related traits using recombinant inbred lines derived from exotic and elite US Western Shipping melon germplasm. Theor. Appl. Genet. 114: 1185–1201.
- Zhang, C.C., L.Y. Wang, K. Wei and H. Cheng (2013) Conversion of EST-SNP into CAPS markers in tea plant (Camellia sinensis). Mol. Plant Breed. 6: 817–824.
- Zhang, F.X., F.S. Luan and Y.Y. Sheng (2010) Analysis of genetic diversity on different ecological watermelon (Citrullus lanatus (Thunb.) Matsum. et Nakai) germplasm using SSR markers. China Veget. 14: 36–43.
- Zhang, H.Y., H. Wang, S.G. Guo, Y. Ren, G.Y. Gong, Y.Q. Weng and Y. Xu (2012) Identification and validation of a core set of microsatellite markers for genetic diversity analysis in watermelon, Citrullus lanatus Thunb. Matsum. & Nakai. Euphytica 186: 329–342.
- Zhang, J., G.Y. Gong, S.G. Guo, Y. Ren, H.Y. Zhang and Y. Xu (2014) Fine mapping of the flesh color controlling genes in watermelon (Citrullus lanatus). Cucurbitaceae 2014 Proceeding, pp. 111–116.
- Zhang, R.B., Y. Xu, K. Yi, H.Y. Zhang, L. Liu, G.Y. Gong and A. Levi (2004) A genetic linkage map for watermelon derived from recombinant inbred lines. J. Amer. Soc. Hort. Sci. 129: 237–243.