Abstract
Fusarium head blight (FHB), caused by the fungal plant pathogen Fusarium, is a fungal disease that occurs in wheat and can cause significant yield and grain quality losses. The present paper examines variation in the resistance of spring wheat lines derived from a cross between Zebra and Saar cultivars. Experiments covering 198 lines and parental cultivars were conducted in three years, in which inoculation with Fusarium culmorum was applied. Resistance levels were estimated by scoring disease symptoms on kernels. In spite of a similar reaction of parents to F. culmorum infection, significant differentiation between lines was found in all the analyzed traits. Seven molecular markers selected as linked to FHB resistance QTLs gave polymorphic products for Zebra and Saar: Xgwm566, Xgwm46, Xgwm389, Xgwm533, Xgwm156, Xwmc238, and Xgwm341. Markers Xgwm389 and Xgwm533 were associated with the rate of Fusarium-damaged kernels (FDK) as well as with kernel weight per spike and thousand kernel weight in control plants. Zebra allele of marker Xwmc238 increased kernel weight per spike and thousand kernel weight both in control and infected plants, whereas Zebra allele of marker Xgwm566 reduced the percentage of FDK and simultaneously reduced the thousand kernel weight in control and infected plants.
Introduction
Fusarium head blight (FHB) is a devastating disease that occurs in wheat and other small grain cereals worldwide. The disease results in the grain yield loss and negatively affects grain quality caused by contamination of the harvested grain with toxic fungal secondary metabolites (Bottalico and Perrone 2002, Buerstmayr et al. 2009, Chakraborty et al. 2006, Mardi et al. 2005, Marin et al. 2013). This head infection is caused by several Fusarium species, like F. culmorum (W.G. Sm.) Sacc. F. graminearum Schwabe and F. avenaceum (Fries) Saccardo (Bottalico and Perrone 2002, Parry et al. 1995, Stępień et al. 2008, Wiśniewska et al. 2014). Wheat genotypes vary in the response to FHB. Unfortunately, high yielding wheat cultivars which are the best adapted to the prevailing environmental conditions very often demonstrates susceptibility to FHB. Breeding cultivars resistant to FHB are essential for disease control and the prevention of mycotoxin contamination (Edwards 2004, Pirgozliev et al. 2003, Yuen and Schoneweis 2007). However, selection of wheat genotypes with improved resistance to FHB during the breeding process is difficult, because the resistance to FHB is a quantitative trait modulated by genetic factors in the host plant and pathogen, and by environmental conditions—particularly effects of temperature and rainfall from flowering to the soft-dough-stage of kernel development are important (Chełkowski et al. 2000, Cowger et al. 2009, Mesterházy 1995, Mesterházy et al. 2002, Miedaner 1997, Snijders 2004). This leads to significant genotype-environment (GE) interaction (Buerstmayr et al. 2009, Miedaner et al. 2001, Warzecha et al. 2011). Because of this GE interaction, multiple independent phenotyping experiments are needed to estimate the level of resistance and for this reason screening wheat breeding materials for resistance to FHB is time-consuming and costly (Hollins et al. 2003).
Schroeder and Christensen (1963) suggested two components of resistance to FHB: resistance to initial infection (type I) and resistance to infection spread within the host (type II). Further types (or components) of resistance to FHB such as resistance to kernel infection (type III) and resistance to toxin accumulation (type V) were proposed by Mesterházy (1995), Mesterházy et al. (1999). Moreover, the reduction of yield and/or yield-related traits after artificial inoculation have been accepted as the measures of resistance (type IV) (e.g., Buerstmayr et al. 2009, Chełkowski et al. 2000, Warzecha et al. 2010). In mapping studies involving the identification of QTLs for FHB resistance, type II has commonly been used as the measure of resistance, as it is easier to assess than other types (Buerstmayr et al. 2002, 2003).
Several studies reported that the response to pathogenic infection may be influenced by the morphological and developmental characteristics of the host plant, such as plant height (Draeger et al. 2007, Mesterházy 1995, Paillard et al. 2004), heading date (Klahr et al. 2007, Miedaner et al. 2006), spike awness (Chrpova et al. 2011, Mesterházy 1995, Snijders 1990, Tamburic-Ilincic et al. 2007), spike compactness (Schmolke et al. 2005) and anther extrusion (Kubo et al. 2013, Skinnes et al. 2010). These two groups of traits can be controlled by different closely linked genes/QTLs, or the pleiotropic effect of a gene/QTL for both groups of traits may occur. Regardless of the genetic basis of observed dependencies, morphological characteristics may be helpful for breeders in the selection of breeding materials.
The majority of wheat varieties cultivated in central Europe is moderately resistant to FHB (Kosová et al. 2009). Varieties with improved resistance can be achieved by conventional selection of breeding lines tested in induced or natural epidemic conditions. However, such selection is difficult and cost intensive. Molecular markers could be a good tool for augmenting conventional selection. In wheat populations examined so far, several loci connected with resistance to FHB have been localized. For example, Bernadro et al. (2012), Buerstmayr et al. (2002, 2003), Häberle et al. (2007), Mardi et al. (2006), Somers et al. (2003) and Yang et al. (2005) identified QTLs for different types of FHB resistance on chromosomes 3A, 5A, 7A, 1B, 3B, 4B and 7B. However, in spite of numerous studies on the inheritance in wheat of resistance to FHB, only a few markers seem to be promising (for a review, see Buerstmayr et al. 2009). A major FHB resistance QTL, Qfhs.ndsu-3BS, has been identified in spring wheat cultivar Sumai 3, and SSR markers Xgwm389 and Xgwm533 were found to be close to this QTL. It is worth emphasizing that Xgwm533 is defined as a diagnostic marker for Fhb1 (Zhang et al. 2012). Somers et al. (2003) identified FHB QTLs in Chinese wheat line Wuhan-1 on 3BS and 4BS that were close to SSR markers Xgwm566 and Xgwm238, respectively. SSR marker Xgwm156 localized on chromosome 5A was reported by Szabó-Hevér et al. (2014) as linked to Frontana-derived resistance QTL. Niwa et al. (2014) found two other markers on 5AS, Xgwm304 and Xgwm 293, which were associated with resistance to FHB. Jia et al. (2005) reported that markers Xgwm46(7B) and Xgwm341(3D) showed significant associations with FHB resistance. Klahr et al. (2007) also identified QTL for FHB severity in winter wheat genotypes which was situated near to the marker Xgwm46. In turn marker Xgwm149 localized on 4B close to Qfhi.nau-4B (named Fhb4) has been used to FHB resistance analysis (Xue et al. 2010). Noteworthy, the most of SSR markers related to FHB resistance appeared to be associated with other characteristics, such as, plant height, spike length, protein content, grain weight and heading date (Häberle et al. 2007, Kuchel et al. 2006, McCartney et al. 2003, 2007, Patil et al. 2009, Susuki et al. 2012).
As mentioned above, resistance to FHB, similar to yield-forming traits, is quantitatively inherited. It was assumed in this study, that genes with minor effects conditioning this trait, may be dispersed along the parental genomes. It was showed by Mather and Jinks (1982) and Jinks and Pooni (1976) that dispersion of genes conditioning a given quantitative trait in parental genomes results in similar mean values of that trait in parents. In the progenies of such parents association of genes in homozygous lines may be expected as a result of recombination. Lines in which desirable alleles are associated show the effect of transgression (e.g., increased resistance to FHB) (Kuczyńska et al. 2007a, 2007b). The objective of the present study was to assess the variability of spring wheat lines derived from a cross between two cultivars moderately susceptible to FHB, which do not carry the major genes for FHB resistance, in respect of resistance to FHB (type III) and two yield-related traits, kernel weight per spike (KWS) and thousand kernel weight (TKW). In addition, the aim was to determine whether based on phenotype evaluation and analysis of molecular markers linked to QTLs for FHB resistance it is possible to select within such population lines of a low susceptibility to FHB and simultaneously having improved yield-related parameters compared to both parental cultivars.
Materials and Methods
Plant material
A population of 198 F2-derived recombinant inbred lines (RIL) of spring wheat was developed from a cross between the cultivars Zebra and Saar (Z/S). Zebra is a Swedish elite bread cultivar (registered in Poland), with awnless spikes. Saar is a breeding line from CIMMYT (Mexico), with awned spikes, with partial resistance to powdery mildew and leaf rust (Lillemo and Skinnes 2006, Lillemo et al. 2008, 2013), so their genetic backgrounds may be expected to be different. In other field experiments, both cultivars have proved to be moderately susceptible to FHB (data not shown). No resistance sources carrying known resistance QTLs/genes of large effect were present in either cultivar pedigree; Zebra was developed from Ralle/Dragon and Saar from Sonoita-F-81/Trap-1//Baviacora-M-92 cross combinations.
Recombinant inbred lines were developed by using single seed descent (SSD) technique (Goulden 1939) associated with in vitro culture of embryos. F1 plants were selfed to produce F2 generation. In F2 and in each next generation, immature seeds were collected about 14–16 days after flowering, the embryos were dissected and then cultured in vitro on B5 medium (Gamborg et al. 1968). SSD lines were developed starting from 400 F2 individuals. SSD technique was applied until F6 generation, in which all seeds from individual F6 plants were collected and then multiplicated during two years (F7 and F8 generations) under field conditions.
Field experiments
Recombinant inbred lines (F9), along with their parental cultivars, were evaluated for resistance to Fusarium head blight (FHB) in field experiments conducted in 2010–2012 at Cerekwica (Western Poland, 52°53′N 16°67′E). Experiments were established on a luvisol type of soil and each year fertilizer was added according to soil-test recommendations for cultivation of spring wheat. In each year, the experiment was carried out in a completely randomized design with three replications. Plants were grown on 1-m2 plots with the distance of 0.5 m between plots. Each plot consisted of six 1-m rows with 20 cm space between rows. Sowing density was 300 seeds per 1 m2. Control plots were established at the same manner on experimental fields located at a distance of 2.5 m from plots designed for inoculation. Before sowing, the seeds were treated with ‘Sumin’ (Organika-Azot, Jaworzno, Poland) at a rate of 3 g kg−1 to control seed-borne diseases. In each year seeds were sown in the first half of April. For weed control Granstar® Ultra SX®50 SG (DuPont, Warsaw, Poland) was used in a dose of 40 g ha−1 in 300:l of water at the tillering stage.
The mean values for temperature and precipitation in May–July in the years 2010–2012 are presented in Supplemental Table 1.
FHB test
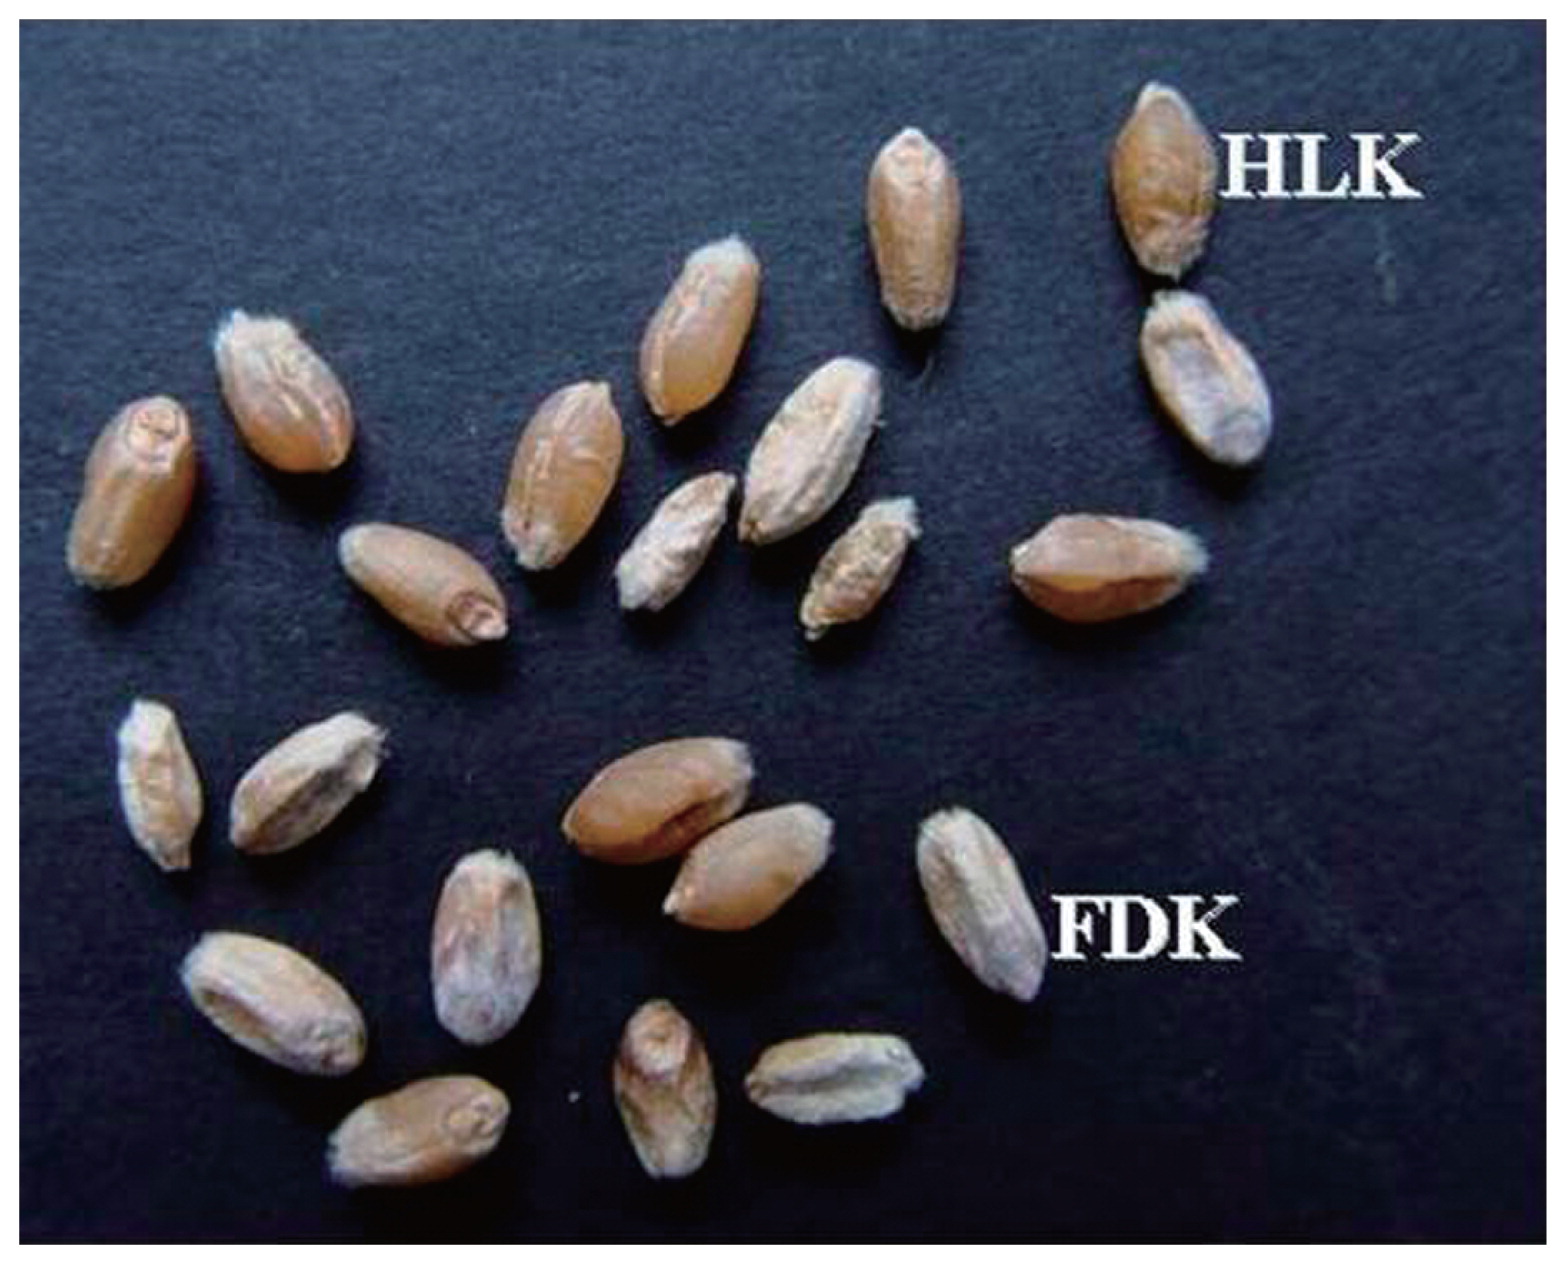
Wheat heads were inoculated with a mixture of a conidial suspension of Fusarium culmorum (W.G.Sm.) Sacc. isolates originating from the collection of the Institute of Plant Genetics (Poznań, Poland): KF846 and KF350 (IPO348-01). Isolates were incubated with autoclaved wheat grain in glass flasks for about 1 week in darkness at 18°C and next exposed to UVA light (“black light” 350 nm) under 16 h of photoperiod at 15°C for about 3 weeks. Flasks were shaken thoroughly at 24-hour intervals to loosen kernels colonized with mycelium. Grain with visible sporulation on the kernel surface was air dried and stored in refrigerator at 4°C until usage. At the date of inoculation grain with Fusarium mycelium was suspended in distilled water for 1 h and filtered through two layers of cheesecloth to obtain conidial suspension. Conidia concentration was adjusted to 5 × 10⁴ ml−1 with a chemocytometer. Inoculations were performed individually on each plot at the beginning of anthesis (Z61), and repeated about 3 days later at full anthesis (Z65). The date of inoculation in particular years was as follows: June 22–28 in 2010, June 13–21 in 2011, and June 11–18 in 2012. After inoculation micro-irrigation during 2 days was used. For each genotype control plots in three replications were established. At harvest, 20 randomly selected heads were collected from each inoculated and control plot and threshed manually. In the harvested samples, kernels were visually scored and divided into two categories: healthy-looking and Fusarium-damaged kernels (FDK) (Fig. 1). Kernel samples were adjusted to 13% moisture. FHB severity was estimated as the percentage of damaged kernels in terms of kernel weight and in terms of the number of kernels, constituting traits FDK1 and FDK2, respectively. Furthermore, the KWS of infected (KWS_I) and control (KWS_C) plants was recorded and 1000-kernel weight was calculated for FDK (TKW_I) and control (TKW_C) kernel samples and then reduction (in %) of KWS and TKW was estimated as KWS_R = (KWS_I/KWS_C) × 100 and TKW_R = (TKW_I/TKW_C) × 100.
Microsatellite markers, as known as simple sequence repeat (SSR) markers, which had been reported to be close to the QTL regions responsible for FHB resistance were used for genotyping of the studied population: Xgwm389 (Buerstmayr et al. 2003), Xgwm533 (Buerstmayr et al. 2003, Yang et al. 2005), Xgwm304 (Buerstmayr et al. 2003), Xgwm156 (Gosman et al. 2007), Xgwm149 (McCartney et al. 2007), Xgwm566 (McCartney et al. 2007, Somers et al. 2003), Xgwm341 (Jia et al. 2005), Xgwm46 (Häberle et al. 2007) and Xwmc238 (Somers et al. 2003). Characteristic of the SSR markers used is presented in Supplemental Table 2.
Genomic DNA was extracted from leaves of 14-day-old seedlings using a Wizard® Genomic DNA Purification kit (Promega). The extracts were diluted to 50 ng μl−1 and stored at −20°C. Microsatellite primer sequences for Xgwm and Xwmc markers were obtained from Röder et al. (1998), Somers et al. (2004) and the GrainGenes database (http://www.wheat.pw.usda.gov). PCR reactions were performed in 25 μl volumes containing 250 nM of each primer, 0.2 mM of each of dNTP, 1× PCR buffer, 1.5 mM of MgCl2, 1.0 unit of Taq DNA polymerase, and 50 ng of genomic DNA. The samples, denatured at 94°C, were submitted to 45 cycles of 1 min denaturation at 94°C, 1 min annealing at 55°–60°C (depending on the Tm of primers), and 2 min elongation at 72°C, with a final extension of 10 min at 72°C. For PCR amplifications, a Gene AMP PCR system 9700 thermal cycler (Applied Biosystems) was used. Microsatellite alleles were detected on an Applied Biosystems 3130 Genetic Analyzer.
Statistical methods
The data for FDK1 and FDK2 were processed by two-way analysis of variance, in which the years and genotypes (i.e., lines) were the sources of variation (fixed effects). For KWS and TKW observed on infected and control plots, genotypes, years and treatment were taken as the sources of variation. Broad sense heritability coefficients were computed for FDK1, FDK2, KWS and TKW (for the last two traits separately for the two levels of treatment) using the formula h2 = σG2/[σG2 + (1/3)σGE2 + (1/9)σe2], where σG2, σGE2, σe2 denote variance components for lines, line × environment interaction, and error, respectively, estimated by the restricted maximum likelihood (REML) method.
The significance of the relationships between phenotypic traits and SSR markers was assessed using the F-test in analysis of variance; in this analysis, observations of heterozygotes were treated as missing values (the fraction of heterozygotes for markers varied from 0 to 8%). Additive marker effects were calculated as half of the difference between the mean values for marker classes (Zebra–Saar). The differences between awned and awnless groups of lines regarding the examined kernel traits were estimated and tested with F statistic. All computations were performed in Genstat 16 (VSN Int. 2013).
Results
Large differences in FHB severity were observed between the years both for parental cultivars and RILs (Table 1). Parental cultivars differed slightly in their response to infection with F. culmorum: the mean (over the years) percentage of damaged kernels after inoculation was higher in Saar than in Zebra samples, but the difference was significant only for FDK1 (Fig. 2, Table 1). Infection with F. culmorum resulted in a reduction of KWS and TKW. The mean reduction of KWS in infected plants was 65.48% in Zebra and 58.54% in Saar, whereas the mean reduction of TKW was 59.92% and 68.97% in Zebra and Saar, respectively (Figs. 3, 4, Table 1).
Table 1
Mean values of traits in population of spring wheat Zebra/Saar recombinant inbred lines and mean values (with std. error) for parental cultivars, in control plants (C) and inoculated (I) with
F. culmorum
| Trait |
Zebra |
Saar |
RIL |
| mean (s.e.) |
mean (s.e.) |
mean (s.e.) |
min |
max |
CVa (%) |
| 2010 |
| FDK1 (%) |
4.13 (1.75) |
7.96 (5.27) |
11.11 (0.50) |
0.36 |
34.83 |
63.05 |
| FDK2 (%) |
4.73 (1.91) |
10.13 (6.06) |
14.89 (0.58) |
0.81 |
45.20 |
54.90 |
| KWS_I (g) |
0.44 (0.03) |
0.45 (0.03) |
0.51 (0.01) |
0.33 |
0.78 |
15.49 |
| KWS_C (g) |
0.67 (0.02) |
0.60 (0.04) |
0.84 (0.01) |
0.52 |
1.39 |
19.01 |
| TKW_I (g) |
28.73 (2.75) |
30.19 (4.18) |
24.98 (0.36) |
12.36 |
43.15 |
20.28 |
| TKW_C (g) |
36.08 (1.09) |
39.24 (0.65) |
38.76 (0.28) |
29.25 |
49.40 |
10.15 |
| KWS_R (%) |
65.97 |
75.75 |
62.57 (0.79) |
38.51 |
84.82 |
17.75 |
| TKW_R (%) |
79.63 |
76.94 |
64.39 (0.76) |
35.00 |
97.86 |
16.62 |
| 2011 |
| FDK1 (%) |
31.28 (3.86) |
47.82 (6.72) |
50.77 (0.91) |
16.87 |
79.89 |
25.32 |
| FDK2 (%) |
41.22 (4.83) |
50.94 (6.82) |
59.98 (0.94) |
22.38 |
86.19 |
22.00 |
| KWS_I (g) |
0.44 (0.03) |
0.45 (0.02) |
0.35 (0.01) |
0.15 |
0.61 |
24.90 |
| KWS_C (g) |
0.60 (0.03) |
0.65 (0.04) |
0.74 (0.01) |
0.52 |
1.14 |
15.34 |
| TKW_I (g) |
18.25 (1.44) |
29.10 (1.93) |
19.98 (0.24) |
12.69 |
32.78 |
17.10 |
| TKW_C (g) |
28.40 (0.75) |
33.99 (1.66) |
33.03 (0.23) |
25.53 |
43.98 |
9.62 |
| KWS_R (%) |
72.69 |
69.90 |
47.95 (0.87) |
21.22 |
88.07 |
25.62 |
| TKW_R (%) |
64.28 |
85.63 |
60.46 (0.59) |
42.41 |
83.73 |
13.78 |
| 2012 |
| FDK1 (%) |
26.79 (4.67) |
43.40 (5.07) |
34.50 (0.88) |
12.81 |
69.56 |
35.90 |
| FDK2 (%) |
48.31 (6.28) |
62.61 (5.66) |
51.39 (0.98) |
23.11 |
86.02 |
26.88 |
| KWS_I (g) |
0.38 (0.03) |
0.24 (0.02) |
0.38 (0.01) |
0.17 |
0.74 |
31.28 |
| KWS_C (g) |
0.66 (0.03) |
0.79 (0.02) |
0.76 (0.01) |
0.49 |
1.10 |
14.59 |
| TKW_I (g) |
10.19 (0.11) |
12.29 (0.59) |
13.96 (0.17) |
8.36 |
20.89 |
16.76 |
| TKW_C (g) |
28.41 (0.94) |
27.73 (0.35) |
32.42 (0.20) |
26.08 |
41.00 |
8.71 |
| KWS_R (%) |
57.79 |
29.96 |
50.53 (0.99) |
22.14 |
88.47 |
27.57 |
| TKW_R (%) |
35.87 |
44.32 |
43.13 (0.52) |
26.39 |
63.08 |
15.71 |
| Average value over years |
| FDK1 (%) |
20.74 (4.58) |
33.06 (6.92) |
32.13 (0.57) |
15.49 |
54.20 |
24.99 |
| FDK2 (%) |
31.42 (7.15) |
41.23 (8.54) |
42.09 (0.62) |
21.76 |
65.93 |
20.72 |
| KWS_I (g) |
0.42 (0.02) |
0.38 (0.04) |
0.42 (0.004) |
0.28 |
0.59 |
15.08 |
| KWS_C (g) |
0.64 (0.02) |
0.68 (0.03) |
0.78 (0.01) |
0.59 |
1.20 |
12.73 |
| TKW_I (g) |
19.06 (2.83) |
23.86 (3.19) |
19.64 (0.20) |
12.61 |
29.27 |
14.09 |
| TKW_C (g) |
30.96 (1.36) |
33.65 (1.74) |
34.74 (0.20) |
27.41 |
43.92 |
8.05 |
| KWS_R (%) |
65.48 (4.31) |
58.54 (14.39) |
53.68 (0.57) |
21.22 |
88.47 |
26.09 |
| TKW_R (%) |
59.92 (12.82) |
68.97 (12.58) |
55.99 (0.52) |
26.39 |
97.86 |
22.72 |
a CV—coefficient of variation computed for RIL population.
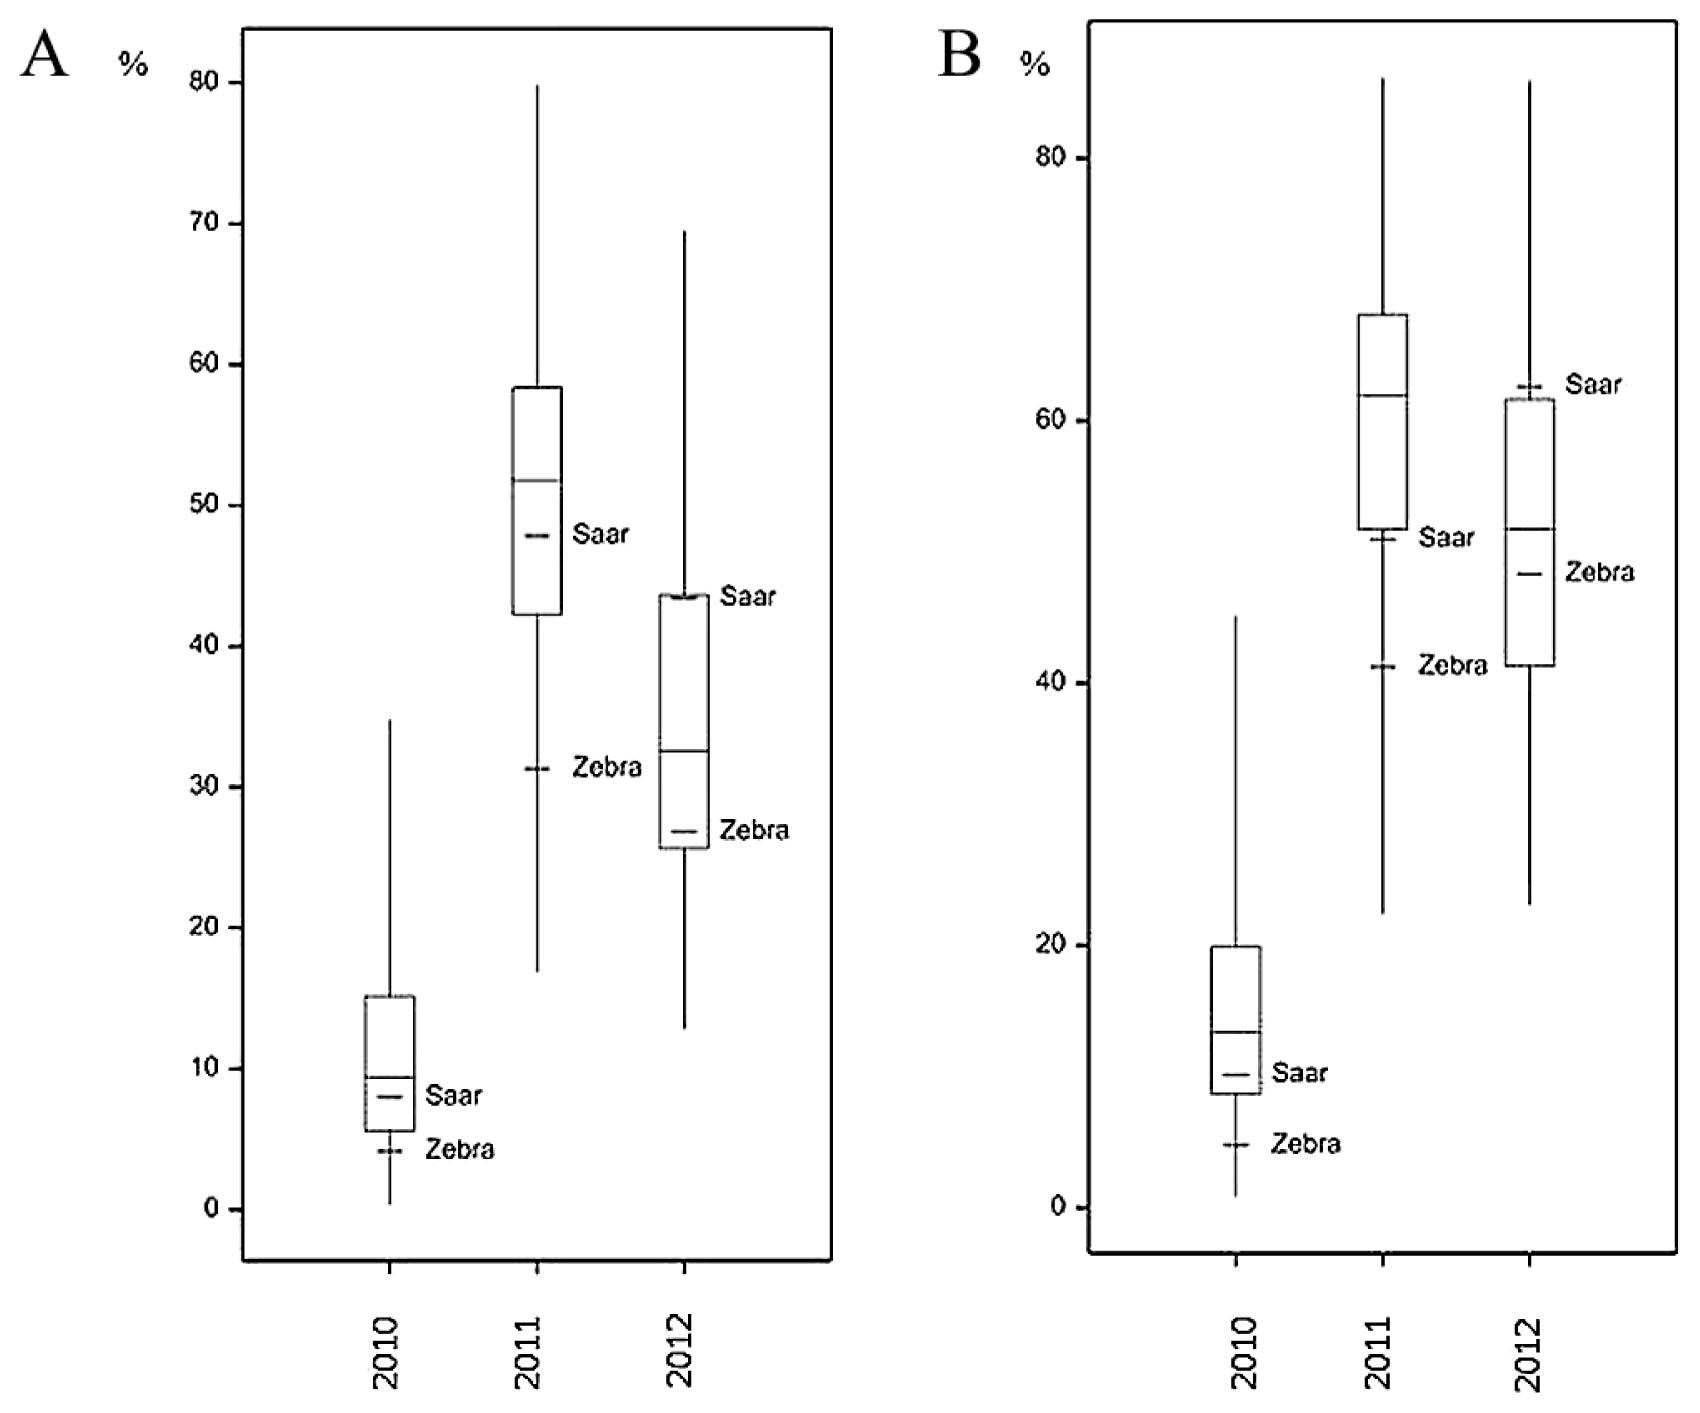
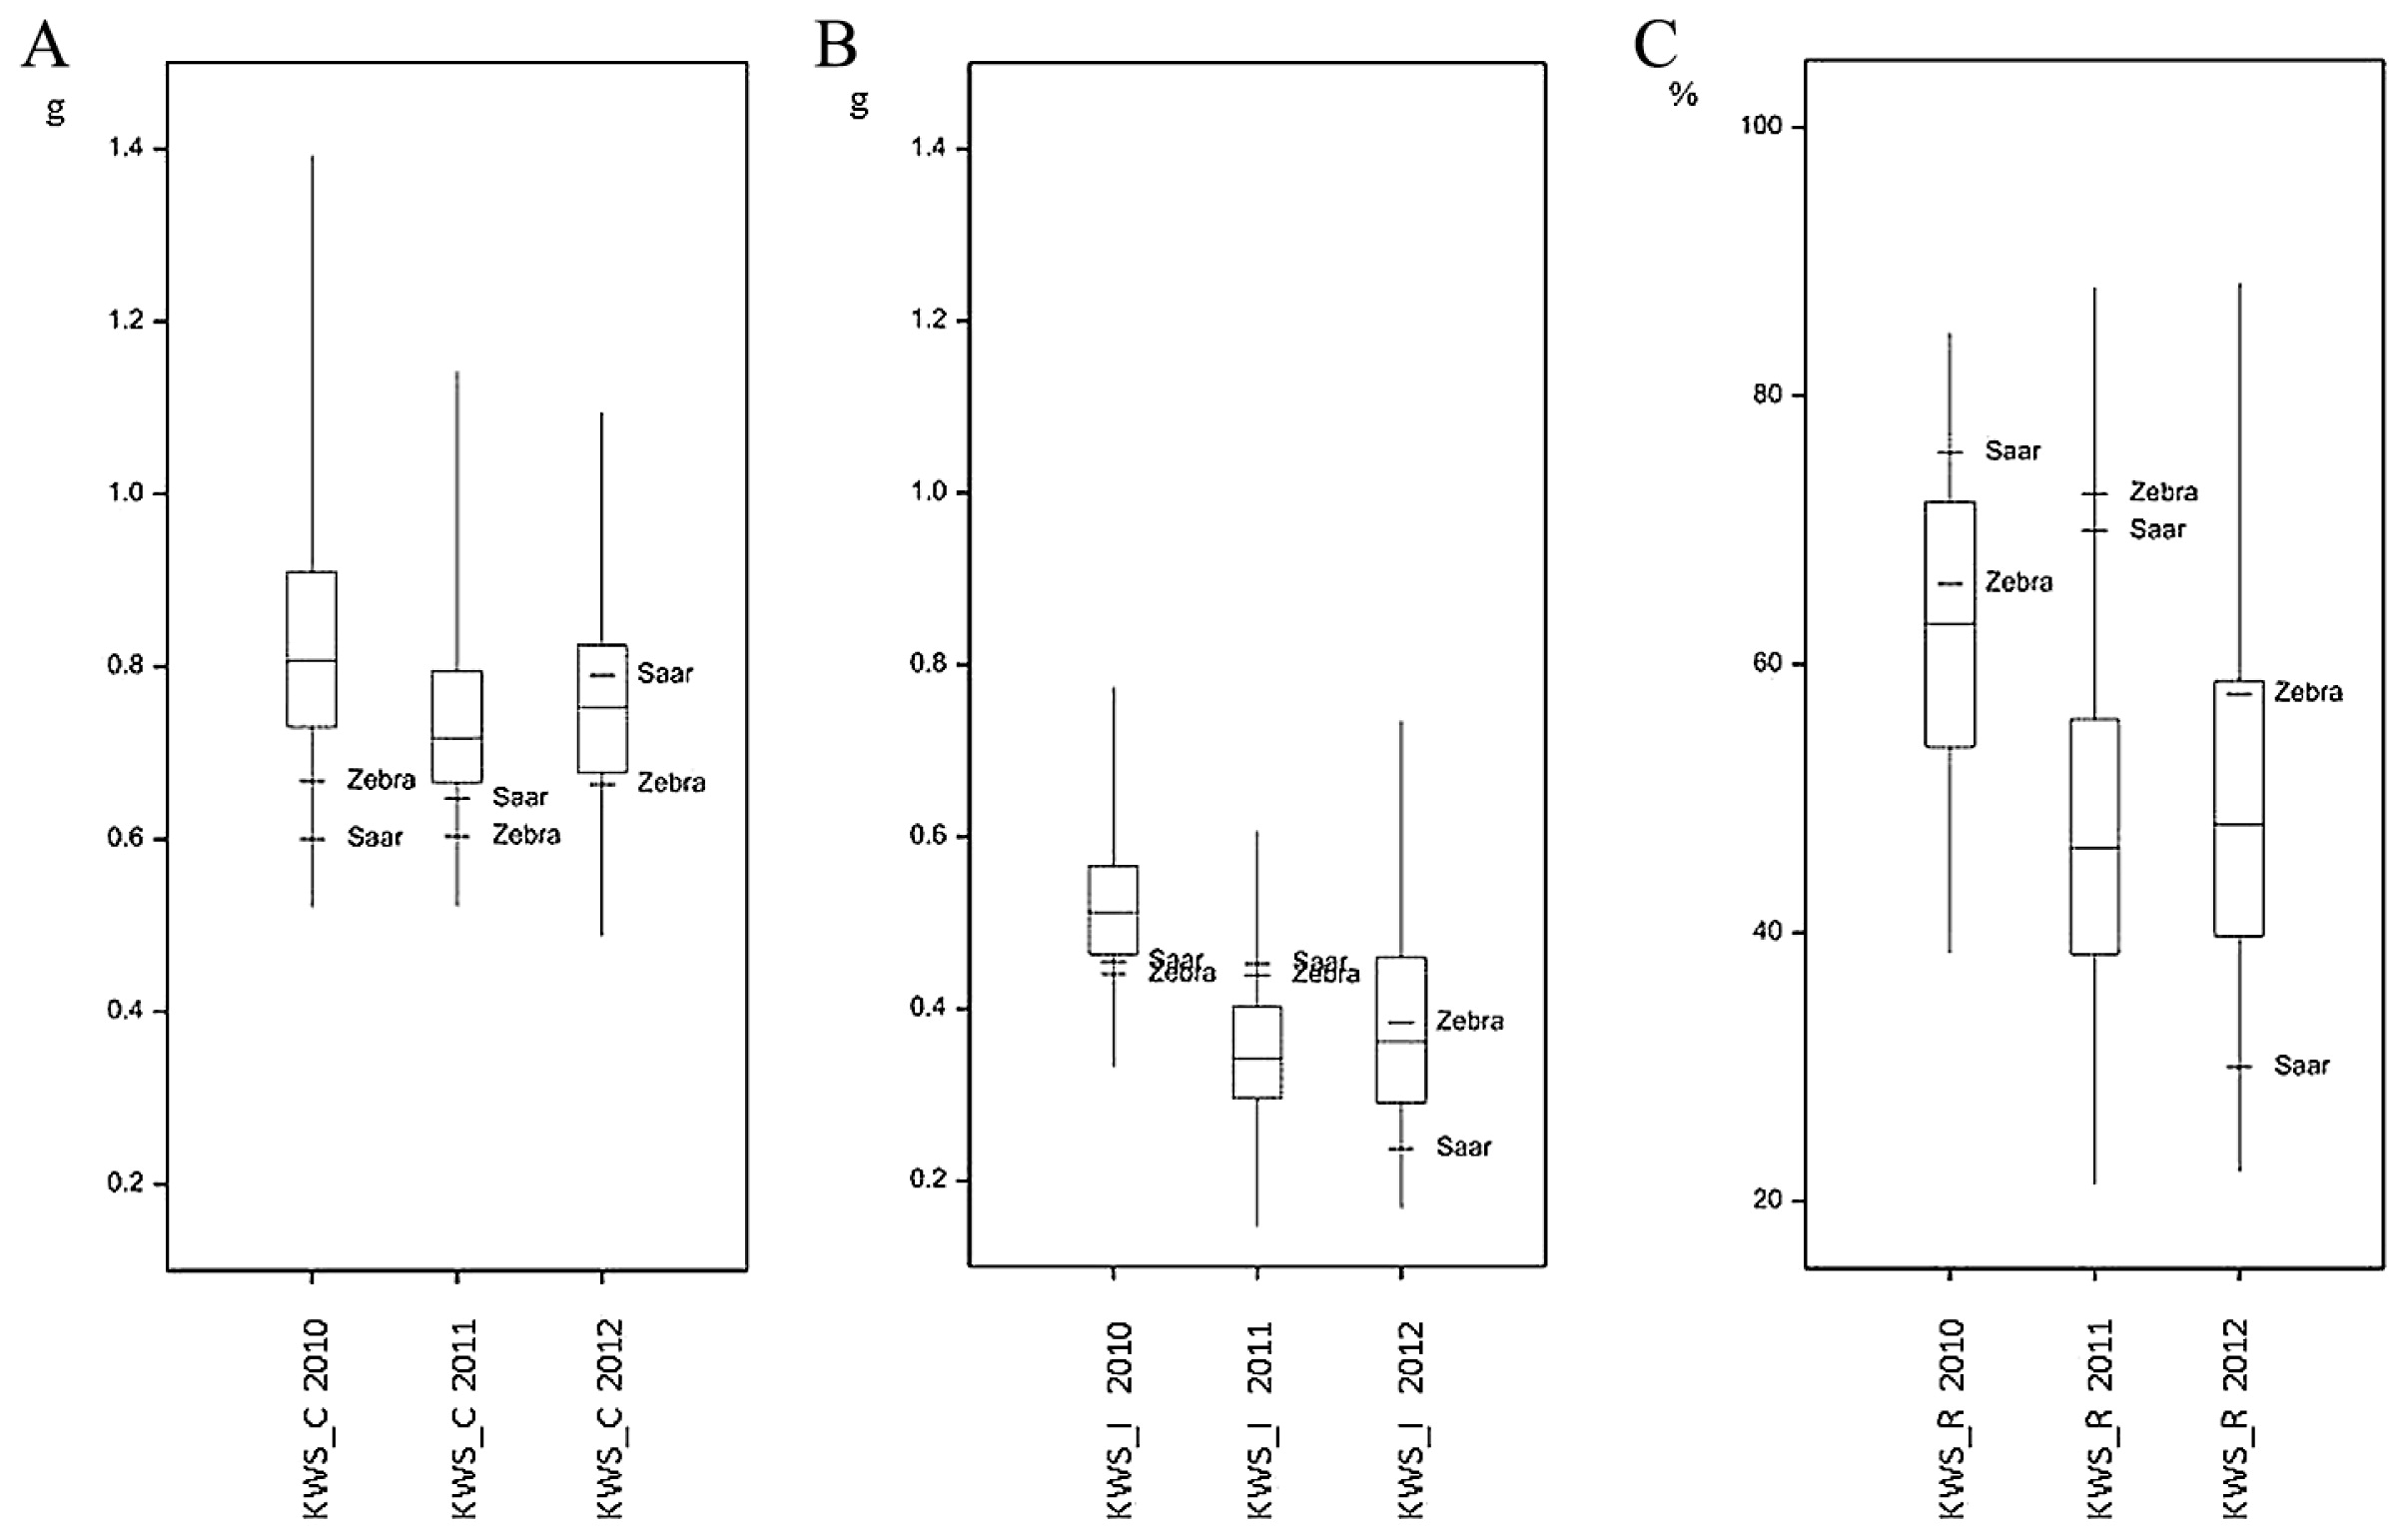
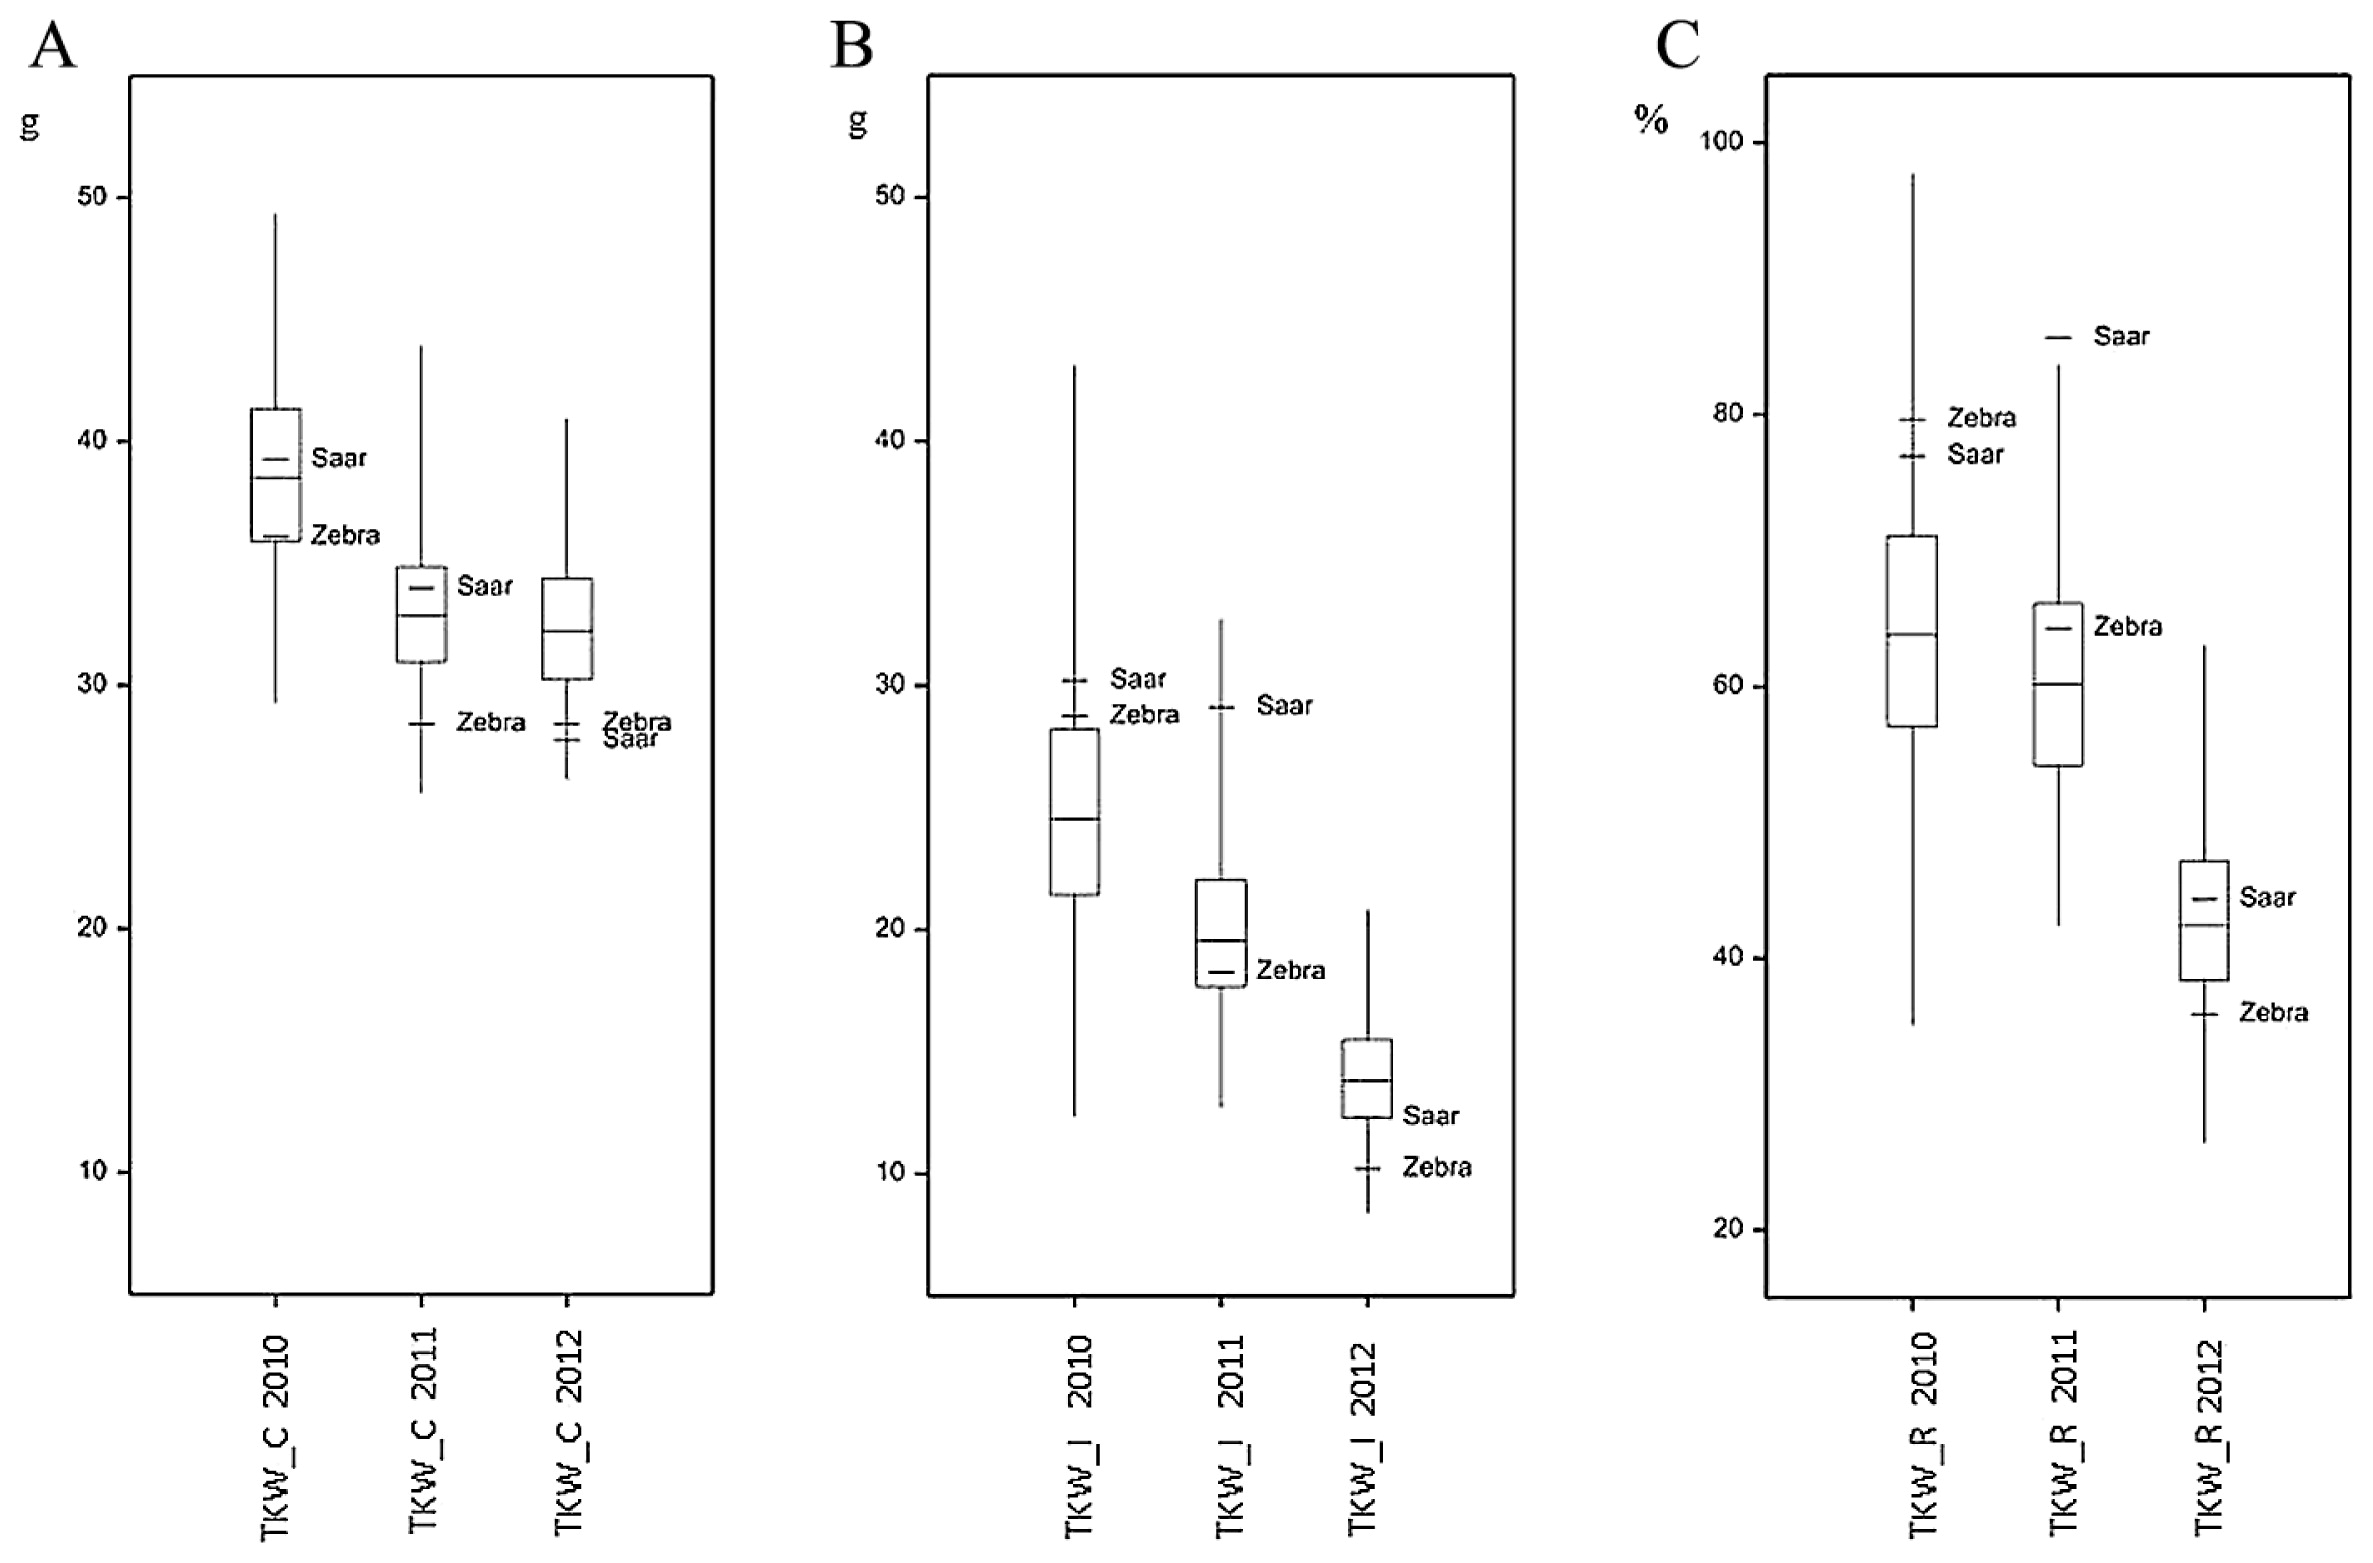
The mean values of the analyzed traits in individual years differed over a wide range; for example, the mean percentage for FDK1 in RIL samples in 2010 was 11.11%, but in the next year it was 50.77%. In each year, a large differentiation among the lines within population was observed, and this was reflected in a large difference between extreme lines and in the coefficients of variation (Table 1, Figs. 2–4). In 2010, low disease severity was observed in general, but the coefficients of variation (CV) for FDK1 and FDK2 were high (63.05% and 54.90%, respectively), whereas in the next two years the average infestation of lines was markedly higher and the coefficient of variation was between 22.00 and 35.90%. Among the studied traits the lowest variation in successive years was recorded for TKW and KWS in the control, for which CV ranged between 8.71–10.15% and 14.59–19.01%, respectively, while the variation of these traits in inoculated lines increased to 16.76–20.28% for TKW_I and 15.49–31.28% for KWS_I (Supplemental Table 3).
Lines derived from the Zebra/Saar cross varied significantly in terms of all the observed traits (Table 1). Results of analyses of variance for FDK1 and FDK2 showed significant (P < 0.001) variation between genotypes and years as well as significant genotype-environment (GE) interaction (Table 2). For KWS and TKW, three-way analysis of variance revealed the significant (P < 0.001) influence of genotypes, years, treatment (inoculation and control) as well as all types of interactions of variation of these traits. Variation in the reduction of KWS and TKW was influenced significantly by genotypes and environments (Table 2). Coefficients of broad sense heritability for observed traits in inoculated RILs were a relatively high and amounted from 54.87% for FDK to 78.45% for TKW (Table 3); heritability for the reduction of traits was not computed due to inability of inclusion of the GE interaction.
Table 2
Results of analysis of variance for kernel traits of spring wheat Zebra/Saar population inoculated with
F. culmorum
| Source of variation |
DF |
Mean square |
| FDK1 |
FDK2 |
KWS |
TKW |
KWS_R |
TKW_R |
| Genotypes (G) |
197 |
579.9*** |
684.7*** |
0.0769*** |
114.8*** |
240.7*** |
102.44*** |
| Environments (E) |
2 |
236107.1*** |
340459.0*** |
5.7498*** |
22782.9*** |
12051.4*** |
25339.34*** |
| Treatment (T) |
1 |
|
|
117.7*** |
203138.4*** |
– |
– |
| Interaction GE |
394 |
261.7*** |
305.5*** |
0.0411*** |
29.4*** |
– |
– |
| Interaction ET |
2 |
|
|
0.3555*** |
2562.5*** |
– |
– |
| Interaction GT |
197 |
|
|
0.0470*** |
24.5*** |
– |
– |
| Interaction GET |
394 |
|
|
0.0153*** |
15.5*** |
– |
– |
| Error |
2376 |
123.1 |
142.5 |
0.0098 |
11.72 |
113.8 |
63.68 |
Table 3
Coefficients of broad sense heritability (%) for observed traits in Zebra/Saar RIL population
| Treatment |
FDK1 |
FDK2 |
KWS |
TKW |
| Control |
– |
– |
30.12 |
56.90 |
| Inoculation |
54.87 |
55.38 |
64.23 |
78.45 |
The lines of the studied population differed in terms of awness (Supplemental Table 4). Some differences in the observed traits were recorded between these two groups of lines. (Supplemental Table 3). The percentage of Fusarium-damaged kernels in samples of awned genotypes was generally lower than that of awnless ones, but these differences were only significant (P < 0.05) in 2011. TKW was significantly higher in the awned group of lines in each year, both in control and inoculated plants, whereas KWSwas markedly higher in awned lines in the control in 2010–2012, while in infected plants only in 2011 (Supplemental Table 3).
Molecular marker analysis
Out of the nine markers used, seven gave polymorphic alleles for Zebra and Saar: Xgwm566 – 123 and 133 bp, Xgwm46 – 167 and 143 bp, Xgwm389 – null and 115 bp, Xgwm533 – 137 and 113 bp, Xgwm156 – null and 287, Xwmc238 – 231 and 233, and Xgwm341 – 126 and 124 bp, respectively. Additive effects of markers for observed traits were estimated in each environment separately, because of the highly significant GE and GET interactions (Table 2). A significant (at P < 0.01 except two cases at P < 0.05) main effect of the marker on the rate of Fusarium-damaged kernels was found for Xgwm566, Xgwm46, Xgwm389 and Xgwm533, and for all these markers no significant interaction with the year was found, either for FDK1 or for FDK2 (Table 4). Such interaction for these traits was only revealed for the marker Xwmc238, and this was because the additive effect of the marker being positive, although not significantly, in 2010 and 2011, and then significantly negative in 2012 (Table 4, Supplemental Table 5).
Table 4
Marker additive effects for observed traits in control and infected plants of wheat Zebra/Saar RIL population
| Marker |
Year |
Marker additive effect |
| FDK1 |
FDK2 |
KWS |
TKW |
KWS_R |
TKW_R |
| T |
T |
C |
T |
C |
T |
| 1 |
Xgwm566 |
2010 |
−0.66 |
−0.49 |
−0.019 |
0.00 |
−0.72 |
−0.81 |
1.532 |
−0.790 |
|
|
2011 |
−2.14 |
−1.72 |
−0.004 |
0.01 |
−0.12 |
−0.33 |
1.828 |
−0.670 |
|
|
2012 |
−1.37 |
−0.59 |
−0.014 |
0.02 |
−0.57 |
−0.54 |
2.653 |
−0.879 |
|
|
LSD0.05/2 |
1.30 |
1.40 |
0.013 |
0.41 |
0.985 |
0.690 |
| 2 |
Xgwm46 |
2010 |
0.68 |
0.33 |
0.033 |
0.01 |
1.23 |
1.57 |
−1.015 |
1.917 |
|
|
2011 |
1.67 |
1.28 |
0.006 |
0.00 |
0.58 |
0.41 |
−0.688 |
0.190 |
|
|
2012 |
1.30 |
1.33 |
0.001 |
−0.02 |
0.73 |
0.04 |
−2.578 |
−0.879 |
|
|
LSD0.05/2 |
1.31 |
1.42 |
0.013 |
0.48 |
0.985 |
0.627 |
| 3 |
Xgwm389 |
2010 |
−0.57 |
−0.53 |
−0.003 |
0.00 |
0.53 |
0.33 |
0.468 |
−0.149 |
|
|
2011 |
−2.07 |
−2.06 |
0.024 |
0.02 |
0.89 |
0.72 |
1.131 |
0.453 |
|
|
2012 |
−2.34 |
−1.45 |
0.013 |
0.01 |
0.48 |
−0.19 |
0.840 |
−1.181 |
|
|
LSD0.05/2 |
1.22 |
1.32 |
0.012 |
0.39 |
0.925 |
0.660 |
| 4 |
Xgwm533 |
2010 |
−0.39 |
−0.64 |
0.011 |
0.01 |
0.90 |
1.16 |
−0.074 |
1.448 |
|
|
2011 |
−2.09 |
−1.96 |
0.038 |
0.02 |
1.25 |
0.99 |
0.471 |
0.678 |
|
|
2012 |
−1.43 |
−0.69 |
0.017 |
0.00 |
0.76 |
0.04 |
−0.206 |
−0.834 |
|
|
LSD0.05/2 |
1.27 |
1.37 |
0.013 |
0.39 |
0.980 |
|
| 5 |
Xgwm156 |
2010 |
0.57 |
0.27 |
0.003 |
0.01 |
−0.08 |
0.53 |
0.783 |
1.453 |
|
|
2011 |
−0.31 |
−0.44 |
0.001 |
0.01 |
0.02 |
0.29 |
0.854 |
0.873 |
|
|
2012 |
1.52 |
1.11 |
−0.004 |
0.00 |
−0.24 |
0.29 |
−0.329 |
1.235 |
|
|
LSD0.05/2 |
1.29 |
1.37 |
0.013 |
0.41 |
0.900 |
0.665 |
| 6 |
Xwmc238 |
2010 |
0.80 |
0.43 |
0.013 |
0.01 |
0.84 |
1.64 |
0.809 |
2.622 |
|
|
2011 |
1.17 |
1.33 |
0.014 |
0.00 |
1.09 |
0.78 |
−1.142 |
0.341 |
|
|
2012 |
−2.11 |
−2.83 |
0.020 |
0.03 |
1.02 |
0.89 |
3.085 |
1.408 |
|
|
LSD0.05/2 |
1.37 |
1.43 |
0.013 |
0.42 |
1.005 |
0.705 |
| 7 |
Xgwm341 |
2010 |
−0.09 |
−0.29 |
−0.007 |
−0.01 |
−0.74 |
−0.25 |
−0.472 |
0.611 |
|
|
2011 |
0.15 |
0.52 |
−0.005 |
−0.01 |
−0.34 |
−0.25 |
−1.024 |
−0.049 |
|
|
2012 |
−0.47 |
−1.00 |
0.002 |
0.00 |
−0.32 |
0.26 |
0.665 |
1.270 |
|
|
LSD0.05/2 |
1.23 |
1.37 |
0.012 |
0.39 |
0.980 |
0.665 |
Positive value indicates Zebra allele has higher mean value than Saar allele.
ForKWS, both the main effects of the markers Xgwm389, Xgwm533 and Xwmc238 and the interaction of these markers with the year were significant (P < 0.01). This resulted from their additive effects being generally positive, but not significant in all years. The additive effects of the marker Xgwm566 were negative under control conditions and positive under treatment conditions which resulted in a significant marker × treatment interaction. For the marker Xgwm46, both marker × year and marker × treatment interactions were significant as an effect of the different signs of the effects in different year by treatment combinations.
All the markers used were significantly associated with TKW (at P < 0.01). The effects of Xgwm566, Xwmc238 and Xgwm341 did not interact with the year or treatment, whereas for Xgwm46, Xgwm389 and Xgwm533 marker × year interaction was highly significant. Marker × treatment interaction was only significant for Xgwm156.
The markers Xgwm389 and Xgwm533 were associated with the rate of Fusarium-damaged kernels in wheat samples originating from infected plots, as well as with KWS and TKW in control plants, with the Zebra alleles contributing positive effects both for FHB resistance and kernel weight. Increased KWS and TKW were found as an effect of the Zebra allele of marker Xwmc238 in both control and infected plants. In the case of the marker Xgwm566, the allele from Zebra decreased the percentage of FDK but simultaneously reduced KWS in control conditions. In infected plants the effects of the Zebra allele for KWS were definitely positive (significant in two environments), what was also reflected in its positive effect on KWS_R. Additionally, the Xgwm566 allele from Zebra reduced TKW in both control and infected plants differently and influenced (P < 0.10) on TKW_R (Table 4, Supplemental Table 5).
Selection of lines
The correlation coefficient between the mean values for lines (over years) for FDK1 and FDK2 was 0.96 (P < 0.001). The correlations between FDK1 and FDK2 on one hand, and KWS measured on treated plants on the other, were significantly negative (−0.51, −0.62, P < 0.001), indicating an obvious relationship between infection of kernels and kernel weight. The correlations between percentage of infected kernels (FDK1, FDK2) and TKW were not significant. However, line no. 82 (Z/S 13), 136 (Z/S 168) and 142 (Z/S 176), characterized by large TKW for both control and treated plants, were among the lines with less than average infection symptoms (FDK1 < 32.13%) (Fig. 5). Their marker genotypes and phenotypic values are presented in Table 5. All three selected lines were characterized by significantly higher TKW than better scoring parent, both in control and after inoculation conditions.
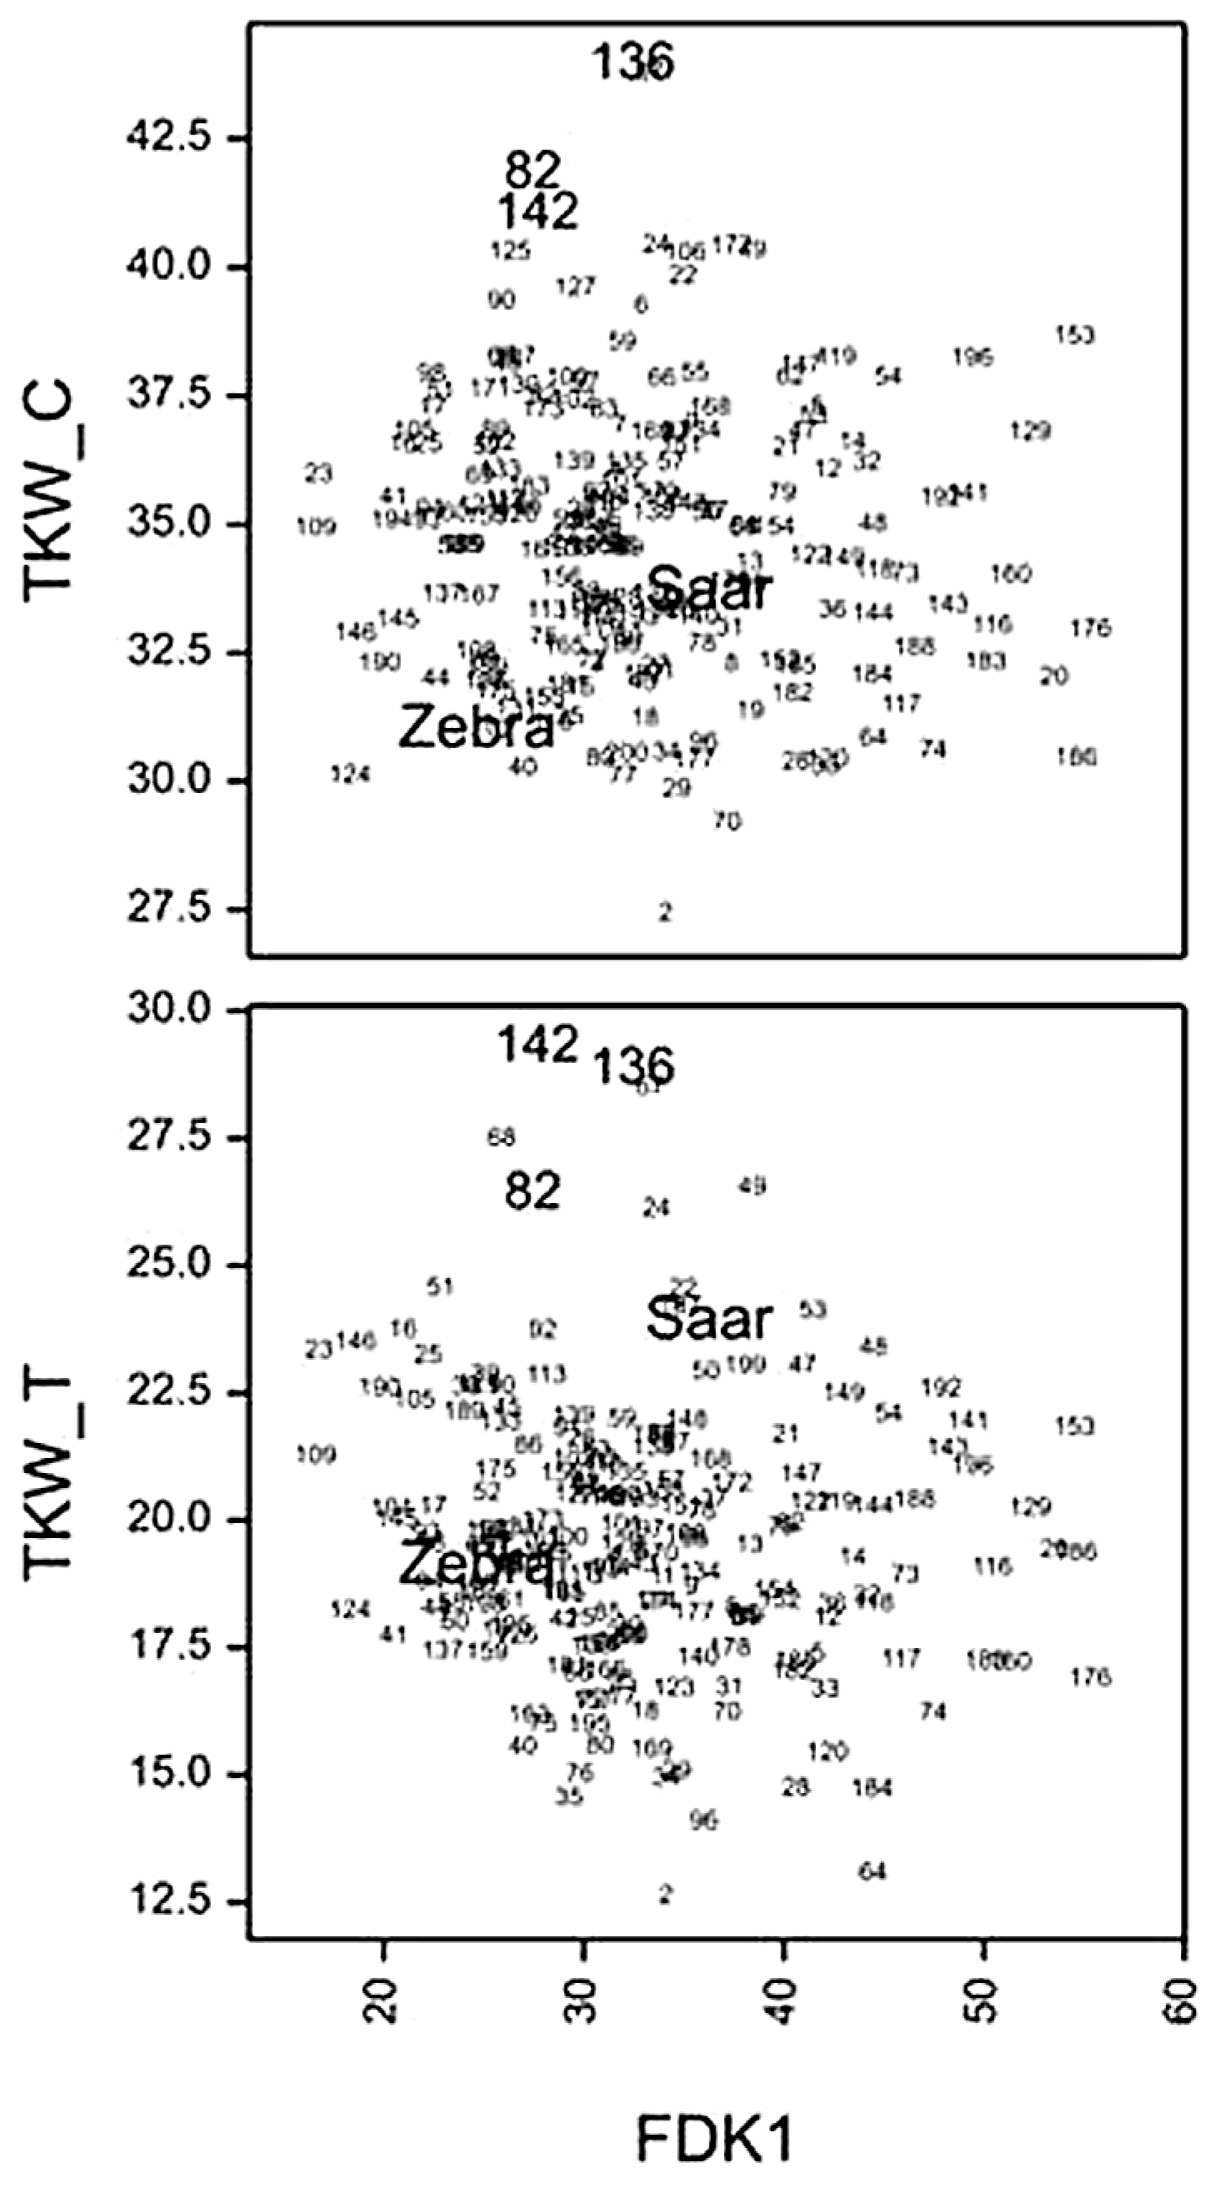
Table 5
Mean values (over years) of observed traits for Zebra/Saar lines selected as more resistant to FHB and having similar marker genotypes (S—Saar allele, Z—Zebra allele, amplification product in bp)
| Trait |
Z/S 13# |
Z/S 168# |
Z/S 176# |
Zebra |
Saar |
|
Marker genotype |
| Marker genotype |
Xgwm46:167(Z), Xgwm389:null(Z), Xgwm533:137(Z), Xgwm156:287(S), Xwmc238–:231(Z), Xgwm341:124(S) |
Xgwm46:167(Z), Xgwm389:null(Z), Xgwm533:137(Z), Xgwm156:null(Z), Xwmc238:231(Z), Xgwm341:124(S) |
Xgwm46:167(Z), Xgwm389:null(Z), Xgwm533:137(Z), Xgwm156:null(Z), Xwmc238:231(Z), Xgwm341:124(S) |
Xgwm46:167, Xgwm389:null, Xgwm533:137, Xgwm156:null, Xwmc238-231, Xgwm341:126 |
Xgwm46:143, Xgwm389:115, Xgwm533:113, Xgwm156:287, Xwmc238:233, Xgwm341:124 |
| FDK1 (%) |
26.01 |
30.24 |
25.47 |
20.74 |
33.06 |
| TKW_I (g) |
26.38* |
28.82* |
29.27* |
19.06 |
23.86 |
| TKW_C (g) |
41.80* |
43.92* |
41.01* |
30.96 |
33.65 |
* Significant (P < 0.05) differences between line and better scoring parent.
# Line no. according to
Fig. 4: no. 82—Z/S 13, no. 136—Z/S 168, no. 142—Z/S 176 ( for details see Supplemental Table 4).
Discussion
FHB evaluation
In this study, an RIL population of spring wheat derived from Zebra × Saar hybrids developed by using the single seed descent technique was evaluated in three years with respect to its response to artificial inoculation with F. culmorum. Disease symptoms were observed on kernel samples, for which the percentage of FDK fractions, expressed as the weight and number of infected kernels, was recorded. The results of statistical analyses revealed the occurrence of GE interaction and the highly significant influence of environment on the variability of the studied genotypes. This result is in agreement with numerous other studies, in which genotype-environment interaction for FHB infection has been observed in wheat and other cereals (e.g., Buerstmayr et al. 2002, Ma et al. 2006a, Miedaner et al. 2001, Warzecha et al. 2011, Yan and Hunt 2001).
High influence of environments (years) on variability the studied RILs in their reaction to infection was probably the result of strong differences between years, mainly in amount and distribution of precipitation during May–July period, especially between 2010 and other two years. Zebra/Saar lines varied in their response to infection with F. culmorum. Coefficients of variation for traits associated with the response of lines to FHB were relatively high, although parental cultivars not significantly differed: the mean percentage (across environments) of Fusarium-damaged kernels in Zebra samples was over 10–12% lower than that for Saar. Our results confirm the quantitative nature of resistance to FHB, which has been frequently reported in the literature (e.g. Anderson 2007, Bernardo et al. 2012, Buerstmayr et al. 2002, 2009, Mardi et al. 2006, Yang et al. 2004). The large variation of lines within the population observed in each environment, and relatively small differences between parents indicate the dispersion of genes controlling resistance to FHB along parental genomes, which was confirmed by molecular analyses.
Association between awness and resistance to FHB
In the literature, some morphological traits, such as plant height, earliness and awness are indicated as associated with resistance to FHB (Chrpová et al. 2011, Klahr et al. 2007, Mesterházy 1995, Miedaner et al. 2006). Out of these three traits awness is morphological trait that is not dependent on environmental conditions. In case of finding a significant relationship between awness and FHB, this feature could be a good and simple marker for selection. Plant height and earliness are the traits of quantitative nature and they are environmentally dependent, for this reason they can not be a good phenotypic markers. For that reason in our work only relationships between resistance to FHB and awness was estimated. Zebra/Saar lines segregated in terms of spike awness. A comparison of the mean values for awned and awnless groups of lines revealed that awned lines showed a tendency toward lower disease incidence (Supplemental Table 3). This was visible in the lower percentages of FDK and higher TKW in both control and infected plants. Similar observations on the predominance of awned wheat genotypes over awnless ones in their resistance to FHB were reported by Chrpová et al. (2011), Snijders (1990) and Tamburic-Ilincic et al. (2007). Slower FHB on awned genotypes can be the result of spike morphology: awns can hinder the access of spores to open spikelets. In contrast, Mesterházy (1995) reported that awned wheat cultivars were more susceptible to FHB, probably because they may accumulate more spores on the spikes and maintain humidity for a longer period, which is conducive to disease development. However, genetic determinants of the association between spike awness and resistance to FHB can not be excluded— there are reports that one of two FHB resistance genes in Sumai 3 and one of FHB-resistance QTL in Renan appeared to be linked to the B1 gene located on 5AL chromosome that determines spike awness (Ban and Suenaga 2000, Gervais et al. 2003). Results of our study confirmed only phenotypic association between resistance to FHB and spike awness because none of the markers used giving polymorphic products for Zebra and Saar was localized close to the B1 gene. The relationships between spike awness and resistance to FHB may be a result of pleiotropic or linkage effects of genes involved in controlling these features; close linkage and pleiotropy are still difficult to separate (Buerstmayr et al. 2009, Malihipour et al. 2015).
Association between SSR marker polymorphism and resistance to FHB
Out of the nine SSR markers applied in the present studies, and chosen as being linked to the QTLs associated with the resistance of wheat to FHB, two markers, Xgwm304 and Xgwm149, did not give polymorphic products for the parental cultivars Zebra and Saar. The marker Xgwm304 has been localized on chromosome 5A at a distance of 14 cM from the marker Xgwm156 (Somers et al. 2004). In the present studies, the marker Xgwm156 gave different products for Zebra and Saar, but its association with the percentage of Fusarium-damaged kernels (resistance type III) was not significant and the interaction of marker effect with treatment was only found to be important for TKW.
The markers Xgwm389 and Xgwm533 were significantly associated with all the analyzed traits and Zebra alleles decreased the percentage of FDK, increased KWS and TKW in all environments. These markers have been localized close to each other on chromosome 3BS (Bernardo et al. 2012, Ma et al. 2006b, Mardi et al. 2005), and most probably this is the reason for the similar results obtained for these markers. Yang et al. (2005) reported that the marker Xgwm533 was associated with FHB incidence and FHB spread as well as with kernel infection. This was also revealed in our experiments. Cuthbert et al. (2006) found the marker Xgwm533 at a distance of 5.88 and 6.30 cM from the major FHB (type II) resistance gene Fhb1 in two populations of wheat containing different sources of resistance: Sumai3 and Nyubai. In our studies, the marker Xgwm533 indeed gave product for Zebra of different length (137 bp) than that for Sumai3 and Nyubai (141 and139 bp), but this marker appeared to be significantly associated with the resistance to type III FHB.
It may be noted that the markers Xgwm566, Xgwm46, Xgwm389 and Xgwm533, for which significant effects for the rate of infected kernels after inoculation with F. culmorum (FDK1 and FDK2) were confirmed by statistical analysis, appeared also to be associated with the TKW of plants in both control and infected plots (except Xgwm389, where marker × treatment interaction was significant). With the exception of Xgwm566, alleles of three other markers (Xgwm46, Xgwm389 and Xgwm533) contributed by Zebra increased TKW. Wang et al. (2009) found the marker Xgwm533 linked to QTL controlling TKW, which was considered as corresponding to the QTL for TKW described by Groos et al. (2003), and also to QTL for grain filling parameters. On the other hand, in the present studies the marker Xwmc238, localized on chromosome 4B (Somers et al. 2004), was strongly associated with KWS and TKW, but its association with FHB resistance was not so evident, because only marker × year interaction was significant.
Association between the markers applied in these studies and TKW is not unexpected, because this trait is controlled by a number of QTLs distributed on almost all of the wheat chromosomes (e.g. Varshney et al. 2000). This trait is an important element of yield structure with relatively high heritability and the relationships between the markers Xgwm46, Xgwm389 and Xgwm533 and QTLs controlling both the rate of FDK and TKW seem to be promising for breeding, because marker-assisted selection for resistance to FHB can be combined with selection for kernel weight; however, because marker × year interaction is significant for that trait, these markers may not always be useful for selecting high TKW.
Conclusions
The broad variation of lines within the RIL population and the relatively small differences between parents, which do not carry the major gene/s for resistance to FHB, indicate the dispersion of genes with small effects along Zebra and Saar genomes. These results also show that, in wheat, segregants/recombinants of improved resistance to FHB could be selected among progenies of parents with a similar moderate susceptibility to infection. In addition, associations between markers Xgwm46, Xgwm389, Xgwm533 and the rate of Fusarium-damaged kernels as well as TKW indicate that marker-assisted selection for resistance to FHB can be combined with selection for kernel weight. However, such a combined selection will not always be effective due to marker × year interaction for TKW—performance of selected genotypes can be affected by environment.
Literature Cited
- Anderson, J.A. (2007) Marker-assisted selection for Fusarium head blight resistance in wheat. Int. J. Food Microbiol. 119: 51–53.
- Ban, T. and K. Suenaga (2000) Genetic analysis of resistance to Fusarium head blight caused by Fusarium graminearum in Chinese wheat cultivar Sumai 3 and the Japanese cultivar Saikai 165. Euphytica 113: 87–99.
- Bernardo, A.N., H.X. Ma, D.D. Zhang and G.H. Bai (2012) Single nucleotide polymorphism in wheat chromosome region harboring Fhb1 for Fusarium head blight resistance. Mol. Breed. 29: 477–488.
- Bottalico, A. and G. Perrone (2002) Toxigenic Fusarium species and mycotoxins associated with head blight in small-grain cereals in Europe. Eur. J. Plant Phatol. 108: 611–624.
- Buerstmayr, H., M. Lemmens, L. Hartl, L. Doldi, B. Steiner, M. Stierschneider and P. Ruckenbauer (2002) Molecular mapping of QTLs for Fusarium head blight resistance in spring wheat. I. Resistance to fungal spread (Type II resistance). Theor. Appl. Genet. 104: 84–91.
- Buerstmayr, H., B. Steiner, L. Hartl, M. Griesser, N. Angerer, D. Lengauer, T. Miedaner, B. Schneider and M. Lemmens (2003) Molecular mapping of QTLs for Fusarium head blight resistance in spring wheat. II. Resistance to fungal penetration and spread. Theor. Appl. Genet. 107: 503–508.
- Buerstmayr, H., T. Ban and J.A. Anderson (2009) QTL mapping and marker-assisted selection for Fusarium head blight resistance in wheat: a review. Plant Breed. 128: 1–26.
- Chakraborty, S., C.J. Liu, V. Mitter, J.B. Scott, O.A. Akinsanmi, S. Ali, R. Dill-Macky, J. Nicol, D. Backhouse and S. Simpfendorfer (2006) Pathogen population structure and epidemiology are keys to wheat crown rot and Fusarium head blight management. Australas. Plant Path. 35: 643–655.
- Chełkowski, J., P. Kaptur, M. Tomkowiak, M. Kostecki, P. Goliński, A. Ponitka, A. Jarzina-Ślusarkiewicz and J. Bocianowski (2000) Moniliformin accumulation in kernels of triticale accessions inoculated with Fusarium avenaceum in Poland. J. Phytopathol. 148: 433–439.
- Chrpová, J., V. Šíp, T. Sedláček, L. Štočková, O. Veškrna and P. Horčička (2011) Effectiveness of marker-based selection for Fusarium head blight resistance in spring wheat. Czech J. Genet. Plant Breed. 47: 123–129.
- Cowger, C., J. Patton-Özkurt, G. Brown-Guedira and L. Perugini (2009) Post-anthesis moisture increased Fusarium head blight and deoxynivalenol levels in North Carolina winter wheat. Phytopathology 99: 320–327.
- Cuthbert, P.A., D.J. Somers, J. Thomas, S. Cloutier and A. Brulé-Babel (2006) Fine mapping Fhb1, a major gene controlling Fusarium head blight resistance in bread wheat (Triticum aestivum L.). Theor. Appl. Genet. 112: 1465–1472.
- Draeger, R., N. Gosman, A. Steed, E. Chandler, M. Thomsett, Srinivasachary, J. Schondelmaier, H. Buerstmayr, M. Lemmens, M. Schmolke et al. (2007) Identification of QTLs for resistance to Fusarium head blight, DON accumulation and associated traits in the winter wheat variety Arina. Theor. Appl. Genet. 115: 617–625.
- Edwards, S.G. (2004) Influence of agricultural practices on Fusarium infection of cereals and subsequent contamination of grain by trichothecene mycotoxins. Toxicol. Lett. 153: 29–35.
- Gamborg, O.L., R.A. Miller and K. Ojima (1968) Nutrient requirements for suspension cultures of soyabean root cells. Exp. Cell Res. 50: 151–158.
- Gervais, L., F. Dedryver, J.Y. Morlais, V. Bodusseau, S. Negre, M. Bilous, C. Gross and M. Trottet (2003) Mapping of quantitative trait loci for field resistance to Fusarium head blight in an European winter wheat. Theor. Appl. Genet. 106: 961–970.
- Groos, C., N. Robert, E. Bervas and G. Charmet (2003) Genetic analysis of grain protein-content, grain yield and thousand-kernel weight in bread wheat. Theor. Appl. Genet. 106: 1032–1040.
- Gosman, N., R. Bayles, P. Jennings, J. Kirby and P. Nicholson (2007) Evaluation and characterization of resistance to Fusarium head blight caused by by Fusarium culmorum in UK winter wheat cultivars. Plant Pathol. 56: 264–276.
- Goulden, C.H. (1939) Problems in plant selection. In: Proc. Seventh Genet. Cong. Cambridge University Press, pp. 132–133.
- Häberle, J., M. Schmolke, G. Schweizer, V. Korzun, E. Ebmeyer, G. Zimmermann and L. Hartl (2007) Effects of two major Fusarium head blight resistance QTL verified in a winter wheat backcross population. Crop Sci. 47: 1823–1831.
- Hollins, T.W., P. Ruckenbauer and H. De Jong (2003) Progress towards wheat varieties with resistance to Fusarium head blight. Food Control 14: 239–244.
- Jia, G., P. Chen, G. Qin, G. Bai, X. Wang, S. Wang, B. Zhou, S. Zhang and D. Liu (2005) QTLs for Fusarium head blight response in a wheat DH population of Wangshuibai/Alondra’s’. Euphytica 146: 183–191.
- Jinks, J.L. and H.S. Pooni (1976) Predicting the properties of recombinant inbred lines derived by single seed descent. Heredity 36: 253–266.
- Klahr, A., G. Zimmermann, G. Wenzel and V. Mohler (2007) Effects of environment, disease progress, plant height and heading date on the detection of QTLs for resistance to Fusarium head blight in an European winter wheat cross. Euphytica 154: 17–28.
- Kosová, K., J. Chrpová and V. Šip (2009) Cereal resistance to Fusarium head blight and possibilities of its improvement through breeding. Czech J. Genet. Plant Breed. 45: 87–105.
- Kubo, K., M. Fujita, N. Kawada, T. Nakajima, K. Nakamura, H. Maejima, T. Ushiyama, K. Hatta and H. Matsunaka (2013) Minor differences in anther extrusion affect resistance to Fusarium head blight in wheat. J. Phytopathol. 161: 308–314.
- Kuchel, H., G. Hollamby, P. Langridge, K. Williams and S.P. JeVeries (2006) Identification of genetic loci associated with ear-emergence in bread wheat. Theor. Appl. Genet. 113: 1103–1112.
- Kuczyńska, A., M. Surma and T. Adamski (2007a) Methods to predict transgressive segregation in barley and other self pollinated crops. J. Appl. Genet. 48 : 321–328.
- Kuczyńska, A., M. Surma, Z. Kaczmarek and T. Adamski (2007b) Relationship between phenotypic and genetic diversity of parental genotypes and the frequency of transgression effects in barley (Hordeum vulgare L.). Plant Breed. 126: 361–368.
- Lillemo, M. and H. Skinnes (2006) Genetic analysis of partial resistance to powdery mildew in bread wheat line Saar. Plant Dis. 90: 225–228.
- Lillemo, M., B. Asalf, R.P. Singh, J. Huerta-Espino, X.M. Chen, Z.H. He and A. Bjørnstad (2008) The adult plant rust resistance loci Lr34/Yr18 and Lr 46/Yr 29 are important determinants of partial resistance to powdery mildew in bread wheat line Saar. Theor. Appl. Genet. 116: 1155–1166.
- Lillemo, M., A.K. Joshi, R. Prasad, R. Chand and R.P. Singh (2013) QTL for spot blotch resistance in bread wheat line Saar co-locate to the biotropic disease resistance loci Lr34 and Lr46. Theor. Appl. Genet. 126: 711–719.
- Ma, H.X., G.H. Bai, X. Zhang and W.Z. Lu (2006a) Main effects, epistasis, and environmental interactions of quantitative trait loci for Fusarium head blight resistance in a recombinant inbred population. Phytopathology 96: 534–541.
- Ma, H.X., K.M. Zhang, L. Gao, G.H. Bai, G.H. Chen, Z.X. Cai and W.Z. Lu (2006b) Quantitative trait loci for resistance to Fusarium head blight and deoxynivalenol accumulation in Wangshuibai wheat under field conditions. Plant Pathol. 55: 739–745.
- Malihipour, A., J. Gilbert, G. Fedak, A. Brûlé-Babel and W. Cao (2015) Characterization of agronomic traits in a population of wheat derived from Triticum timopheevii and their association with Fusarium head blight. Eur. J. Plant Pathol. 144: 31–43.
- Mardi, M., H. Buerstmayr, B. Ghareyazie, M. Lemmens, S.A. Mohammadi, R. Nolz and P. Ruckenbauer (2005) QTL analysis of resistance to Fusarium head blight in wheat using a ‘Wangshuibai’-derived population. Plant Breed. 124: 329–333.
- Mardi, M., L. Pazouki, H. Delavar, M.B. Kazemi, B. Ghareyazie, B. Steiner, R. Nolz, M. Lemmens and H. Buerstmayr (2006) QTL analysis of resistance to Fusarium head blight in wheat using a ‘Frontana’-derived population. Plant Breed. 125: 313–317.
- Marin, S., A.J. Ramos, G. Cano-Sancho and V. Sanchis (2013) Mycotoxins: occurrence, toxicology, and exposure assessment. Food Chem. Toxicol. 60: 218–237.
- Mather, K. and J.L. Jinks (1982) Biometrical Genetics, 3rd edn. Chapman and Hall, London.
- McCartney, C.A., D.J. Somers, D.G. Humphreys, O. Lukow, N. Ames, J. Noll, S. Cloutier and B.D. McCallum (2003) Mapping quantitative trait loci controlling agronomic traits in the spring wheat cross RL4452x’AC Domain’. Genome 48: 870–883.
- McCartney, C.A., D.J. Somers, G. Fedak, R.M. DePauw, J. Thomas, S.L. Fox, D.G. Humphreys, O. Lukow, M.E. Savard, B.D. McCallum et al. (2007) The evaluation of FHB resistance QTLs introgressed into elite Canadian spring wheat germplasm. Mol. Breed. 20: 209–221.
- Mesterházy, A. (1995) Types and components of resistance to Fusarium head blight of wheat. Plant Breed. 114: 377–386.
- Mesterházy, A., T. Bartok, C.G. Mirocha and R. Komoroczy (1999) Nature of wheat resistance to Fusarium head blight and the role of deoxynivalenol for breeding. Plant Breed. 118: 97–110.
- Mesterházy, A., A. Logrieco, J.A. Bailey, L. Corazza and B.M. Cooke (2002) Role of deoxynivalenol in aggressiveness of Fusarium graminearum and F. culmorum and in resistance to Fusarium head blight. Eur. J. Plant Phatol. 108: 675–684.
- Miedaner, T. (1997) Breeding wheat and rye for resistance to Fusarium diseases. Plant Breed. 116: 201–230.
- Miedaner, T., C. Reinbrecht, U. Lauber, M. Schollenberger and H.H. Geiger (2001) Effects of genotype and genotype–environment interaction on deoxynivalenol accumulation and resistance to Fusarium head blight in rye, triticale, and wheat. Plant Breed. 120: 97–105.
- Miedaner, T., F. Wilde, B. Steiner, H. Buerstmayr, V. Korzun and E. Ebmeyer (2006) Stacking quantitative trait loci (QTL) for Fusarium head blight resistance from non-adapted sources in an European elite spring wheat background and assessing their effects on deoxynivalenol (DON) content and disease severity. Theor. Appl. Genet. 112: 562–569.
- Niwa, S., K. Kubo, J. Lewis, R. Kikuchi, M. Alagu and T. Ban (2014) Variations for Fusarium head blight resistance associated with genomic diversity in different sources of the resistant wheat cultivar ‘Sumai 3’. Breed. Sci. 64: 90–96.
- Paillard, S., T. Schnurbusch, R. Tiwari, M. Messmer, M. Winzeler, B. Keller and B. Schachermayr (2004) QTL analysis of resistance to Fusarium head blight in Swiss winter wheat (Triticum aestivum L.). Theor. Appl. Genet. 109: 323–332.
- Parry, D.W., P. Jenkinson and L. McLeod (1995) Fusarium spike blight (scab) in small grain cereals—a review. Plant Pathol. 44: 207–238.
- Patil, R.M., M.D. Oak, S.A. Tamhankar and V.S. Rao (2009) Molecular mapping of QTLs for gluten strength as measured by sedimentation volume and mixograph in durum wheat (Triticum turgidum L. ssp durum). J. Cereal Sci. 49: 378–386.
- Pirgozliev, S.R., S.G. Edwards, M.C. Hare and P. Jenkinson (2003) Strategies for the control of Fusarium head blight in cereals. Eur. J. Plant Phatol. 109: 731–742.
- Röder, M.S., V. Korzun, K. Wendehake, J. Plaschke, M.-H. Tixier, P. Leroy and M.W. Ganal (1998) A microsatellite map of wheat. Genetics 149: 2007–2023.
- Schmolke, M., G. Zimmermann, H. Buerstmayr, G. Schweizer, T. Miedaner, V. Korzun, E. Ebmeyer and L. Hartl (2005) Molecular mapping of Fusarium head blight resistance in the winter wheat population Dream/Lynx. Theor. Appl. Genet. 111: 747–756.
- Schroeder, H.W. and J.J. Christiansen (1963) Factors affecting resistance of wheat to scab caused by Gibberella zeae. Phytopathology 53: 831–838.
- Skinnes, H., K. Semagn, Y. Tarkegne, A.G. Maroy and A. Bjørnstad (2010) The inheritance of anther extrusion in hexaploid wheat and its relationship to Fusarium head blight resistance and deoxynivalenol content. Plant Breed. 129: 149–155.
- Snijders, C.H.A. (1990) Fusarium head blight and mycotoxin contamination of wheat, a review. Neth. J. Plant Pathol. 96: 187–198.
- Snijders, C.H.A. (2004) Resistance in wheat to Fusarium infection and trichothecene formation. Toxicol. Lett. 153: 37–46.
- Somers, D.J., G. Fedak and M. Savard (2003) Molecular mapping of novel genes controlling Fusarium head blight resistance and deoxynivalenol accumulation in spring wheat. Genome 46: 555–564.
- Somers, D.J., P. Isaac and K. Edwards (2004) A high-density microsatellite consensus map for bread wheat (Triticum aestivum L.). Theor. Appl. Genet. 109: 1105–1114.
- Stępień, Ł., D. Popiel, G. Koczyk and J. Chełkowski (2008) Wheat-infecting Fusarium species in Poland—their chemotypes and frequencies revealed by PCR assay. J. Appl. Genet. 49: 433–441.
- Szabó-Hevér, A., S. Lehoczki-Krsjak, M. Varga, L. Purnhauser, J. Pauk, C. Lantos and A. Masterházy (2014) Differential influence of QTL linked to Fusarium head blight, Fusarium-damaged kernel, deoxynivalenol contents and associated morphological traits in a Frontana-derived wheat population. Euphytica 200: 9–26.
- Tamburic-Ilincic, L., A.W. Schaafsma and D.E. Falk (2007) Indirect selection for lower deoxynivalenol (DON) content in grain in a winter wheat population. Can. J. Plant Sci. 87: 931–936.
- Varshney, R.K., M. Prasad, J.K. Roy, N. Kumar Harjit-Singh, H.S. Dhaliwal, H.S. Balyan and P.K. Gupta (2000) Identification of eight chromosomes and a microsatellite marker on 1AS associated with QTL for grain weight in bread wheat. Theor. Appl. Genet. 100: 1290–1294.
- VSN International (2013) GenStat for Windows 16th Edition. VSN International, Hemel Hempstead, UK. Web page: GenStat.co.uk.
- Wang, R., L. Hai, X. Zhang, G. You, C. Yan and S. Xiao (2009) QTL mapping for grain filling rate and yield-related traits in RILs of the Chinese winter wheat population Heshangmai × Yu8679. Theor. Appl. Genet. 118: 313–325.
- Warzecha, T., T. Adamski, Z. Kaczmarek, M. Surma, P. Goliński, J. Perkowski, J. Chełkowski, H. Wiśniewska, K. Krystkowiak and A. Kuczyńska (2010) Susceptibility of hulled and hulless barley doubled haploids to Fusarium culmorum head blight. Cereal Res. Commun. 38: 220–232.
- Warzecha, T., T. Adamski, Z. Kaczmarek, M. Surma, J. Chełkowski, H. Wiśniewska, K. Krystkowiak and A. Kuczyńska (2011) Genotype-by-environment interaction of barley DH lines infected with Fusarium culmorum (W.G.Sm.) Sacc. Field Crops Res. 120: 21–30.
- Wiśniewska, H., Ł. Stępień, A. Waśkiewicz, M. Beszterda, T. Góral and J. Belter (2014) Toxigenic Fusarium species infecting wheat heads in Poland. Cent. Eur. J. Biol. 9: 163–172.
- Xue, S., G. Li, H. Jia, F. Xu, F. Lin, M. Tang, Y. Wang, X. An, H. Xu, L. Zhang et al. (2010) Fine mapping Fhb4, a major QTL conditioning resistance to Fusarium infection in bread wheat (Triticum aestivum L.). Theor. Appl. Genet. 121: 147–156.
- Yan, W. and L.A. Hunt (2001) Interpretation of genotype × environment interaction for winter wheat yield in Ontario. Crop Sci. 41: 19–25.
- Yang, J., G.E. Shaner and G.H. Bai (2004) Identifying new QTLs for resistance to Fusarium head blight using SSR and TRAP markers. Proc. 2nd International Symposium on Fusarium head blight, Wyndham Orlando Resort, Orlando, FL, 11–15 Dec. 2004, p. 213.
- Yang, Z.P., J. Gilbert, G. Fedak and D.J. Somers (2005) Genetic characterization of QTL associated with resistance to Fusarium head blight in a doubled-haploid spring wheat population. Genome 48: 187–196.
- Yuen, G.Y. and S.D. Schoneweis (2007) Strategies for managing Fusarium head blight and deoxynivalenol accumulation in wheat. Int. J. Food Microbiol. 119: 126–130.
- Zhang, X., H. Pan and G. Bai (2012) Quantitative trait loci responsible for Fusarium head blight resistance in Chinese landrace Baishanyuehuang. Theor. Appl. Genet. 125: 495–502.