Abstract
Tobacco (Nicotiana tabacum L.), particularly flue-cured tobacco, is one of the most economically important nonfood crops and is also an important model system in plant biotechnology. Despite its importance, only limited molecular marker resources are available for genome analysis, genetic mapping, and breeding. Simple sequence repeats (SSR) are one of the most widely-used molecular markers, having significant advantages including that they are generally co-dominant, easy to use, abundant in eukaryotic organisms, and produce highly reproducible results. In this study, based on the genome sequence data of flue-cured tobacco (K326), we developed a total of 13,645 mostly novel SSR markers, which were working in a set of eighteen tobacco varieties of four different types. A mapping population of 213 backcross (BC1) individuals, which were derived from an intra-type cross between two flue-cured tobacco varieties, Y3 and K326, was selected for mapping. Based on the newly developed SSR markers as well as published SSR markers, we constructed a genetic map consisting of 626 SSR loci distributed across 24 linkage groups and covering a total length of 1120.45 cM with an average distance of 1.79 cM between adjacent markers, which is the highest density map of flue-cured tobacco till date.
Introduction
Molecular markers are useful tools for genetic diversity, linkage mapping, quantitative trait locus mapping, and marker-assisted crop improvement. From the first molecular marker restriction fragment length polymorphisms (RFLPs) reported by Botstein et al. (1980), many different molecular markers have been developed and used in crops. Among them, microsatellites or simple sequence repeats (SSRs) are one of the most widely-used types of molecular markers because they have significant advantages over other similar methods, including that they are generally co-dominant, highly variable, easy to use, abundant in eukaryotic organisms, and the results obtained by using SSRs are highly reproducible (Nunome et al. 2009).
Tobacco (Nicotiana tabacum L.) is one of the most economically important nonfood crops in many countries. However, molecular marker development and genetic map construction in tobacco have lagged behind other Solanaceae crops such as the tomato, potato, and pepper plants (Barchi et al. 2007, Jacobs et al. 2004, Tanksley et al. 1992). Till date, the most important progress in this field has been an SSR-based linkage map based on an F2 population derived from an inter-type cross (a cross between two different types, dark tobacco and flue-cured tobacco; Bindler et al. 2007, 2011). Subsequently, the first SSR-based linkage map of flue-cured tobacco was conducted by Tong et al. (2012), a study in which 4,886 new SSR markers were developed and a linkage map consisting of 611 SSR marker loci and 24 tentatively defined linkage groups with a total length of 1,882.1 cM was constructed on the basis of a double haploid (DH) population from an intra-type cross (between two flue-cured tobacco lines, HonghuaDajinyuan and Hicks Broad Leaf). Thus far, no additional high-density SSR linkage maps have been available for flue-cured tobacco.
Nevertheless, considering that the genetic diversity between tobacco cultivars (particularly between those of the same type) is very limited (Del Piano et al. 2000, Julio et al. 2006, Rossi et al. 2001) and that cultivated tobacco is a tetraploid species with a very large genome (Doganlar et al. 2002, Livingstone et al. 1999, Ren and Timko 2001), making the development of PCR-based molecular markers generally inefficient, the number of SSR markers developed thus far is insufficient for genetic research and breeding of tobacco. Therefore, additional research is needed to develop new SSR markers in the tobacco plant. High-quality draft genomes for four main tobacco varieties (burley tobacco, TN90; flue cured tobacco, K326; Oriental tobacco, Basma Xanthi; and wild tobacco, N. otophora) have recently been reported by Sierro et al. (2014). The genome size of the four tobacco lines was reported to be 4.41 Gb, 4.60 Gb, 4.57 Gb, and 2.70 Gb, respectively, and the N50 length was >350 Kb except in the wild tobacco, N. otophora. Thus, the draft genomes reported by Sierro et al. (2014) will enhance the use of N. tabacum not only as a versatile model organism for functional genomics and biotechnology applications but also for molecular marker development and genetic linkage analysis. In addition, as intra-type crossing is an established practice in tobacco breeding, a genetic map specific to the flue-cured tobacco would potentially be more helpful for breeders than previously developed genetic maps.
In this study, we developed 13,645 working SSR markers in tobacco using the genomic sequence data of the flue-cured cultivar K326 (Sierro et al. 2014). Meanwhile, we further constructed a flue-cured tobacco genetic map with the highest reported density based on a backcross (BC1) population using these newly developed SSR markers as well as some from Bindler et al. (2011). Moreover, we also examined the novelty of our new marker set with the published marker set developed by Bindler et al. (2011) through the genomic sequence data of K326.
Materials and Methods
Plant materials
A panel of 18 typical tobacco varieties (Nicotiana tabacum L.) belonging to four types, including the two parental varieties of the mapping population (Y3 and K326; Table 1), were selected and used for testing the functionality and polymorphisms of the SSR markers. A population of 213 backcross (BC1) lines developed from a cross between two flue-cured tobacco cultivars, Y3 and K326, was used for map construction. Y3 is a landrace variety originating from Zimbabwe with excellent agronomic traits, while K326 is a commercial cultivar with an elite quality introduced from the USA.
Table 1
Tobacco varieties used for testing the variability of tobacco SSR markers
| Name |
Type |
Origin |
| Honghua Dajinyuan |
FC |
China |
| Y3 |
FC |
Zimbabwe |
| KRK26 |
FC |
Zimbabwe |
| K326 |
FC |
USA |
| Yunyan2 |
FC |
China |
| Yunyan85 |
FC |
China |
| Yunyan87 |
FC |
China |
| Yunyan97 |
FC |
China |
| Burley21 |
BU |
USA |
| Tennessee86 |
BU |
USA |
| Tennessee90 |
BU |
USA |
| Kentucky907 |
BU |
USA |
| Florida301 |
CI |
USA |
| Beinhart1000 |
CI |
USA |
| N. otophora |
WI |
Argentina & Bolivia |
| N. tomentosififormis |
WI |
Argentina & Bolivia |
| N. sylvestris |
WI |
Argentina & Bolivia |
| N. africana |
WI |
Namibia |
FC: flue-cured tobacco; BU: burley tobacco; CI: cigar tobacco; WI: wild species.
A search for SSRs was conducted on the basis of the genomic sequence data of cultivar K326 downloaded from the National Center for Biotechnology Information (NCBI; http://www.ncbi.nlm.nih.gov/Traces/wgs/?val=AWOJ01) (Sierro et al. 2014). Intact SSRs were identified using the program SSRIT (http://www.gramene.org/gramene/searches/ssrtool/), and a pair of primers was designed for each SSR using the program Primer3 (http://www.frodo.wi.mit.edu/cgi-bin/primer3/). Each SSR was provided a unique identifier beginning with TM, which is an abbreviation for Tobacco Microsatellite. To increase the polymorphism level, we only selected SSRs possessing at least 6 repeats for the di-nucleotide repeat type, 5 repeats for the tri-nucleotide repeat type, and 4 repeats for the tetra-, hexa-, and penta-nucleotide repeat types. To ensure the quality of the primer pairs we designed, the flanking sequence on each side was required to be at least 200 bp in length. In addition, the following parameter settings were used in the primer design: 1) primer length = 18–24 bp, optimal = 20 bp; 2) PCR product size = 201–400 bp, optimal = 300 bp; 3) annealing temperature = 55–63°C, optimal = 60°C; and 4) GC content = 40%–80%, optimal = 50%. The primers were screened using electronic-PCR (e-PCR; Schuler 1997) on the N. tabacum sequence data downloaded. Only those primer pairs that produced a unique sequence as expected from the e-PCR results were selected for synthesis. All primers used in the experiment were synthesized by Takara Biotechnology Co. Ltd. (Dalian, China).
DNA extraction and PCR
Fresh young leaves were collected from Y3, K326, and F1 (Y3 × K326) lines, individual BC1 lines and a panel of the remaining 16 tobacco lines. Total genomic DNA isolation and purification was conducted using the cetyltrimethyl ammonium bromide (CTAB) protocol with minor modifications (Maguire et al. 1994).
PCR of the SSR markers was performed in a 25 μL reaction mixture containing 2.5 μL of 1× PCR buffer (10 mM Tris-Cl, pH = 8.4, 50 mM KCl, 1.5 mM MgCl2), 200 μM of each dNTP (Takara), 1.0 μM each of forward and reverse primers, and 1.0 U of rTaq polymerase (Takara). The PCR program consisted of denaturing at 95°C for 5 min; 30 cycles of denaturing at 95°C for 30 s, annealing at a given temperature (depending on the primer pair; Supplemental Table 1) for 30 s, extension at 72°C for 30 s; and a final extension for 7 min at 72°C. PCR products were separated by 6% non-denaturing polyacrylamide gel electrophoresis (PAGE; 220 V, 2.5 h), and DNA bands were visualized by silver staining following the method of Bassam et al. (1991) with minor modifications.
Diversity analysis
The genetic relationship between the 18 tobacco varieties in Table 1 was investigated using the NTSYSpc 2.10e program (Exeter Software, Setauket, NY 11733-2870) with the following settings: Qualitative data, Dice coefficient, Sequential Agglomerative Hierarchical and Nested clustering method (SAHN), Unweighted Pair-Group Method, and, Arithmetic average (UPGMA).
Linkage map construction
The TM markers we developed well as the SSR markers reported by Bindle et al. (2011) (termed PT markers) were used to construct a genetic map. Linkage analysis was performed using the program JoinMap® version 4.0 (Van Ooijen 2006). The markers were classified into 24 linkage groups using the grouping module and based on a LOD score of 2.0–10.0. Marker order and genetic distance were calculated using a regression mapping algorithm with the parameters set as follows: Kosambi’s mapping function (Kosambi 1943); goodness-of-fit jump threshold for removal loci = 5.0; number of added loci after which to perform a ripple = 1; recombination frequency ≤0.35; LOD score ≥2.0; and third round = Yes. The constructed map was drawn with JoinMap® and MapChart v2.22 (Voorrips 2002).
Results
Development of SSR markers
In total, 208,176 SSRs with the required repeat numbers were identified from the genomic sequences of K326. Among these SSRs, 145,723 had long enough flanking sequences for designing primers. Under the parameters set for primer design, primer pairs were successfully designed for 67,434 SSRs. After filtering out the primer pairs that had more than one hit in the e-PCR test, 23,016 primer pairs remained and were then synthesized. These synthesized primer pairs were tested on the panel of 18 tobacco varieties (Table 1). After this analysis, markers were defined as either working or non-working. Working markers were defined by a maximum of four amplification fragments, with at least one of the fragments being precisely able to obtain specific PCR products with expected sizes in at least 12 of the 18 tobacco varieties tested. Non-working markers were those for which amplification failed in all the lines, or resulted in amplification of more than four fragments or the marker showed an excess of stuttering on the chromatogram. Finally, 5,867 (43.03%) markers out of 13,645 working SSR primer pairs (or TM markers) were polymorphic among the 18 varieties (Supplemental Table 1). The majority of the working markers (69.13%) amplified either one or two fragments in the tobacco genome. Amplification of one fragment can be interpreted as a primer pair that binds particularly to only one of the two genomes of tobacco, while two fragments are amplified when a primer pair binds to a (probably homologous) region in the two different genomes that constitute the allotetroploid genome of tobacco.
Parental survey
A set of 18 selected varieties/lines was screened to investigate the amount of polymorphism between potential parents for the mapping population. This set of lines consisted of different tobacco types such as flue-cured, burley, cigar, and wild tobaccos. A set of 120 high-quality SSR markers which amplified only one or two stable and clear fragments in the tobacco genome was used for the phylogenetic analysis of the 18 selected tobacco varieties (Fig. 1). Cluster analysis for these 18 lines shows that the various tobacco types clustered together in almost all cases. The four main tobacco types, burley, flue-cured, cigar, and wild tobacco, formed four distinct groups with defined clusters. Furthermore, the genetic similarity coefficient within these samples ranged from a very low value of 0.352 for the combination of the wild species N. africana and the flue-cured tobacco line HonghuaDajinyuan to a very high value of 1.00 for the combination of Burley Tennessee86 and Burley Tennessee90, indicating that a wide range of genetic diversity was present in these 18 selected samples. The results here provide a phylogenetic relationship similar to those obtained in other studies, such as with a previous SSR-based investigation (Olmstead et al. 2008).

According to the combination principle of parental lines, a cross between the flue-cured lines Y3 and K326 was selected as the mapping population for the generation of a genetic linkage map. The genetic similarity coefficient between these two lines was 0.912, which is close to the high end of all pair-wise combinations. Furthermore, a total of 476 SSR markers developed above were polymorphic between the varieties Y3 and K326, the two parental flue-cured lines of the mapping population. Simultaneously, to have more markers for map construction, we also utilized the SSR markers developed by Bindler et al. (2011). Among the 5,119 PT markers tested, 147 showed polymorphisms between Y3 and K326, and 78 of the polymorphic markers were located in the high-density linkage map constructed by Bindler et al. (2011). Thus, there were 623 SSR markers (primer pairs) used to genotype the BC1 population for constructing the genetic map. This result further indicated that the genetic diversity between Y3 and K326 was extremely narrow and the polymorphism of parent materials was very low.
Finally, we created a genetic linkage map that included 626 marker loci (detected by the 623 SSR primer pairs) in 24 tentative linkage groups, covering a total length of 1,120.45 cM (Figs. 2–7). The size of each linkage group varied 18.35–85.03 cM and the number of markers in each linkage group varied at 7–67. The distance between adjacent markers was <9.66 cM, with an average of only 1.79 cM (Table 2). Of the 623 SSR markers in our map, 147 were developed from the SSR markers described by Blinder et al. (2011), which were scattered into 23 linkage groups.


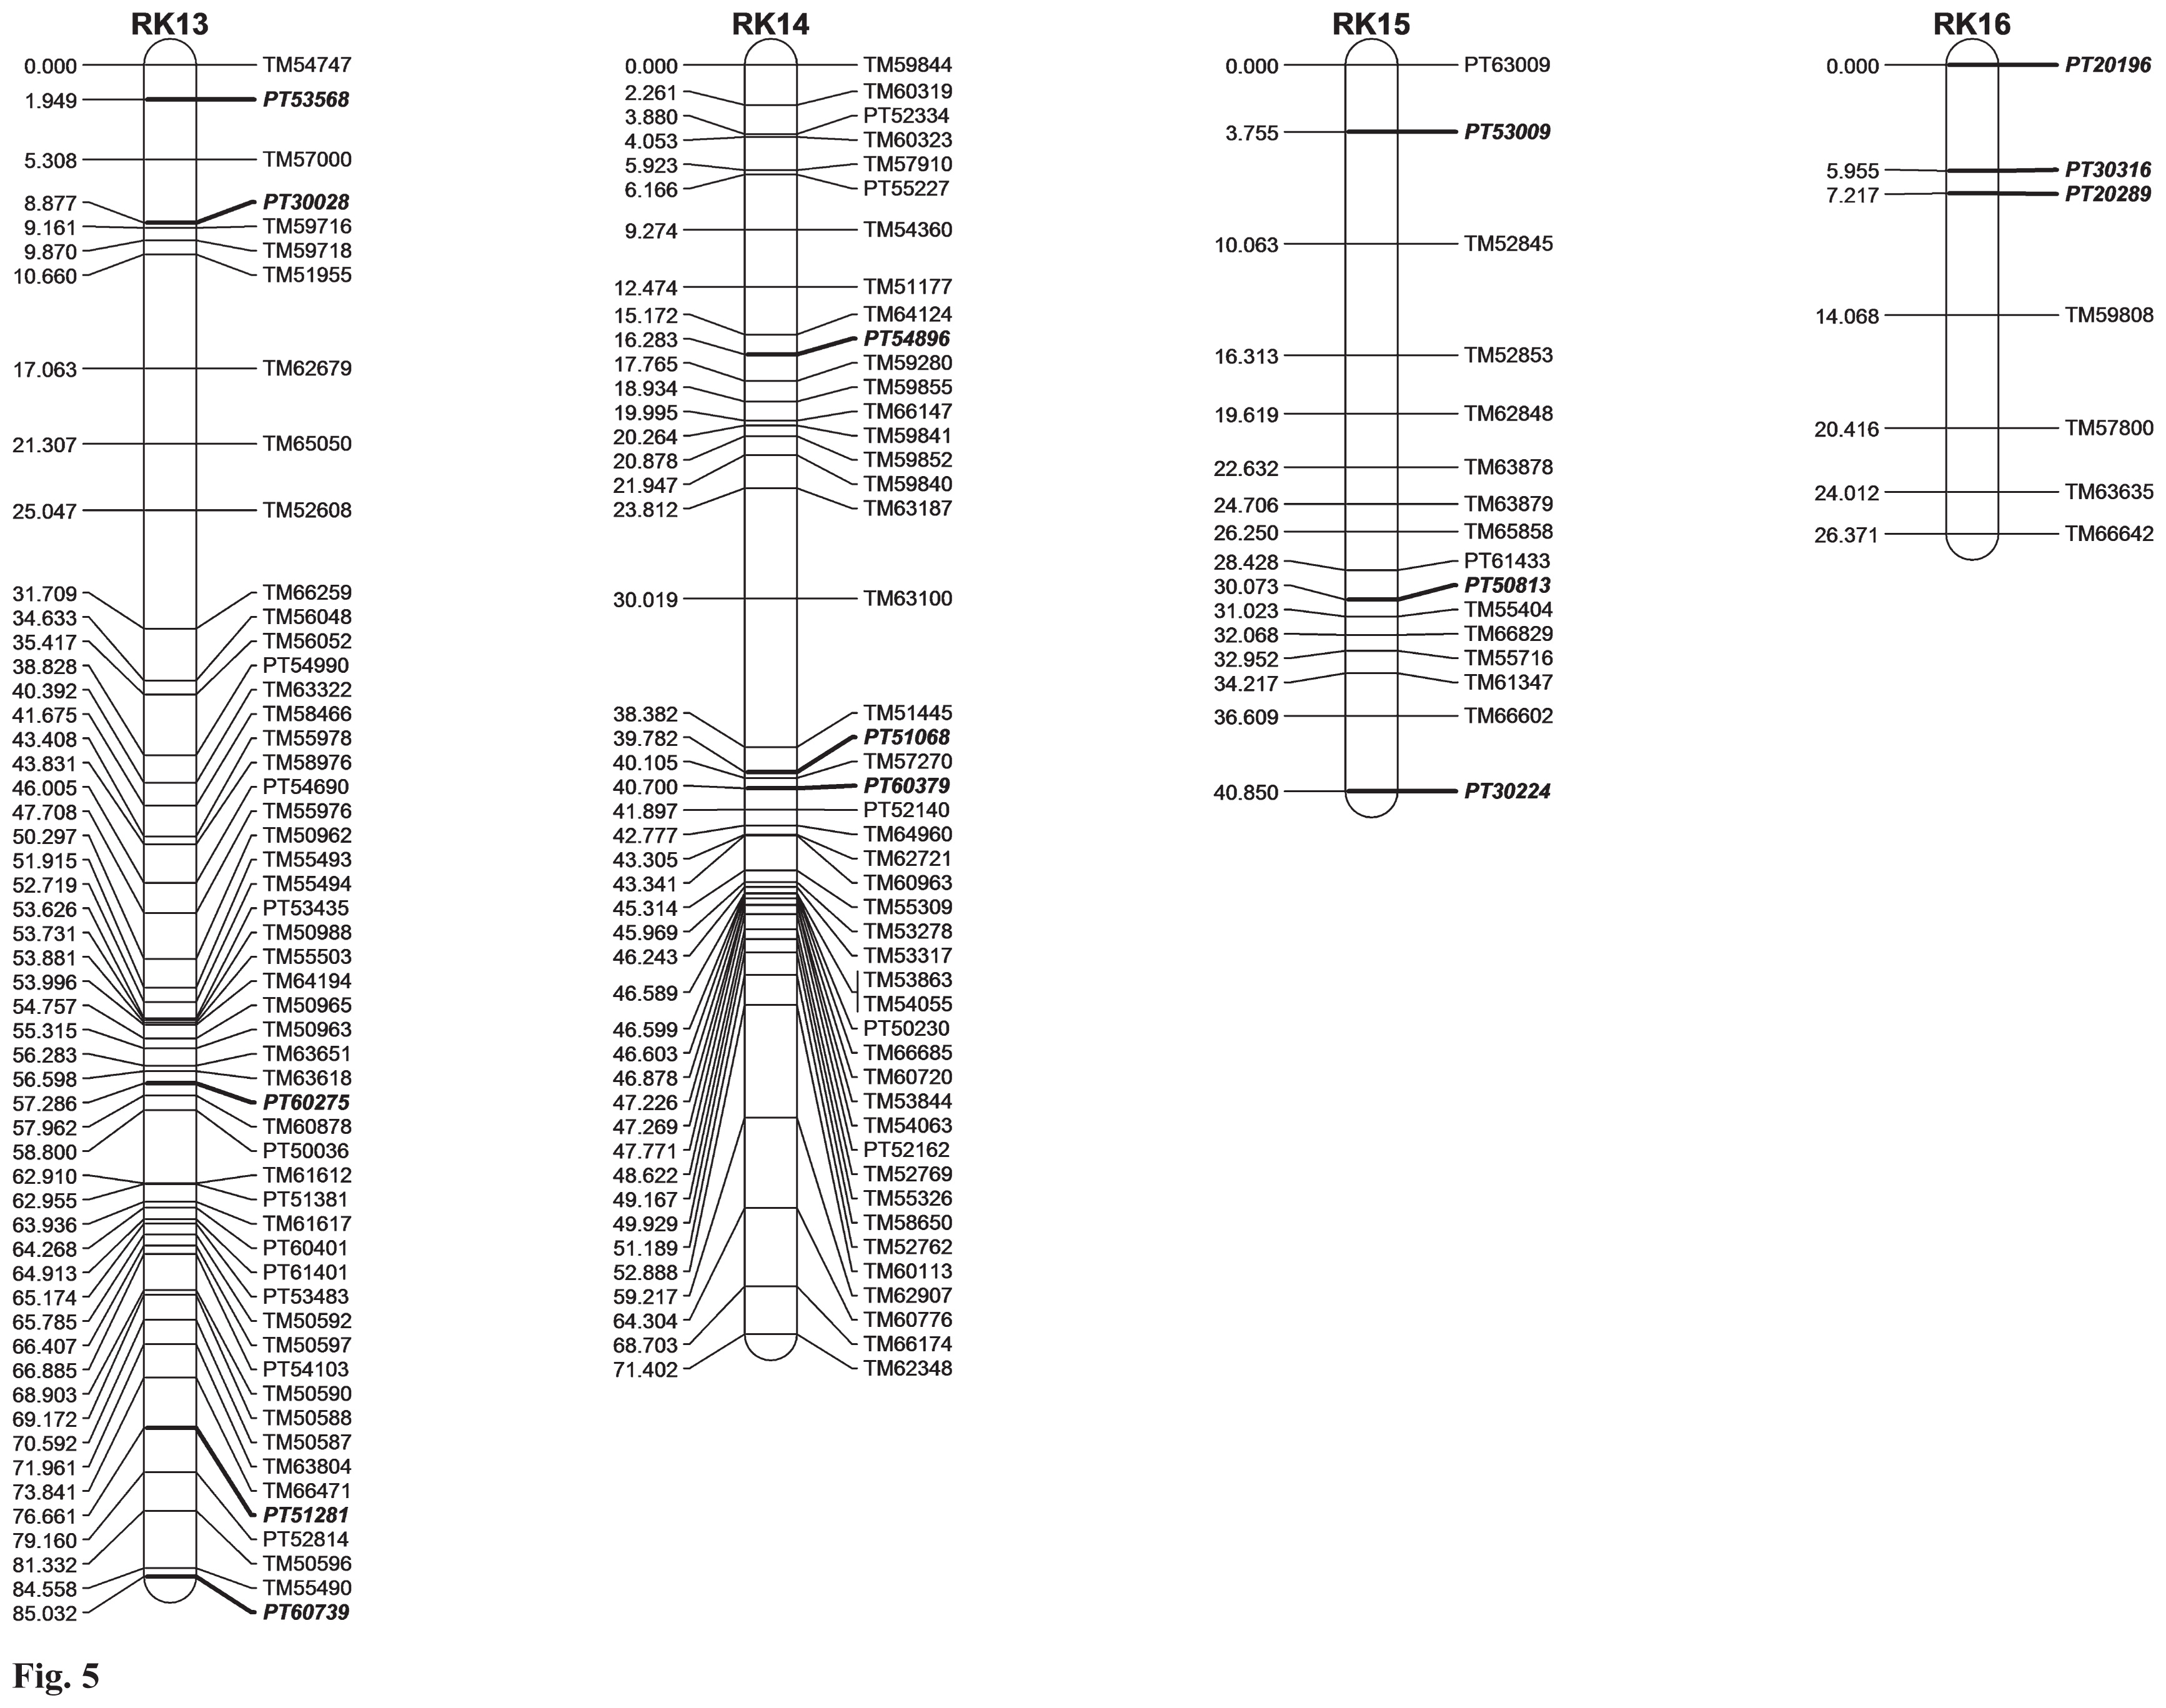


Table 2
Statistics of the SSR linkage map of flue-cured tobacco constructed in this study
| Linkage groups |
Markers number |
Length (cM) |
Min_Interval (cM) |
Max_Interval (cM) |
Density (cM/Marker) |
| Total |
PT1) |
TM |
| RK01 |
16 |
1(1) |
15 |
48.81 |
0.39 |
9.66 |
3.05 |
| RK02 |
49 |
4(3) |
45 |
55.13 |
0 |
8.57 |
1.13 |
| RK03 |
14 |
8(5) |
6 |
52.3 |
1.34 |
6.94 |
3.74 |
| RK04 |
20 |
4(4) |
16 |
81.93 |
0.51 |
7.88 |
4.10 |
| RK05 |
7 |
0(0) |
7 |
27.78 |
1.34 |
7.32 |
3.97 |
| RK06 |
12 |
9(6) |
3 |
64.03 |
2.22 |
7.56 |
4.98 |
| RK07 |
48 |
7(7) |
41 |
31.94 |
0 |
2.82 |
0.67 |
| RK08 |
12 |
4(1) |
8 |
36.83 |
1.19 |
5.61 |
3.07 |
| RK09 |
53 |
6(3) |
47 |
56.63 |
0 |
5.54 |
1.07 |
| RK10 |
30 |
6(1) |
24 |
42.33 |
0.01 |
3.45 |
1.41 |
| RK11 |
15 |
6(1) |
9 |
27.48 |
0.08 |
5.07 |
1.83 |
| RK12 |
37 |
6(5) |
31 |
75.03 |
0 |
9.42 |
2.03 |
| RK13 |
53 |
13(5) |
40 |
85.03 |
0.11 |
6.66 |
1.60 |
| RK14 |
46 |
8(3) |
38 |
71.4 |
0 |
8.38 |
1.55 |
| RK15 |
16 |
5(3) |
11 |
40.85 |
0.95 |
6.31 |
2.55 |
| RK16 |
7 |
3(3) |
4 |
26.37 |
1.26 |
6.85 |
3.77 |
| RK17 |
67 |
12(2) |
55 |
56.26 |
0 |
4.44 |
0.84 |
| RK18 |
8 |
5(5) |
3 |
24.12 |
1.24 |
4.99 |
3.02 |
| RK19 |
19 |
10(2) |
9 |
27.33 |
0 |
4.4 |
1.44 |
| RK20 |
12 |
8(3) |
4 |
37.35 |
0 |
8.16 |
3.11 |
| RK21 |
42 |
12(11) |
30 |
58.4 |
0.02 |
8.4 |
1.39 |
| RK22 |
19 |
5(4) |
14 |
41.92 |
0.51 |
4.96 |
2.21 |
| RK23 |
16 |
4(4) |
12 |
32.85 |
0.01 |
7.08 |
2.05 |
| RK24 |
8 |
3(1) |
5 |
18.35 |
0.09 |
5.5 |
2.29 |
| Total |
626 |
149(78) |
477 |
1120.45 |
0 |
9.66 |
1.79 |
1) Numbers in parentheses indicate that the markers were also mapped in the same linkage group of genetic map constructed by
Bindler et al. (2011). SSR marker names begin with the prefix “PT” and “TM” were developed by
Bindler et al. (2011) and this study, respectively.
Discussion
Novelty of the TM markers
In this study, we developed 13,645 working SSR markers (TM markers) in tobacco. Considering that 5,119 working SSR markers (PT markers) in tobacco have been published (Bindler et al. 2011), we examined the overlap of our TM marker set with the PT marker set based on the genomic sequence data of cultivar K326 by e-PCR with extremely strict parameters (100% identity and coverage). All of the TM markers obtained the target e-PCR products, while only 506 (9.88%) of the PT markers were able to obtain e-PCR products. The main reason for such low success rate of e-PCR in the PT markers might be that the genomic data used for developed PT and TM markers set was different (The former sequence data was Hicks while the latter was K326). In addition, almost all of the PT markers (approximately 96%) belonged to the di-nucleotide repeat type, whereas only 8,695 (63.72%) of the TM markers were di-nucleotide repeats (Supplemental Table 1). This means that more than one-third of the TM markers that belong to groups other than the di-nucleotide repeat type should be largely different from the PT markers. Furthermore, by performing e-PCR with all the PT markers against the tobacco genomic DNA sequences that were used for developing the TM markers, we found that only 239 (1.75%) PT markers hit the same SSR loci targeted by the TM markers (Supplemental Table 2). This clearly indicates that only a very small proportion of the TM markers are the same as the PT markers. Taken together, we conclude that the SSR markers developed in this study are for the most part novel.
Genetic relationships between the tobacco varieties
Previous studies have shown that cultivated tobacco is a tetraploid species with a very large genome (Doganlar et al. 2002, Livingstone et al. 1999, Ren and Timko 2001) and that the polymorphism levels between tobacco cultivars (especially between those of the same type) are generally low (Del Piano et al. 2000, Julio et al. 2006, Rossi et al. 2001). In this study, extremely limited genetic diversity was observed in flue-cured tobacco (GS = 0.82), while the lowest genetic similarity value of the four clusters was found in wild tobacco (GS = 0.35). This result is not only in agreement with previous reports, but also confirms that SSRs provide accurate markers for genetic diversity analysis. Tobacco was domesticated from only a few wild progenitors, and the genetic diversity in tobacco has decreased in recent decades under strict breeding selection (Moon et al. 2009a, 2009b), resulting in extremely limited genetic diversity in the flue-cured tobacco gene pool as revealed by several molecular marker-based studies on diversity. In the future, the analysis of additional tobacco lines using a set of high quality SSR markers should provide a very detailed picture of the genetic relatedness among tobacco lines within and between individual groups of germplasm. Furthermore, these data show that a limited set of SSR markers should be sufficient for variety identification and grouping of tobacco lines and varieties through the use of SSR marker databases.
SSR-based linkage map of tobacco
Although tobacco is an important economic nonfood crop in many countries and is also one of the most important model systems in plant biotechnology, limited cultivars exist with low nicotine and alkaloid content, preventing transition from the bench to the field. A high density genetic map can provide sufficient information to accelerate genome-based breeding. Previous attempts at creating genetic linkage map for tobacco have been achieved by using molecular marker-based techniques, including restriction-fragment length polymorphisms (RFLPs), random amplified polymorphic DNA (RAPD) (Lin et al. 2001, Xiao et al. 2006), sequence related amplified polymorphisms (SRAPs) (Cai et al. 2009, Ma et al. 2008), diversity array technology (DArT) (Lu et al. 2012), conserved orthologous sequences (COSII) (Wu et al. 2010), inter-simple sequence repeats (ISSRs) (Ma et al. 2008, Xiao et al. 2006) and simple sequence repeats (SSRs) markers (Bindler et al. 2007, 2011, Tong et al. 2012) (Table 3). As the best of the three previous SSR-based linkage maps, the SSR linkage map of an inter-type tobacco cross consisted of 2,318 SSR markers, which detected 2,363 loci in 24 clearly defined LGs with a total length of 3,270 cM (Bindler et al. 2011). In this study, we developed 13,645 working SSR markers for tobacco that defined 24 LGs with a total coverage of 1,120.45 cM. Fortunately, there were 78 PT markers in total shared by our map (the RK map) and the published map (the HR map) (Bindler et al. 2011), and all the linkage groups except linkage group 5 (RK05) in our map contained a few (1–11) shared markers (Table 2). This allowed us to adopt the linkage group numbering system of Bindler’s map in our map. The correspondence and collinearity of the linkage groups between the two maps have been identified, and the results exhibit good synteny in terms of the shared markers, which were all correctly located in the corresponding linkage groups in the RK map as predicted by the HR map (Supplemental Figs. 1–8). However, there were some shared markers in linkage groups 6, 12, 18, 20, 21, and 23 that showed inconsistent order between the two maps, which might be due to small chromosome structural inversions between the parental lines used in the two analyses.
Table 3
Comparison of linkage maps for tobacco
| Cross combination |
Population type |
Types of markers |
No. of markers |
Maps length (cM) |
No. of groups |
References |
| N. plumbaginifolia × N. longiflora (wild species) |
F2 |
RFLPa/RAPDb |
151 |
1385.6 |
19 |
Lin et al. 2001 |
| Speight G-28 × NC2326 (Flue-cured × Flue-cured) |
DH |
ISSRc/RAPD |
157 |
1838.2 |
27 |
Xiao et al. 2006 |
| Hicks Broad leaf × Red Russian (Flue-cured × Dark tobacco) |
F2 |
SSRd |
286 |
1920 |
24 |
Bindler et al. 2007 |
| Taiyan7 × Burly21 (Flue-cured × Burley) |
F2 |
SRAPe/ISSR |
112 |
1560.2 |
26 |
Ma et al. 2008 |
| Burley37 × Burley21 (Burley × Burley) |
DHi |
SRAP/AFLPf |
118 |
1953.6 |
22 |
Cai et al. 2009 |
| N. tomentosiformis × N. otophora (wild species) |
F2 |
COSIIg/SSR |
489 |
1071 |
12 |
Wu et al. 2010 |
| Hicks Broad leaf × Red Russian (Flue-cured × Dark tobacco) |
F2 |
SSR |
2317 |
3270 |
24 |
Bindler et al. 2011 |
| Hicks Broad leaf × Honghua Dajinyuan (Flue-cured × Flue-cured) |
DH |
SSR |
611 |
1882.1 |
24 |
Tong et al. 2012 |
| Hicks Broad leaf × Honghua Dajinyuan (Flue-cured × Flue-cured) |
DH |
SSR/DArTh |
851 |
2291 |
24 |
Lu et al. 2012 |
| Y3 × K326 (Flue-cured × Flue-cured) |
BC1F1 |
SSR |
626 |
1120.5 |
24 |
This study |
a Restriction fragment length polymorphism
b Random amplified polymorphic DNA
c Inter-simple sequence repeat
d Simple sequence repeats
e Sequence related amplified polymorphism
f Amplified fragment length polymorphism
g Conserved orthologous sequences
h Diversity arrays technology
i Double haploid population
This study resulted in a genetic map with the highest density (1.79 cM) of SSR markers to date for flue-cured tobacco. As aforementioned, extremely limited genetic diversity due to a domestication bottleneck and recent strict breeding was observed in flue-cured tobacco, which has impeded the development of molecular markers and the construction of linkage maps. Tobacco is tetraploid with a very large genome and a low polymorphism level between parental plants, which further complicates efforts to produce a linkage map in tobacco. Moreover, the approach that we used, non-denaturing PAGE and a silver stain to separate and visualize PCR products, has lower resolution, and is usually not able to distinguish two sequences (bands) with a difference of only a few (≤3) nucleotides in length. Therefore, we may have missed some polymorphic SSRs, and underestimated the SSR polymorphism level in the parental lines. These reasons could explain why only 476 SSR primer pairs (3.49%) of the 13,645 working SSR markers in tobacco were polymorphic and grouped into the linkage map. Moreover, the genetic map and SSR markers provided by this study may be more helpful for tobacco breeders in the genetic mapping of traits and marker-assisted selection breeding.
Acknowledgments
This work was supported by China National Tobacco Company (2014TBB01 and 110201301006 (JY-06)) and Yunnan Tobacco Company (2014YN18 and 2013YN01).
Literature Cited
- Barchi, L., J. Bonnet, C. Boudet, P. Signoret, I. Nagy, S. Lanteri, A. Palloix and V. Lefebvre (2007) A high-resolution intraspecific linkage map of pepper (Capsicum Annuum L.) and selection of reduced RIL subsets for fast mapping. Genome 50: 51–60.
- Bassam, B.J., G. Gaetano-Anollés and P.M. Gresshoff (1991) Fast and sensitive silver staining of DNA in polyacrylamide gels. Anal. Biochem. 196: 80–83.
- Bindler, G., V.R. der Hoeven, I. Gunduz, J. Plieske, M. Ganal, L. Rossi, F. Gadani and P. Donini (2007) A microsatellite marker based linkage map of tobacco. Theor. Appl. Genet. 114: 341–349.
- Bindler, G., J. Plieske, N. Bakaher, I. Gunduz, N. Ivanov, R.V. der Hoeven, M. Ganal and P. Donini (2011) A high density genetic map of tobacco (Nicotiana tabacum L.) obtained from large scale microsatellite marker development. Theor. Appl. Genet. 123: 219–230.
- Botstein, D., R.L. White, M. Skolnick and R.W. Davis (1980) Construction of a genetic linkage map in man using restriction fragment length polymorphisms. Am. J. Hum. Genet. 32: 314–331.
- Cai, C.C., L.G. Chai, Y. Wang, F.S. Xu, J.J. Zhang and G.P. Lin (2009) Construction of genetic linkage map of burley tobacco (Nicotiana tabacum L.) and genetic dissection of partial traits. Acta Agronomica Sinica 35: 1646–1654.
- Del Piano, L., M. Abet, C. Sorrentino, F. Acanfora, E. Cozzolino and A. Di Muro (2000) Genetic variability in Nicotiana tabacum and Nicotiana species as revealed by RAPD markers: 1. development of the RAPD procedure. International Contribution to Tobacco Research 19: 1–15.
- Doganlar, S., A. Frary, M.C. Daunay, R.N. Lester and S.D. Tanksley (2002) A comparative genetic linkage map of eggplant (Solanum melongena) and its implications for genome evolution in the Solanaceae. Genetics 161: 1697–1711.
- Jacobs, J.M.E., H.J. Van Eck, P. Arens, B. Verkerk-Bakker, B. te Lintel Hekkert, H.J.M. Bastiaanssen, A. El-Kharbotly, E. Pereira, E. Jacobsen and W.J. Stiekema (2004) A genetic map of potato (Solanum tuberosum) integrating molecular markers, including transposons, and classical markers. Theor. Appl. Genet. 91: 289–300.
- Julio, E., J.L. Verrier and F. de Borne-Dorlhac (2006) Development of SCAR markers linked to three disease resistances based on AFLP within Nicotiana tabacum L. Theor. Appl. Genet. 112: 335–346.
- Kosambi, D.D. (1943) The estimation of map distances from recombination values. Ann. Eugen. 12: 172–175.
- Lin, T.Y., Y.Y. Kao, S. Lin, R.F. Lin, C.M. Chen, C.H. Huang, C.K. Wang, Y.Z. Lin and C.C. Chen (2001) A genetic linkage map of Nicotiana plumbaginifolia/Nicotiana longiflora based on RFLP and RAPD markers. Theor. Appl. Genet. 103: 905–911.
- Livingstone, K.D., V.K. Lackney, J.R. Blauth, R. van Wijk and M.K. Jahn (1999) Genome mapping in Capsicum and the evolution of genome structure in the Solanaceae. Genetics 152: 1183–1202.
- Lu, X.P., Y.J. Gui, B.G. Xiao, Y.P. Li, Z.J. Tong, Y. Liu, X.F. Bai, W.R. Wu, L. Xia, E. Huttner et al. (2012) Development of DArT markers for a linkage map of flue-cured tobacco. Chin. Sci. Bull. 58: 641–648.
- Ma, H.B., J.M. Qi, Y.K. Li, J.X. Liang, T. Wang, T. Lan, S.H. Chen, A.F. Tao, L.H. Lin and J.M. Wu (2008) Construction of a molecular genetic linkage map of tobacco based on SRAP and ISSR markers. Acta Agronomica Sinica 34: 1958–1963.
- Maguire, T., G. Collins and M. Sedgley (1994) A modified CTAB DNA extraction procedure for plants belonging to the family Proteaceae. Plant Mol. Biol. Rep. 12: 106–109.
- Moon, H.S., J.S. Nicholson, A. Heineman, K. Lion, R. van der Hoeven, A.J. Hayes and R.S. Lewis (2009a) Changes in genetic diversity of U.S. flue-cured tobacco germplasm over seven decades of cultivar development. Crop Sci. 49: 498–508.
- Moon, H.S., J.M. Nifong, J.S. Nicholson, A. Heineman, K. Lion, R. van der Hoeven, A.J. Hayes and R.S. Lewis (2009b) Microsatellite-based analysis of tobacco (Nicotiana tabacum L.) genetic resources. Crop Sci. 49: 2149–2159.
- Nunome, T., S. Negoro, I. Kono, H. Kanamori, K. Miyatake, H. Yamaguchi, A. Ohyama and H. Fukuoka (2009) Development of SSR markers derived from SSR-enriched genomic library of eggplant (Solanum melongena L.). Theor. Appl. Genet. 119: 1143–1153.
- Olmstead, R.G., L. Bohs, H.A. Migid, E. Santiago-Valentin, V.F. Garcia and S.M. Collier (2008) A molecular phylogeny of the Solanaceae. Taxon 57: 1159–1181.
- Ren, N. and M.P. Timko (2001) AFLP analysis of genetic polymorphism and evolutionary relationships among cultivated and wild Nicotiana species. Genome 44: 559–571.
- Rossi, L., G. Bindler, H. Pijnenburg, P.G. Isaac, I. Giraud-Henry, M. Mahe, C. Orvain and F. Gadani (2001) Potential of molecular marker analysis for variety identification in processed tobacco. Plant Var. Seeds 14: 89–101.
- Schuler, G.D. (1997) Sequence mapping by electronic PCR. Genome Res. 7: 541–550.
- Sierro, N., J.N.D. Battey, S. Ouadi, N. Bakaher, L. Bovet, A. Willig, S. Goepfert, M.C. Peitsch and N.V. Ivanov (2014) The tobacco genome sequence and its comparison with those of tomato and potato. Nat. Commun. 5: 3833.
- Tanksley, S.D., M.W. Ganal, J.P. Prince, M.C. de Vicente, M.W. Bonierbale, P. Broun, T.M. Fulton, J.J. Giovannoni, S. Grandillo, G.B. Martin et al. (1992) High density molecular linkage maps of the tomato and potato genomes. Genetics 132: 1141–1160.
- Tong, Z.J., Z.M. Yang, X.J. Chen, F.C. Jiao, X.Y. Li, X.F. Wu, Y.L. Gao, B.G. Xiao and W.R. Wu (2012) Large-scale development of microsatellite markers in Nicotiana tabacum and construction of a genetic map of flue-cured tobacco. Plant Breed. 131: 674–680.
- Van Ooijen, J.W. (2006) JoinMap® 4.0, Software for the calculation of genetic linkage maps in experimental populations. Kyazma B.V, Wageningen.
- Voorrips, R.E. (2002) MapChart: software for the graphical presentation of linkage maps and QTLs. J. Hered. 93: 77–78.
- Wu, F.N., N.T. Eannetta, Y.M. Xu, J. Plieske, M. Ganal, C. Pozzi, N. Bakaher and S.D. Tanksley (2010) COSII genetic maps of two diploid Nicotiana species provide a detailed picture of synteny with tomato and insights into chromosome evolution in tetraploid N. tabacum. Theor. Appl. Genet. 120: 809–827.
- Xiao, B.G., Z.L. Xu, X.J. Chen, A.R. Shen, Y.P. Li and J. Zhu (2006) Genetic linkage map constructed by using a DH population for the flue-cured tobacco. Acta Tabacaria Sinica 12: 35–40.
