Abstract
To enhance a root trait-based selection program for rain-fed wheat breeding in Afghanistan, we simulated an efficient pre-breeding drought system. Plants were grown in 1 m pipes as control or 2 m pipes to simulate drought conditions soaking ground water up by capillary action supplemented by two different life supporting irrigations from top of the pipes (T1 and T2 droughts). T1 was used for studying genetic diversity in 360 Kihara Afghan wheat landraces (KAWLR). Both drought treatments were used to evaluate root traits in 30 selected genotypes. KAWLR showed large root length variations under T1, categorized as long root (>200 cm; LR), medium root (100–150 cm; MR) and short root (20–100 cm; SR) systems. LR genotypes were more drought resistant in terms of greater plant survivability under T1 and T2 compared with other groups and were capable of adjusting their root biomass partitioning at deepest part of the soil profile. Majority of the LR genotypes originated from predominantly rain-fed provinces, and most of their agronomic traits were strongly correlated with root biomass deep in the soil in response to drought. Three LR genotypes, including the longest root genotype LR-871 (KU7604), are recommended for rain-fed wheat breeding in Afghanistan.
Introduction
With a population of 7.3 billion, the world is currently in a state of food crisis and a two-fold increase in crop production will be required over the next half-century (Ray et al. 2013). The development of high yielding varieties is urgently needed to produce grain in the vast rain-fed regions of the world. Afghanistan is a country where more than 75% of the population are actively engaged in agriculture. The main food crop for the Afghan people is wheat, and rain-fed cultivation accounts for 60% of the country’s total wheat production (Afghanistan Statistical Yearbook 2010–11). Afghanistan is located in a dry part of the world with an annual precipitation of 300–400 mm; in some years this decreases to below 150 mm in rain-fed areas (Beekma and Fiddes 2011, FAO 1972). In addition, due to the particular soil type and structure (mostly sandy and calcareous), the underground water content is significantly reduced between midspring and the beginning of summer and the water table drops. Therefore, the production of wheat in rain-fed regions depends on deep-stored soil water on the impermeable bed of CaCO3 and on occasional rains in the summer. Deep-stored soil water is more reliable than variable in-season rainfall and this moisture is converted into grain with twice the efficiency of in-season rainfall since it is taken up later in crop growth, during the grain-filling period when the roots have already penetrated deeply (Wasson et al. 2012).
As soil water is depleted, extraction of water by crops depends on the depth and distribution of their roots (Dardanelli et al. 2004). Deeper roots can extract more water, thus avoiding water deficits at critical growth stages resulting in higher harvest indices (Ludlow and Muchow 1990). Generally, 70% of the total root volume is found in the uppermost 30 cm layer of soil, where most nutrients are present in the majority of agricultural soils (Manske and Vlek 2002). However, the root length density of wheat is not sufficient to extract all the available water deep in the soil profile (Clarke and Townley-Smith 1984). Where soil water is replenished at depth between crop growing seasons, greater rooting depth leads to improved stability in grain yield, but where the soil water is not replenished greater rooting depth confers little advantage (Ludlow and Muchow 1990). Several researchers have highlighted the importance of the deep root system of various crops for extracting moisture and improving performance in environments where water is limited (Atta et al. 2013 in wheat, Kamoshita et al. 2002 in rice, Reynolds et al. 2007 in wheat, Sinclair 1994 in Sorghum, Turner et al. 2001 in pulses, Uga et al. 2013 in rice, Wasson et al. 2012 in wheat). Manske and Vlek (2002) reported that differences in total root volume in the uppermost 100 cm of soil were not responsible for improved water use efficiency (WUE). However, a greater capacity for water extraction deep in the soil increases WUE because this water is used solely for transpiration, and is not lost through evaporation (Richards 1991). It is clear that wheat, which depends on stored soil moisture, needs a root system that reaches the deep soil profile (Manske and Vlek 2002, Sinclair 1994). Therefore, breeders need to find a root system ideotype that confers increased yield for the predominantly rain-fed, wheat producing, northern region of Afghanistan (Supplemental Fig. 1).
To widen the allelic diversity in bread wheat breeding, elite material can be crossed with genetic resources of the same genome: for example, landrace accessions originating from abiotic stressed environments that have become isolated from mainstream gene pools (Reynolds et al. 2007). It was assumed that such accessions may provide novel alleles that will complement existing stress-adaptive physiological mechanisms such as root partitioning at depth. Reynolds et al. (2007) first used the Spanish landrace collections conserved by the International Maize and Wheat Improvement Center (CIMMYT) and found better water uptake characteristics than the modern check at soil depths below 60 cm, but not from 30–60 cm. Increased yield was due to greater partitioning of root mass deeper in the soil and an increased ability to extract water, not an overall increase in dry root mass. Here, the Afghan wheat landraces collected by Dr. Hitoshi Kihara and his followers during three Botanical Expeditions between 1955 and 1979 organized by the Kyoto University Scientific Expedition to Karakoram and Hindukush (KUSEE 1955), Thomas’s expedition (Thomas 1965), and Kyoto University Scientific Expedition to Southwestern Eurasia (SGK 1979) (Terasawa et al. 2008, Kihara et al. 1965) were considered as Kihara Afghan wheat landrace (KAWLR) and used as the starting materials. These plant materials, which have a wide genetic diversity (Lopes et al. 2015, Sohail et al. 2015), have been used to improve various aspects of the wheat system (Manickavelu et al. 2013). The potential value of these KAWLR collections as a genetic resource for root system physiological mechanisms associated with drought adaptation has gone largely unrecognized. KAWLR, particularly genotypes that evolved in drier areas, may have increased rooting depth and root biomass distribution characteristics that enable them to capture water deeper in the soil.
Since the collections are large (>360 lines), we have prescreened them in the simulated wheat culture conditions of the rain-fed region of Afghanistan using 2 m PVC pipes (named as T1 drought stress). The drought tolerance potentials of root traits among a subset of 30 KAWLR having long root (LR), medium root (MR) and short root (SR) genotypes at various soil depths were investigated under optimum moisture (control) and dry soil conditions T1 and T2 (a modification of T1 with water withheld for 1 month). Finally, to identify promising genotypes, this subset of 30 KAWLR were validated under the real field drought conditions of Afghanistan.
Materials and Methods
Plant materials
In this study we used KAWLR collected by Dr. Hitoshi Kihara and his followers from 17 provinces of Afghanistan between 1955 to 1979 (Terasawa et al. 2008, Kihara et al. 1965) (Supplemental Fig. 1). Approximately 360 KAWLR retained by the Kihara Institute for Biological Research (KIBR), Japan, and 15 modern cultivars (MC) released in Afghanistan by CIMMYT, were first screened to generate three root system categories (LR, MR, SR) under simulated drought conditions in KIBR, Yokohama City University, Japan in 2014 (Osmani et al. 2015). A representative 10 genotypes from each of the categories (Supplemental Table 1) were evaluated in 2015. A similar set were validated in the real field conditions of Afghanistan to select breeding materials. Five MCs were used as check. Karahan, used in this study, is a winter wheat cultivar with good adaptation to the range of drought stresses developed by CIMMYT. Lalmi-2 and Lalmi-3 are CIMMYT/ICARDA (International Center for Agricultural Research in the Dry Areas) released facultative cultivars recommended for the rain-fed regions of Afghanistan (Dennis et al. 2002). Nishi shotor and Sorkhak are two local cultivars, well adapted to the Herat province, Afghanistan.
Pipe experiment
Growing conditions and drought treatment
To study the genetic variation among the KAWLR, wheat culture conditions were generated using 2 m PVC pipes (9 cm diameter) in KIBR, Yokohama City University, Japan in 2013–2014 wheat season (Osmani et al. 2015). Pipes were filled with a soddy soil (Kobayashi Sangyo Co. Ltd., Osaka, Japan) then placed in Fiber Reinforced Plastic (FRP) round plastic pools (190 cm wide × 90 cm height) containing 35 cm depth of water. Moisture sensors (EM5B Analog Data Logger’ Decagon Devices, Inc., Pullman, WA, USA) were fixed inside the pipes at 40 cm intervals, starting from the base, and recorded soil moisture throughout the experiment. The top 5 cm layer of each pipe was modified with 2% water-holding gel (San Tech, Kochi, Japan) to retain surface moisture for a longer period. The volumetric water content (VWC) (Supplemental Fig. 2B, lower panel) data showed that water could penetrate to a maximum of 1 m from the base inside each 2 m PVC pipe. Thus, an 80 cm zone (100–20 cm from the top) was defined as the dry zone in 2 m pipes, whereas 1 m PVC pipes would be optimum control condition. Plants were cultured as described previously (Osmani et al. 2015).
For evaluating the root systems of the subset of 30 KAWLR (SR, MR and LR), 1 m pipes were used as control condition, simulating well irrigated fields. The 2 m pipes, with two differing levels of top irrigations, were considered as drought conditions. One was exactly the same as the 2 m pipe condition used previously (T1 stress) (Osmani et al. 2015). The other was the modification in the top irrigation (labelled as T2 stress) as described below. Five seeds per genotype were first grown until they reached the 2-leaf stage, then transplanted into a PVC pipe and thinned thereafter into three healthy seedlings per pipe. The experiments were arranged in a completely randomized block design. Since different rain-fed regions in Afghanistan may receive different levels of precipitations even within a year, we have simulated two kinds of rain-fed conditions controlling life support top irrigations at the early stages of plant growth. We hypothesized that the combination of T2 in 2015 (more severe than T1) will allow us to get true candidate genotypes from the genotypes that were screened under T1 drought in the year 2014. We expected that this pre-breeding system will be able to identify such good and tolerant root system genotypes with phenotypic plasticity that may confer tolerance against the robustness to upcoming climate change. In the case of the T1 condition, the upper 20 cm of soil in the pipes was saturated to mimic a kind of rain-fed field conditions with a measured volume of irrigation (100–150 mL)/weeks for the first two months. For the moisture measurement, we used a Daiki pF meter 04 (Daiki Rika Kogyo Co., Ltd., Saitama, Japan) at 10, 20, and 40 cm soil depths. For T2 drought conditions, only two irrigations of the top 20 cm of soil were applied at 15 and 25 days after transplanting. Irrigation was then stopped for about one month; the plants were allowed to reach wilting point. The T2 pipes were re-irrigated similarly from the top to mimic extreme field condition in rain-fed region until two months after transplantation. Number of plants died was scored per pipe and survival rate was calculated from the total plants planted. Then, for both T1 and T2 conditions, irrigation was withheld and water was drained from the plastic pools when plants had reached the tillering stage. Since in the strategic desiccated T1 and T2 pipes, the soil moisture was maintained from the base of the pipe up to 1 m, it was hypothesized that (i) short root system genotypes will mostly be declined in our desiccated condition at the begging of early stages. (ii) Some of the medium root system genotypes may finally reach ground water at 1m, but majority of them will lose plant standing and growth during early developmental stage. (iii) Those genotypes that had the characteristic long root ideotypes, due to their faster and improved above ground potentials such as faster coleoptile emergence, early ground cover etc (Rebetzke et al. 2007, Wasson et al. 2012), would be able to store sufficient energy and will trigger its root system to quickly pass the dry zone (30–100 cm) along 2 m pipes. Once root reach the ground water, the above ground assimilates and ground water will be used for proper growth/partitioning of root system at the early plant stages and will be a great merit to feedback the above ground development and survival. Therefore, the number of survived plants after re-watering was counted to assess the tolerance/resilience potentials by root system capacity in desiccated pipes. Average monthly minimum/maximum daily temperatures in this environment for the period 2014–2015 were −3/16, −6.1/15.4, −3.8.5/19.9, −0.6/20.2, 2.3/23.6, 8.3/30.2, 13.5/29.1°C for December, January, February, March, April, May and June, respectively.
Measurement of physiological parameters
Total chlorophyll content (Chl) was measured at different stages after the start of the drought treatment in the same six plants (from two pipes). Measurements were made at 4.5 cm from the base of the last emerged leaves using a SPAD 502 chlorophyll meter (Konica Minolta, Osaka, Japan). The normalized difference vegetation index (NDVI) was recorded with a GreenSeeker handheld crop sensor (Trimble Navigation Ltd., Sunnyvale, CA, USA). Canopy temperature depression (CTD) was measured with a portable infrared and contact thermometer (Fluke 568; Fluke Co., Beijing, China). The NDVI and CTD were taken from two replications (two pipes) each having three sub-replications (three samples for each pipe). Stomatal conductance (SC) was measured on the abaxial side of the young leaves of six plants (from two pipes) after drought treatment and at the grain filling stage during the noon day period using an SC-1 Leaf Porometer (Decagon Devices, Inc., Pullman, WA, USA). Measurements were taken when the sky was clear, there was not more than a slight wind and the leaf surfaces were dry.
Measurements of upper ground traits
Shoot traits measured in all the pipe experiments in 2014 and 2015 were culm length (CL) or plant height (PH), number of tillers per plant, spike number per plant and shoot dry weight. CL or PH and tiller number (TN) were recorded after harvesting. Root length was determined from the base of the root to the tip of the root. At harvest time, the PVC pipes were gently removed, and plant and root were carefully separated from the soil. Each plant was carefully placed on a block panel for photography and the shoot of each plant was removed by cutting it at the base of the stem.
Sampling and measurements of root traits
After removing the shoot, roots were laid on a flat surface and measured from the base of the stem to the tip of the root system. Roots of each genotype were then transported to the laboratory for further analysis. The root system of each genotype was opened out and the length of the longest root was measured, then sliced into sections 20 cm long. After measuring all root parameters, the root system was packed into paper bags for drying at 80°C for 2 days to determine the dry weight.
Field experiment
Growing conditions and drought treatment
A field validation experiment with the subset of 30 KAWLRs was conducted in Afghanistan (Supplemental Fig. 2C). The experiment was designed as small yield plots with 2 m rows and three replications. The distance between rows was 70 cm and between plants within row was 20 cm. The latitude, longitude and altitude of the experimental site are 34°33′28.4″N, 69°07′08.2″E and 1791 m. The soil of the experimental site was sandy loam with pH 8.0. The climate was semi-dry with an annual precipitation of about 250 mm. Average rainfall in December, January, February, March, April, May and June for the period 2014–2015 were approximately 0.0 mm, 10.5 mm, 81.7 mm, 52.5 mm, 39.8 mm, 36.0 mm and 0.0 mm, respectively.
All the plots, control and drought, were irrigated once before sowing. After two days, 100 seeds per row were sown on November, 2014. In order to maintain moisture level, Daiki pF 04 were placed at 10, 20, and 40 cm soil depths. In case of control plots, optimum moisture levels at these depths were maintained throughout the wheat growing season. Based on pF meter readings, two more additional irrigations were given in the control plots, one at tillering stage and another at grain filling stage. On the other hand, for drought plots, no additional irrigation was given until harvest and plants were allowed to feed only natural rains. Average monthly minimum/maximum daily temperatures in this environment for the period 2014–2015 were −12.3/2.8, −11.4/1, −7/1.5, −2.4/8.5, 2.9/14.8, 2.6/20.9, 10.7/27.3°C for December, January, February, March, April, May and June, respectively.
Yield components under the real field conditions in Afghanistan
An analysis of the preliminary yield performance of 30 KAWLR and their checks was done in control and drought plots (2 m2). Plants were harvested in May 2015 at physiological maturity. Number of kernel per spikes (NKPS) was recorded on 10 random spikes harvested from each plot at maturity. Spikes were threshed and seeds were dried up to less than 10% moisture. Kernel weight (KW) and thousand kernel weight (TKW) were measured.
Statistical analysis
Data were summarized by calculating means and standard errors, and analyzed by analysis of variance (ANOVAs) for each trait. To determine genotypic and environmental variance for root length trait, ANOVA was carried out using the Microsoft excel data analyzer tools pack. Relationships between root traits and other parameters were computed by Pearson’s (Pearson 1895) simple correlation test of GenStat, using SPSS for Windows software (ver. 210; SPSS Inc., Chicago, IL, USA).
Results
Pipe experiment
Pre-breeding technology for genotypic variability among 360 KAWLR in 2014
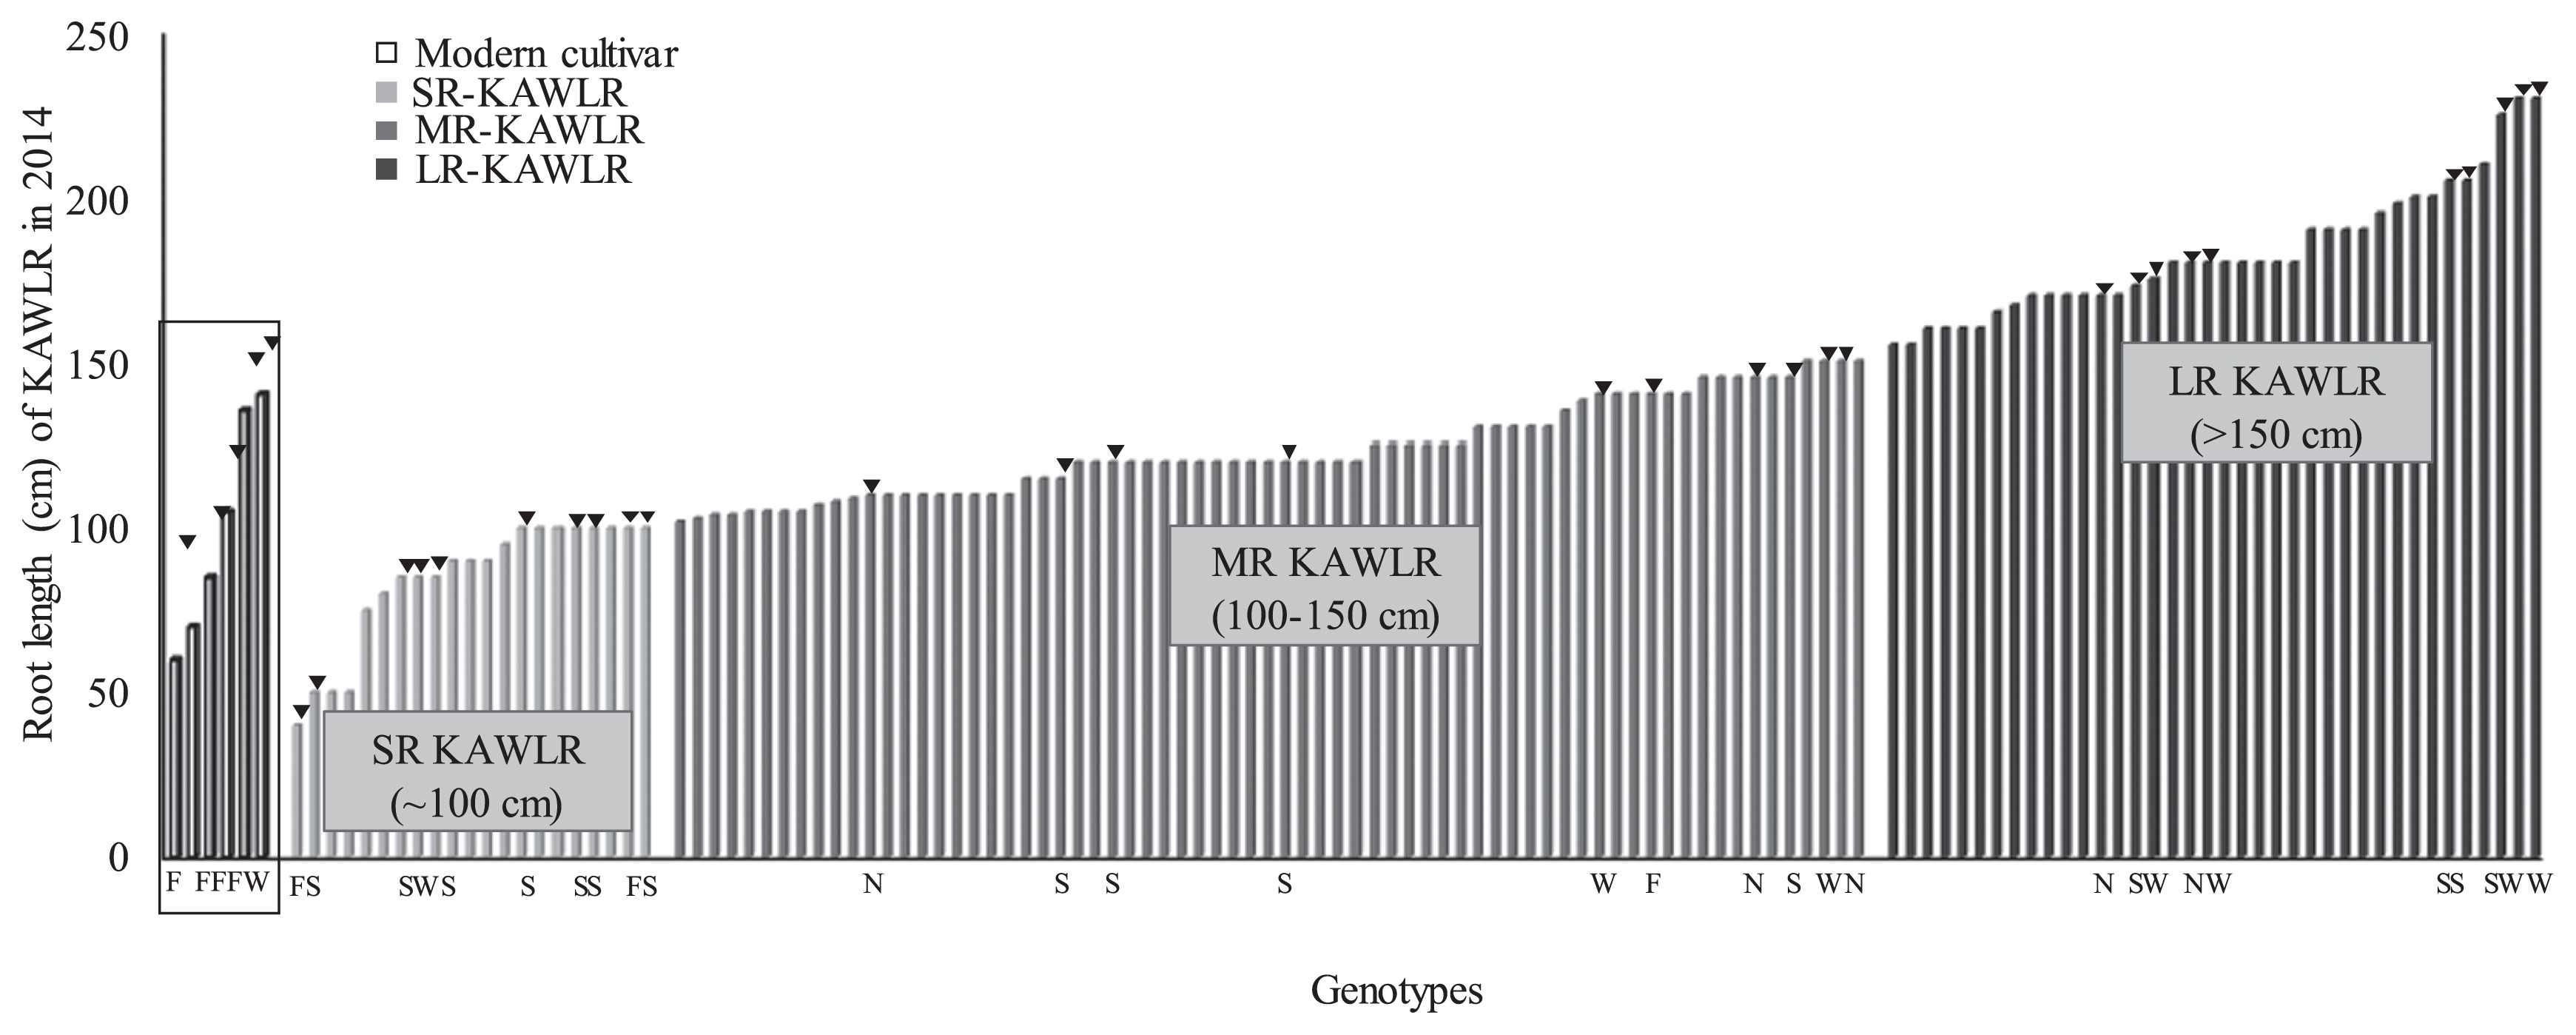
Genotypic responses among 360 KAWLR in terms of root and culm lengths were investigated at harvest time under T1 pipe culture condition (Supplemental Fig. 2A) (Osmani et al. 2015). The T1-screened plants (approximately 128 accessions) showed wide genetic variation consisting of thirteen genetic clades (Supplemental Table 1) out of fourteen as reported for a total of 446 KAWLR (Manickavelu et al. 2014). Large variation was observed between the minimum and maximum values for root length and CL in KAWLR grown under T1 condition (Fig. 1A, 1B). The range of longest root length and CL under the simulated drought condition was 60–300 cm and 25–60 cm, respectively. Most of the MC genotypes died under T1 conditions except for some reference cultivars. Based on the numerical values of the root lengths of surviving genotypes under T1 condition, KAWLR were categorized as LR type (>150 cm; 30%), MR type (100–150 cm; 54%) or SR type (<100 cm; 16%) (Fig. 2). There were no significant correlations between biomass of root and shoot (dry weight) among entire KAWLR survived under T1 condition (Supplemental Fig. 3).

We confirmed and modulated our drought system over two consecutive years. The analysis of variance between year 2014T1 and 2015T1 was not statistically significant (p = 0.64) for the longest root length trait for all germplasm groups (MC, SR, MR and LR) (Table 1). There was a high correlation in longest root length trait over two years among the genotypes (MC, SR, MR and LR) in both T1 and T2 drought treatments (Supplemental Fig. 4). These results indicating that the longest root length differs among genotypes and SR, MR and LR are three distinct types of root systems.
Table 1
Analysis of variance results on effects of 2014T1 and 2015T1 years for longest root length (LRL) trait of entire germplasm groups
| Groups |
No. of accessions |
Sum |
Average |
Variance |
| Year 2014 T1 |
35 |
4338 |
123.94 |
4077.64 |
| Year 2015 T1 |
35 |
4602.5 |
131.5 |
4736.84 |
| ANOVA |
| Source of variation |
SS |
df |
MS |
F |
P-value |
| Between years |
999.4321 |
1 |
999.43 |
0.23 |
0.64 |
| Within genotypes |
299692.4 |
68 |
4407.24 |
|
|
| Total |
300691.8 |
69 |
|
|
|
To identify genotype(s) from KAWLR with the fittest ideotypic root traits for wheat breeding under rain-fed conditions, we examined germplasm groups for plant survivability, root length and biomass, root distribution in relation to soil depth, and correlation of roots with shoots. As shown in Supplemental Table 2, 50% of the SR genotypes, 30% of the MR genotypes, and 0% of the LR genotypes died under T1 conditions. Under T2 drought conditions, 70% of the SR genotypes, 50% of the MR genotypes, and 0% of the LR genotypes died. These data indicate that LR genotypes are relatively drought tolerant when compared with the other categories. In order to assess these resilience/tolerance potentials by root system characteristic (Fig. 3), at first we analyzed relative values (desiccated/control) of root and CL and evaluated the differences among cultivar groups in response to T1 and T2 (Fig. 4). Overall, responses in relative values of root length were more than that of the relative values in CL. 50% of the SR genotypes, 30% of the MR genotypes and 0% of the LR genotypes showed relative values at ≤1 for LRL under T1 condition. Under T2 condition for LRL, 80% of the SR genotypes, 40% of the MR genotypes and 0% of the LR genotypes showed relative values at ≤1. Thus, long root system of LR group have relatively higher capacity of survival under surface soil conditions of T1 and T2 compared to other groups. The relative values >1 (almost 2) in the LR group indicate that long roots were faster in speed to pass the dry zone (30–100 cm) along 2 m pipes and thereby were faster to use ground water and become resilient for upper ground survival at the late phase of re-watering (two months after transplantation). With respect to the relative values (desiccated/control) of total root and shoot biomass (Fig. 5), the overall as well as group wise response under T1 and T2 conditions were similar to that of the relative values (desiccated/control) observed in root and CL.


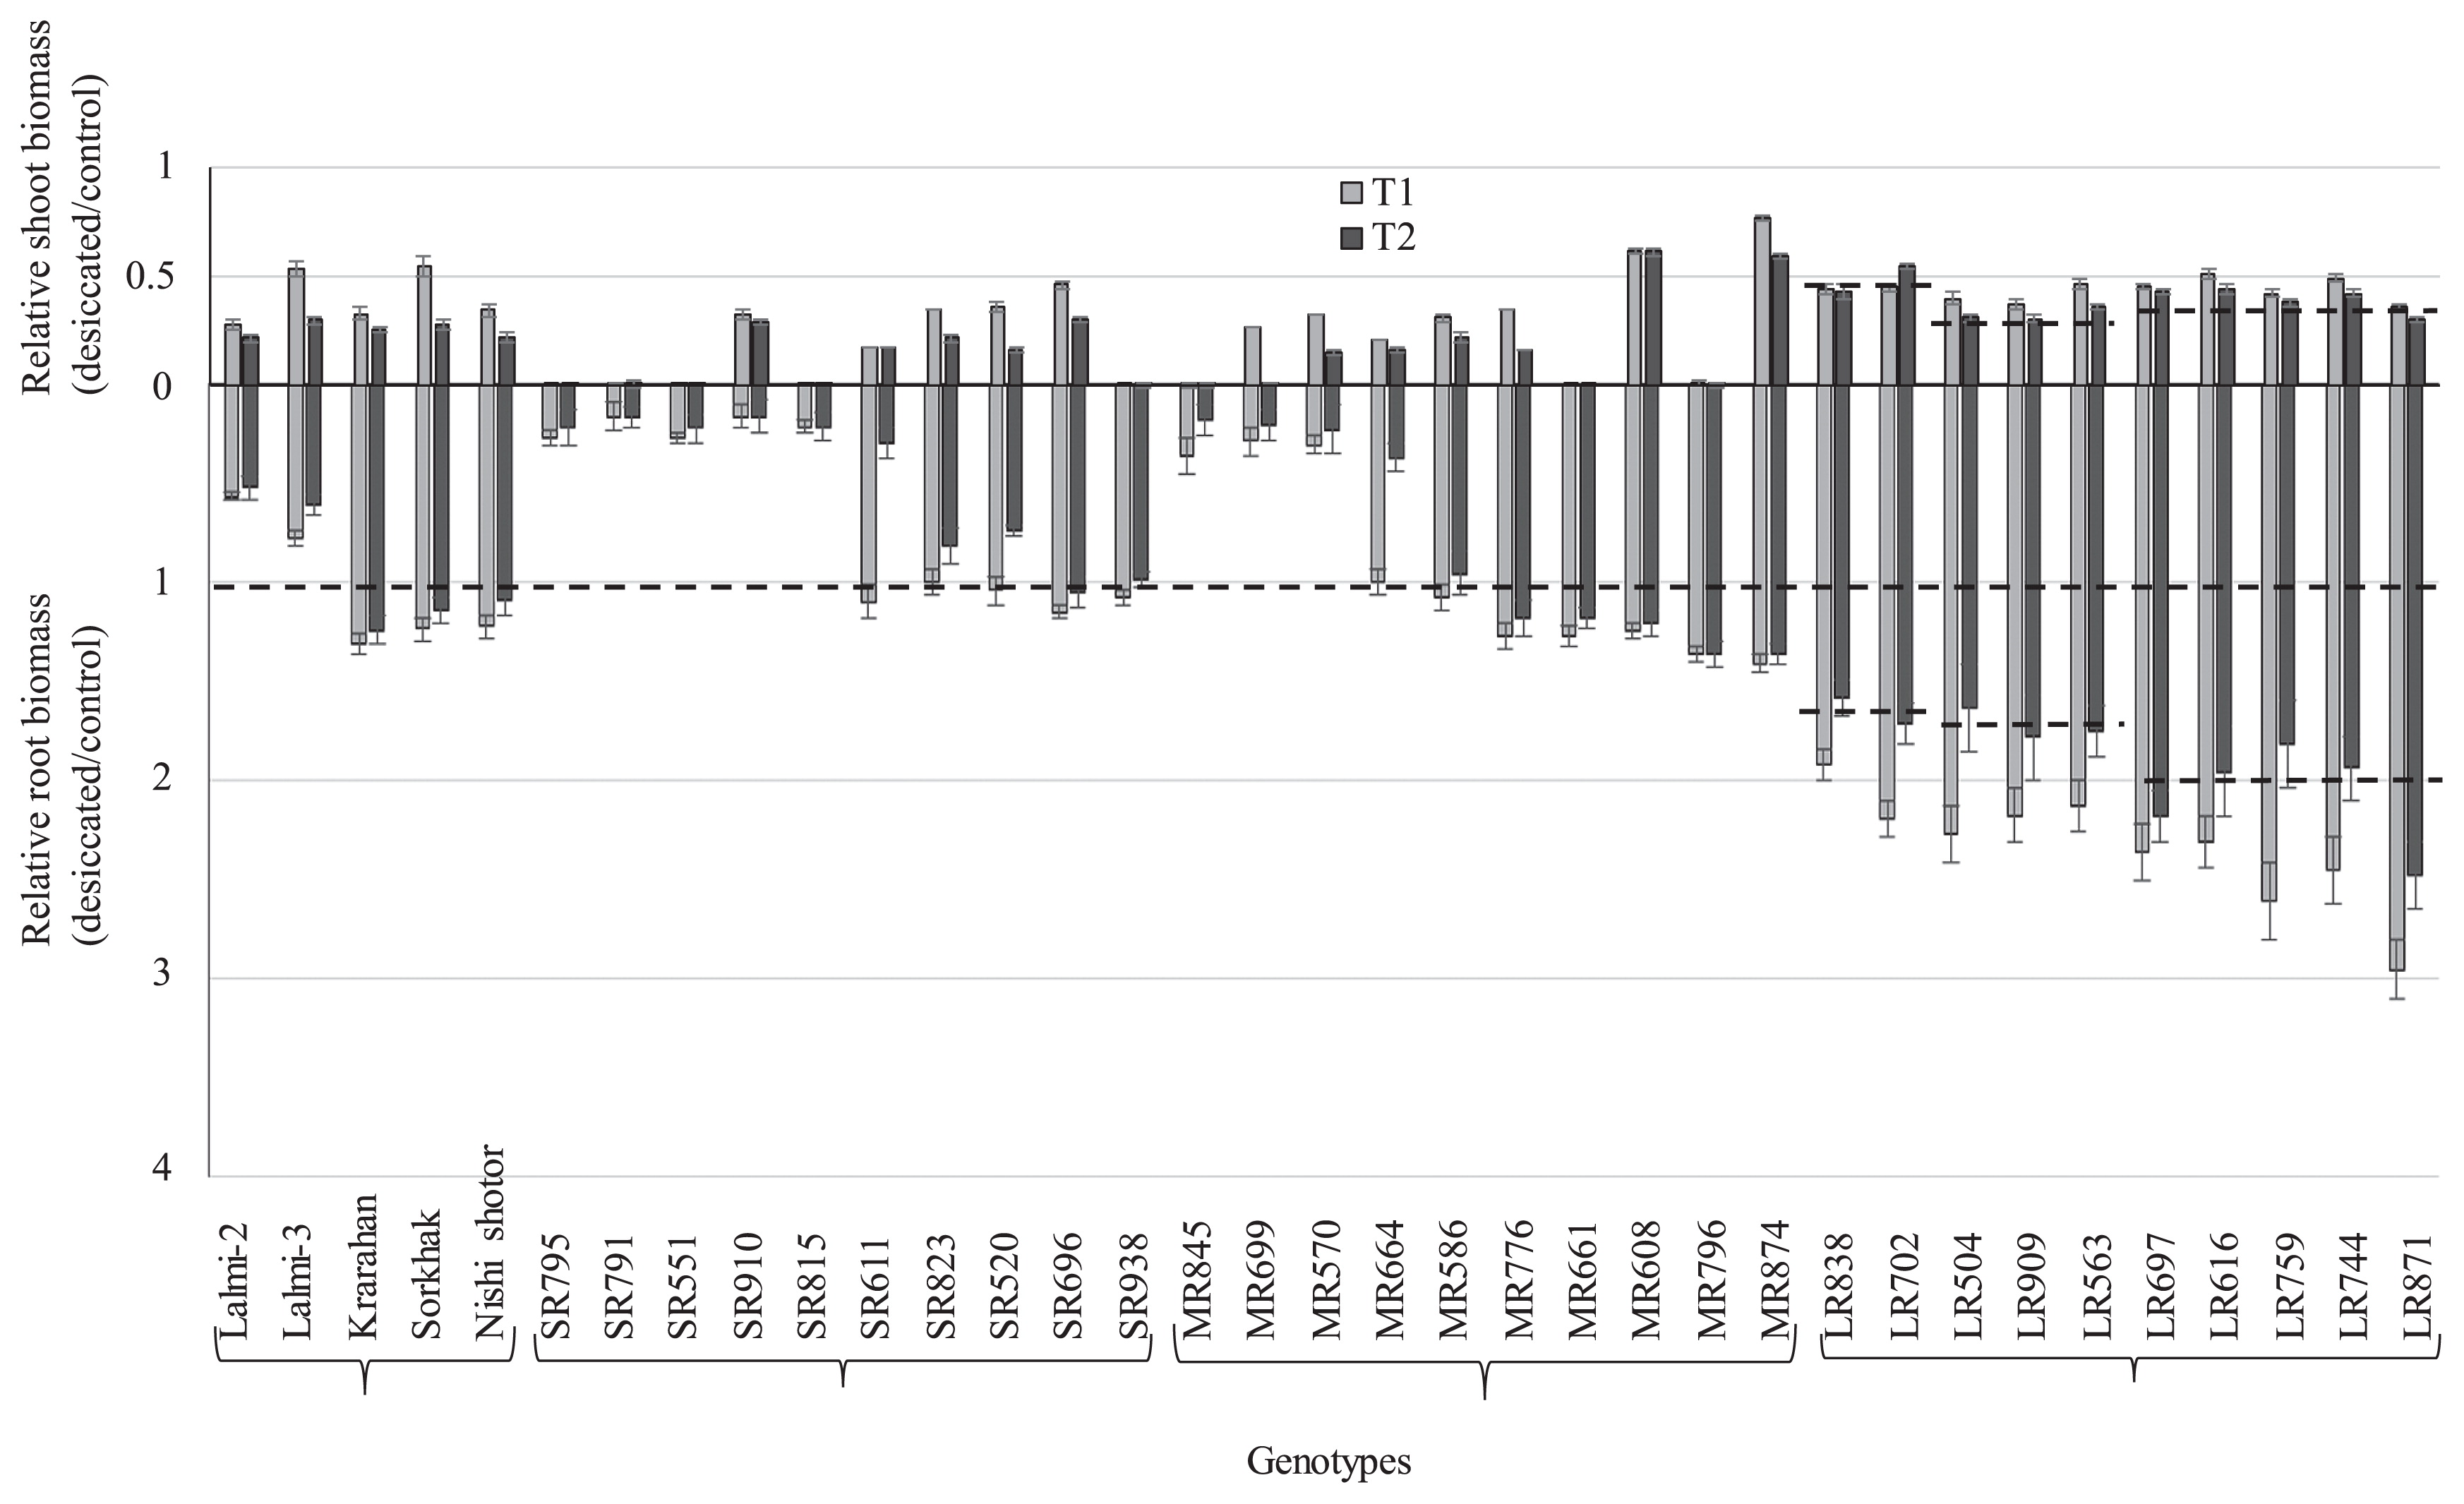
We then investigated the LR group to evaluate their contribution to proper growth of root system (biomass partitioning) and their feedback to shoot growth balance. The total shoot biomass in entire germplasms of four groups did not show positive correlation with total root biomass (TRB) in response to control, T1 and T2 treatments (Supplemental Fig. 5). However, when compared to control condition, an overall downward trend was observed among the genotype groups in response to T1 and T2 with the most downward trend by the LR dominated group, indicating that shoot biomass increase with decrease of root biomass. Next we analyzed how CL were correlated with root length systems. While the CL in the entire germplasms of four groups were not correlated with root length under control condition, there were positive correlations for various trends in response to T1 and T2 treatments (Fig. 6). The overall CL of SR dominated circle was decreased compared to control conditions. For MC and MR dominated circles, CL increased with the root length. With respect to the LR pre-dominant circle, CL did not change with the increase of root length along 150 cm to end. Finally, we assessed how root biomass in LR was distributed at the depths, particularly below 150 cm, in response to T1 and T2 droughts. As shown in Fig. 7, in response to drought the LR group showed marked changes in root biomass distribution at depth, which was critical down to the 150-cm soil depth where LR was solely distributed. As calculated from the Fig. 7, 67–68% root biomass of LR found between 20–340 cm in depth, compared with 34–59% for other root categories, and approximately 48–55% for all categories under control conditions. Similarly, 46% of LR root biomass was observed between 60–340 cm in depth, compared with 10–29% for other root categories, and approximately 16–23% for all categories under control conditions. MC and MR had greater average root biomass under control condition at soil depth 0–20 cm compared to other groups. In response to T1 and T2 conditions, 50% accessions of LR group had longer roots with semi-long shoots (relative values at about ~0.5), 20% had relatively short roots (particularly under T2) with taller shoots (relative values at about 0.6 to 0.7), while the remaining 30% had also relatively short roots with shoots in between them (relative values at about 0.5 to 0.6) (Fig. 4). Similarly, the above mentioned 50% accessions (longer root with semi-long shoot) had greater root biomass with medium shoot biomass (relative values at about 0.30 to 0.40), 20% accessions (short root with taller shoot) had medium root biomass with greater shoot biomass (relative values at about 0.40 to 0.45), while the remaining 30% accessions (also relatively short roots with shoots in between them) had also medium root biomass with lowest shoot biomass (relative values at about ~0.30) (Fig. 5).

The LR genotypes 871, 744, 759, 697 and 616 had root lengths of approximately 270–340 cm with well-balanced CL (65–80 cm) and promising root biomass architecture/distribution in response to drought. The overall ranking of the top five LR genotypes, based on root performance, was: LR-871 > 697 > 616 > 759 > 744.
Relationship between root traits and shoot traits in Japan
In order to reveal the trends of how root traits correlate with root biomasses at different depths (root length biomasses, RLB), at first we performed a correlation in entire population of all the germplasm groups (Table 2). Longest root length (LRL) had positive correlation with TRB and RLB, particularly at 60–260 cm only under T1 and T2 conditions. TRB was associated at 0–20 cm for control condition, 20–340 cm for T1 and 80–100 cm and 200–220 cm for T2 condition. RLB at 0–20 cm didn’t show any correlation with RLB. Over all, RLB showed strong positive correlation at depths. RLB traits below 60 cm tended to show stronger positive correlation than RLB traits at 0–60 cm under T1 and T2 conditions. In particularly, RLB at 80–160 cm and 220–320 cm shows strong positive correlations with RLB at almost all the depths.
Table 2
Correlation of root traits with root traits among entire germplasm of four groups under control (C), T1 and T2 conditions
| Traita |
Treatment |
LRL |
TRB |
RLB |
| 0–20 cm |
20–40 cm |
40–60 cm |
60–80 cm |
80–100 cm |
100–120 cm |
120–140 cm |
140–160 cm |
160–180 cm |
180–200 cm |
200–220 cm |
220–240 cm |
240–260 cm |
260–280 cm |
280–300 cm |
300–320 cm |
320–340 cm |
| LRL |
C |
1 |
|
|
|
|
|
|
|
|
|
|
|
|
|
|
|
|
|
|
|
T1 |
1 |
|
|
|
|
|
|
|
|
|
|
|
|
|
|
|
|
|
|
|
T2 |
1 |
|
|
|
|
|
|
|
|
|
|
|
|
|
|
|
|
|
|
| TRB |
C |
0.19 |
1 |
|
|
|
|
|
|
|
|
|
|
|
|
|
|
|
|
|
|
T1 |
0.73** |
1 |
|
|
|
|
|
|
|
|
|
|
|
|
|
|
|
|
|
|
T2 |
0.55** |
1 |
|
|
|
|
|
|
|
|
|
|
|
|
|
|
|
|
|
| 0–20 cm |
C |
0.16 |
0.86** |
1 |
|
|
|
|
|
|
|
|
|
|
|
|
|
|
|
|
|
T1 |
0.16 |
0.35 |
1 |
|
|
|
|
|
|
|
|
|
|
|
|
|
|
|
|
|
T2 |
−0.16 |
−0.07 |
1 |
|
|
|
|
|
|
|
|
|
|
|
|
|
|
|
|
| 20–40 cm |
C |
−0.15 |
0.33 |
0.09 |
1 |
|
|
|
|
|
|
|
|
|
|
|
|
|
|
|
|
T1 |
0.38 |
0.53** |
−0.08 |
1 |
|
|
|
|
|
|
|
|
|
|
|
|
|
|
|
|
T2 |
−0.02 |
0.16 |
−0.27 |
1 |
|
|
|
|
|
|
|
|
|
|
|
|
|
|
|
| 40–60 cm |
C |
0.19 |
0.29 |
−0.15 |
0.17 |
1 |
|
|
|
|
|
|
|
|
|
|
|
|
|
|
|
T1 |
0.29 |
0.56** |
−0.28 |
0.47* |
1 |
|
|
|
|
|
|
|
|
|
|
|
|
|
|
|
T2 |
0.30 |
0.30 |
−0.34 |
0.64** |
1 |
|
|
|
|
|
|
|
|
|
|
|
|
|
|
| 60–80 cm |
C |
0.23 |
0.23 |
−0.11 |
−0.03 |
0.57** |
1 |
|
|
|
|
|
|
|
|
|
|
|
|
|
|
T1 |
0.54** |
0.75** |
−0.04 |
0.44* |
0.63** |
1 |
|
|
|
|
|
|
|
|
|
|
|
|
|
|
T2 |
0.55** |
0.34 |
−0.40 |
0.48* |
0.52** |
1 |
|
|
|
|
|
|
|
|
|
|
|
|
|
| 80–100 cm |
C |
0.07 |
0.18 |
−0.17 |
−0.16 |
0.56** |
0.42* |
1 |
|
|
|
|
|
|
|
|
|
|
|
|
|
T1 |
0.41* |
0.64** |
−0.01 |
0.16 |
0.46* |
0.61** |
1 |
|
|
|
|
|
|
|
|
|
|
|
|
|
T2 |
0.63** |
0.47* |
−0.28 |
0.30 |
0.36 |
0.65** |
1 |
|
|
|
|
|
|
|
|
|
|
|
|
| 100–120 cm |
C |
NA |
NA |
NA |
NA |
NA |
NA |
NA |
NA |
|
|
|
|
|
|
|
|
|
|
|
|
T1 |
0.69** |
0.82** |
0.17 |
0.28 |
0.31 |
0.50** |
0.74** |
1 |
|
|
|
|
|
|
|
|
|
|
|
|
T2 |
0.73** |
0.40 |
−0.10 |
0.24 |
0.35 |
0.59** |
0.57** |
1 |
|
|
|
|
|
|
|
|
|
|
|
| 120–140 cm |
C |
NA |
NA |
NA |
NA |
NA |
NA |
NA |
NA |
NA |
|
|
|
|
|
|
|
|
|
|
|
T1 |
0.60** |
0.88** |
0.07 |
0.38 |
0.64** |
0.68** |
0.56** |
0.73** |
1 |
|
|
|
|
|
|
|
|
|
|
|
T2 |
0.78** |
0.39 |
−0.13 |
0.34 |
0.49* |
0.69** |
0.54** |
0.78** |
1 |
|
|
|
|
|
|
|
|
|
|
| 140–160 cm |
C |
NA |
NA |
NA |
NA |
NA |
NA |
NA |
NA |
NA |
NA |
|
|
|
|
|
|
|
|
|
|
T1 |
0.82** |
0.90** |
0.21 |
0.38 |
0.36 |
0.56** |
0.50** |
0.84** |
0.87** |
1 |
|
|
|
|
|
|
|
|
|
|
T2 |
0.59** |
0.19 |
−0.08 |
0.29 |
0.30 |
0.64** |
0.25 |
0.64** |
0.84** |
1 |
|
|
|
|
|
|
|
|
|
| 160–180 cm |
C |
NA |
NA |
NA |
NA |
NA |
NA |
NA |
NA |
NA |
NA |
NA |
|
|
|
|
|
|
|
|
|
T1 |
0.73** |
0.79** |
0.20 |
0.38 |
0.31 |
0.46* |
0.27 |
0.67** |
0.78** |
0.92** |
1 |
|
|
|
|
|
|
|
|
|
T2 |
0.54** |
0.21 |
−0.04 |
0.20 |
0.09 |
0.60** |
0.21 |
0.54** |
0.76** |
0.89** |
1 |
|
|
|
|
|
|
|
|
| 180–200 cm |
C |
NA |
NA |
NA |
NA |
NA |
NA |
NA |
NA |
NA |
NA |
NA |
NA |
|
|
|
|
|
|
|
|
T1 |
0.84 |
0.74** |
0.20 |
0.47* |
0.31 |
0.46* |
0.24 |
0.59** |
0.67** |
0.86** |
0.93** |
1 |
|
|
|
|
|
|
|
|
T2 |
0.56** |
0.29 |
0.11 |
0.14 |
0.21 |
0.42* |
0.14 |
0.59** |
0.71** |
0.78** |
0.80** |
1 |
|
|
|
|
|
|
|
| 200–220 cm |
C |
NA |
NA |
NA |
NA |
NA |
NA |
NA |
NA |
NA |
NA |
NA |
NA |
NA |
|
|
|
|
|
|
|
T1 |
0.82** |
0.79** |
0.09 |
0.38 |
0.30 |
0.49** |
0.47* |
0.78** |
0.74** |
0.88** |
0.88** |
0.88** |
1 |
|
|
|
|
|
|
|
T2 |
0.48* |
0.41* |
0.14 |
0.16 |
0.11 |
0.36 |
0.01 |
0.49* |
0.68** |
0.74** |
0.80** |
0.87** |
1 |
|
|
|
|
|
|
| 220–240 cm |
C |
NA |
NA |
NA |
NA |
NA |
NA |
NA |
NA |
NA |
NA |
NA |
NA |
NA |
NA |
|
|
|
|
|
|
T1 |
0.71** |
0.87** |
0.10 |
0.38 |
039* |
0.61** |
0.53** |
0.78** |
0.88** |
0.94** |
0.88** |
0.77** |
0.88** |
1 |
|
|
|
|
|
|
T2 |
0.24 |
0.00 |
0.06 |
0.15 |
−0.01 |
0.36 |
−0.04 |
0.21 |
0.56** |
0.64** |
0.86** |
0.64** |
0.74** |
1 |
|
|
|
|
|
| 240–260 cm |
C |
NA |
NA |
NA |
NA |
NA |
NA |
NA |
NA |
NA |
NA |
NA |
NA |
NA |
NA |
NA |
|
|
|
|
|
T1 |
0.54** |
0.81** |
0.09 |
0.36 |
0.43* |
0.54** |
0.45* |
0.69** |
0.86** |
0.86** |
0.81** |
0.64** |
0.75** |
0.95** |
1 |
|
|
|
|
|
T2 |
0.11 |
−0.03 |
−0.08 |
0.16 |
−0.13 |
0.42* |
0.22 |
0.05 |
0.38 |
0.55** |
0.75** |
0.30 |
0.48* |
0.85** |
1 |
|
|
|
|
| 260–280 cm |
C |
NA |
NA |
NA |
NA |
NA |
NA |
NA |
NA |
NA |
NA |
NA |
NA |
NA |
NA |
NA |
NA |
|
|
|
|
T1 |
0.37 |
0.64** |
−0.06 |
0.21 |
0.38 |
0.51** |
0.65** |
0.66** |
0.71** |
0.59** |
0.43* |
0.24 |
0.56** |
0.76** |
0.76** |
1 |
|
|
|
|
T2 |
0.11 |
−0.03 |
−0.08 |
0.16 |
−0.13 |
0.42* |
0.12 |
0.05 |
0.42* |
0.55** |
0.75** |
0.30 |
0.48* |
0.85** |
1.0** |
1 |
|
|
|
| 280–300 cm |
C |
NA |
NA |
NA |
NA |
NA |
NA |
NA |
NA |
NA |
NA |
NA |
NA |
NA |
NA |
NA |
NA |
NA |
|
|
|
T1 |
0.14 |
0.54** |
0.07 |
0.15 |
0.26 |
0.37 |
0.65** |
0.55** |
0.63** |
0.49** |
0.31 |
0.08 |
0.36 |
0.62** |
0.67** |
0.81** |
1 |
|
|
|
T2 |
NA |
NA |
NA |
NA |
NA |
NA |
NA |
NA |
NA |
NA |
NA |
NA |
NA |
NA |
NA |
NA |
NA |
|
|
| 300–320 cm |
C |
NA |
NA |
NA |
NA |
NA |
NA |
NA |
NA |
NA |
NA |
NA |
NA |
NA |
NA |
NA |
NA |
NA |
NA |
|
|
T1 |
0.14 |
0.54** |
0.07 |
0.15 |
0.26 |
0.37 |
0.45* |
0.55** |
0.63** |
0.49** |
0.31 |
0.08 |
0.36 |
0.62** |
0.67** |
0.81** |
1.0** |
1 |
|
|
T2 |
NA |
NA |
NA |
NA |
NA |
NA |
NA |
NA |
NA |
NA |
NA |
NA |
NA |
NA |
NA |
NA |
NA |
NA |
|
| 320–340 cm |
C |
NA |
NA |
NA |
NA |
NA |
NA |
NA |
NA |
NA |
NA |
NA |
NA |
NA |
NA |
NA |
NA |
NA |
NA |
NA |
|
T1 |
0.14 |
0.54** |
0.07 |
0.15 |
0.26 |
0.37 |
0.45* |
0.55** |
0.63** |
0.49** |
0.31 |
0.08 |
0.36 |
0.62** |
0.67** |
0.81** |
1.0** |
1.0** |
1 |
|
T2 |
NA |
NA |
NA |
NA |
NA |
NA |
NA |
NA |
NA |
NA |
NA |
NA |
NA |
NA |
NA |
NA |
NA |
NA |
NA |
a All the root traits were from physiological maturity.
* Correlation is significant at the 0.05 level (2-tailed).
** Correlation is significant at the 0.01 level (2-tailed).
Since the ultimate goal of this study was to find suitable wheat genotypes for breeding, we examined the relationship between ideotypic root traits and shoot/agronomic traits in Japan and Afghanistan. As shown in the Table 3 and Supplemental Tables 3 to 5, there are large variations among MC, SR, MR and LR for the correlation between root traits (LRL; TRB; and RLB) and other traits. Chl content and NDVI at grain filling showed a weak but positive correlation with LRL, TRB and RLB in response to T1 and T2 conditions, and particularly at depths of 220–280 cm for LR genotypes (Table 3). CTD, measured at the grain filling stage under T1 and T2 conditions, showed a very good correlation with LRL and RLB. For MC and SR, the association with CTD was at depths of 120–140 cm (r = 0.51–0.54) (Supplemental Tables 3, 4), whereas for MR genotypes CTD was associated with LRL (r = 0.64) and RLB (r = 0.50–0.51) at 120–160 cm (Supplemental Table 5). For LR genotypes, CTD was strongly associated with LRL (r = 0.70), and with RLB at depths of 120–200 cm (r = 0.50–0.51) and 220–320 cm (r = 0.49–0.67) (Table 3). SC at grain filling correlated positively, though weakly, with all three root traits in response to drought, especially in LR genotypes compared with other groups (Table 3). TN was significantly associated with TRB except in SR genotypes, where it was associated only under control condition (Supplemental Table 4). For LR and MR genotypes, TN was associated with TRB (r = 0.51–0.67) under drought conditions compared with TRB (r = 0.50) under control conditions (Supplemental Table 5, Table 3). Among the spike traits, spike length (SL) was associated with RLB only in LR genotypes in response to drought at depths of 220–340 cm (r = 0.49–0.55) (Table 3).
Table 3
Correlation of root traits with above ground traits among LR under C, T1 and T2 conditions
| Traita |
Treatment |
LRL |
TRB |
RLB |
| 0–20 cm |
20–40 cm |
40–60 cm |
60–80 cm |
80–100 cm |
100–120 cm |
120–140 cm |
140–160 cm |
160–180 cm |
180–200 cm |
200–220 cm |
220–240 cm |
240–260 cm |
260–280 cm |
280–300 cm |
300–320 cm |
320–340 cm |
| CHL |
C |
0.18 |
0.25 |
0.28 |
0.28 |
0.25 |
0.28 |
0.23 |
NA |
NA |
NA |
NA |
NA |
NA |
NA |
NA |
NA |
NA |
NA |
NA |
|
T1 |
0.15 |
0.21 |
0.25 |
0.18 |
0.19 |
0.34 |
0.22 |
0.25 |
0.20 |
0.17 |
0.17 |
0.25 |
0.08 |
0.40 |
0.31 |
0.33 |
0.17 |
0.08 |
0.06 |
|
T2 |
0.27 |
0.31 |
0.30 |
0.20 |
0.32 |
0.29 |
0.20 |
0.23 |
0.18 |
0.19 |
0.20 |
0.22 |
0.18 |
0.30 |
0.30 |
0.22 |
NA |
NA |
NA |
| NDVI |
C |
0.07 |
0.24 |
0.30 |
0.25 |
0.30 |
0.05 |
0.31 |
NA |
NA |
NA |
NA |
NA |
NA |
NA |
NA |
NA |
NA |
NA |
NA |
|
T1 |
0.35 |
0.30 |
0.13 |
0.32 |
0.22 |
0.25 |
0.26 |
0.35 |
0.19 |
0.12 |
0.22 |
0.33 |
0.15 |
0.29 |
0.32 |
0.41 |
0.07 |
0.13 |
0.20 |
|
T2 |
0.29 |
0.29 |
0.17 |
0.05 |
0.04 |
0.06 |
0.19 |
0.11 |
0.08 |
0.21 |
0.03 |
0.32 |
0.19 |
0.28 |
0.29 |
0.35 |
NA |
NA |
NA |
| CTD |
C |
0.30 |
0.19 |
0.25 |
0.06 |
0.27 |
0.01 |
0.13 |
NA |
NA |
NA |
NA |
NA |
NA |
NA |
NA |
NA |
NA |
NA |
NA |
|
T1 |
0.39 |
0.12 |
0.30 |
0.10 |
0.09 |
0.08 |
0.19 |
0.15 |
0.41 |
0.40 |
0.51* |
0.43 |
0.37 |
0.43 |
0.67** |
0.28 |
0.67** |
0.49 |
0.40 |
|
T2 |
0.70** |
0.28 |
0.32 |
0.13 |
0.17 |
0.30 |
0.10 |
0.27 |
0.50* |
0.50* |
0.50* |
0.50* |
0.32 |
0.51* |
0.14 |
0.65** |
NA |
NA |
NA |
| SC |
C |
0.08 |
0.12 |
0.09 |
0.00 |
0.07 |
0.20 |
0.03 |
NA |
NA |
NA |
NA |
NA |
NA |
NA |
NA |
NA |
NA |
NA |
NA |
|
T1 |
0.09 |
0.40 |
0.12 |
0.20 |
0.10 |
0.10 |
0.23 |
0.32 |
0.06 |
0.05 |
0.10 |
0.05 |
0.10 |
0.43 |
0.44 |
0.38 |
0.08 |
0.11 |
0.06 |
|
T2 |
0.07 |
0.19 |
0.10 |
0.16 |
0.10 |
0.12 |
0.09 |
0.41 |
0.16 |
0.02 |
0.07 |
0.12 |
0.08 |
0.37 |
0.38 |
0.39 |
NA |
NA |
NA |
| TN |
C |
0.20 |
0.50* |
0.32 |
0.25 |
0.24 |
0.20 |
0.30 |
NA |
NA |
NA |
NA |
NA |
NA |
NA |
NA |
NA |
NA |
NA |
NA |
|
T1 |
0.19 |
0.67** |
0.34 |
0.16 |
0.30 |
0.30 |
0.27 |
0.24 |
0.24 |
0.26 |
0.10 |
0.22 |
0.35 |
0.25 |
0.21 |
0.29 |
0.22 |
0.20 |
0.18 |
|
T2 |
0.28 |
0.55* |
0.31 |
0.33 |
0.30 |
0.31 |
0.23 |
0.25 |
0.24 |
0.28 |
0.30 |
0.21 |
0.35 |
0.14 |
0.32 |
0.30 |
NA |
NA |
NA |
| SL |
C |
0.33 |
0.35 |
0.27 |
0.18 |
0.28 |
0.33 |
0.19 |
NA |
NA |
NA |
NA |
NA |
NA |
NA |
NA |
NA |
NA |
NA |
NA |
|
T1 |
0.35 |
0.30 |
0.32 |
0.11 |
0.17 |
0.18 |
0.10 |
0.20 |
0.28 |
0.30 |
0.40 |
0.38 |
0.15 |
0.50* |
0.50* |
0.55* |
0.49* |
0.50* |
0.49* |
|
T2 |
0.30 |
0.24 |
0.34 |
0.22 |
0.20 |
0.08 |
0.07 |
0.32 |
0.17 |
0.15 |
0.20 |
0.30 |
−0.11 |
0.52* |
0.40 |
0.51* |
NA |
NA |
NA |
| NKPS |
C |
0.52* |
0.50* |
0.55* |
0.53* |
0.51* |
0.52* |
0.54* |
NA |
NA |
NA |
NA |
NA |
NA |
NA |
NA |
NA |
NA |
NA |
NA |
|
Drought |
0.61* |
0.63* |
0.62* |
0.62* |
0.60* |
0.65** |
0.59* |
0.63* |
0.58* |
0.66** |
0.63* |
0.63* |
0.62* |
0.84** |
0.79** |
0.66** |
0.68** |
0.69** |
0.67** |
| KW |
C |
0.32 |
0.13 |
0.06 |
0.12 |
0.22 |
0.30 |
0.33 |
NA |
NA |
NA |
NA |
NA |
NA |
NA |
NA |
NA |
NA |
NA |
NA |
|
Drought |
0.68** |
0.64** |
0.37 |
0.34 |
0.14 |
0.21 |
0.30 |
0.17 |
0.64** |
0.59* |
0.22 |
0.18 |
0.21 |
0.64** |
0.32 |
0.05 |
0.15 |
0.11 |
0.15 |
| TKW |
C |
−0.20 |
−0.17 |
−0.19 |
−0.23 |
−0.34 |
−0.35 |
−0.17 |
NA |
NA |
NA |
NA |
NA |
NA |
NA |
NA |
NA |
NA |
NA |
NA |
|
Drought |
0.56* |
0.72** |
0.33 |
0.41 |
0.32 |
0.23 |
0.43 |
0.44 |
0.64** |
0.53* |
0.20 |
0.13 |
0.10 |
0.67** |
0.16 |
0.26 |
0.29 |
0.25 |
0.17 |
a LRL, longest root length; TRB, total root biomass at maturity (g); RLB, root length biomass; CHL, chlorophyll in the flag leaf; NDVI, normalized difference vegetation index at grain filling; CTD, canopy temperature depression in the flag leaf; SC, stomatal conductance in the flag leaf; TN, tiller number; SL, spike length (cm); NKPS, number of kernel per spikes in Afghanistan field; KW, kernel weight (g/plant) in Afghanistan field; TKW, thousand kernel weight (g) in Afghanistan field and NA, not available.
* Correlation is significant at the 0.05 level (2-tailed).
** Correlation is significant at the 0.01 level (2-tailed).
The data from many yield traits were not available for T1 and T2 conditions in Japan, hence these relationships were presented only for the data from Afghanistan. The ranking of the top 3 LR genotypes based on yield performance was: LR-871 > 697 > 616. Significant associations were detected between all three root traits assessed at different depths in the whole root profile (0–100 cm) and the number of kernels per spikelet (NKPS) for MC, SR, MR and LR under control condition (r = 0.50–0.55). However, when grown under stress conditions, LR genotypes showed the strongest correlation compared with other groups, particularly at depths of 220–340 cm (r = 0.66–0.84) (Table 3). Kernel weight (KW) and thousand kernel weight (TKW) were not associated with any root traits assessed for MC, SR, MR and LR under control condition. Under stress conditions, while MC and SR only showed an association between KW/TKW and LRL, MR genotypes were associated with LRL, TRB and RLB at depths of 120–160 cm (Supplemental Table 5). LR genotypes showed a strong correlation compared with other groups, particularly with LRL (r = 0.56–0.68), TRB (r = 0.64–0.72) and RLB at depths of 120–160 cm (for KW, r = 0.59–0.64; for TKW, r = 0.53–0.64) and at depths of 220–240 cm (for KW, r = 0.64; for TKW, r = 0.67) (Table 3). Therefore, in general there is a positive and greater correlation between root biomass partitioning traits and above ground agronomic traits in the LR genotypes.
Discussion
Here we used a pre-breeding system and report root trait-based wheat materials for a rain-fed breeding program, using a firsthand collection of 360 KAWLR. Specific drought-adaptive root system ideotyping of a selected 30 KAWLR was determined, and this included the LR genotypes’ capacity for adjusting their root biomass partitioning in the deepest part of the soil profile in response to drought treatments T1 and T2. LR genotypes generally showed greater drought tolerance and a higher harvest index, where most of the agronomic traits were strongly correlated with root biomass deep in the soil profile.
A pre-breeding technology for root trait-based breeding material from KAWLR
In our previous report, we established a pre-breeding system for root trait-based breeding material isolation from KAWLR (Osmani et al. 2015 and Supplemental Fig. 2A). A merit of our pre-breeding system is that it simulates natural water movement throughout the soil gradient. When grown in our simulated drought conditions, considerable genetic variability was observed in the root traits of KAWLR germplasm and its subsets. Most of the LR in KAWLR attained rooting depth values that exceeded the 2 m pipe length (surprisingly, some roots were more than 3 m in length) (Figs. 3, 4). T1, and particularly T2 drought conditions, imposed severe stress on wheat cultivation. Out of the 360 KAWLR grown, only approximately 128 KAWLR were able to survive under T1 condition (Supplemental Table 1). In the SR group, 30–50% of the genotypes survived, whereas 70% survived in the MR group. Moreover, data from shoots, for example CL, leaf shape, SC, chlorophyll content, CTD, tiller number and spike length, highlighted deficiencies under T1 and T2 conditions that were apparent in the MC, SR and MR groups (data not shown). These results suggest that there is a good correlation between treatment intensity: i.e., control and dry pipes, and the resulting changes in the shoots of different genotypes. The depth of soil dryness generally affects seedling growth reduction under drought conditions, and selection programs for high shoot vigor or survivability may be associated with a deeper root system (Richards et al. 2007). Interestingly, LR genotypes showed various manifestations of this in their above ground traits; some were semi-dwarf (LR-871, -697, -616, -759), some were relatively tall (LR-702, -838) and remaining were in between them in response to drought treatment (Fig. 4), implying that the pre-breeding system we have used here may be able to identify LR system genotypes with a phenotypic plasticity that may confer a robustness to climate change. At the time of this writing, this type of pre-breeding system for rain-fed wheat cultivation is uncommon.
Characteristic root partitioning at greater soil depth, greater tolerance and relationship to above ground traits in LR genotypes
The most striking features of LR genotypes in response to drought were 100% survivability and the significant correlation between KW/TKW and root biomass at 120–160 cm/220–240 cm soil depths (Table 3). Increase in root biomass distribution below 60 cm soil depth in response to moisture deficit has been shown previously in landraces (Reynold et al. 2007), and was also observed in this study (Fig. 7). Although we did not assay the water extraction capacity, this would appear to be a significant drought adaptation of LR genotypes compared with other groups (Supplemental Fig. 2A, 2B). This probably explains their ability to extract more water from deeper in the soil (Reynold et al. 2007) and could be of potential benefit in improving crop water use. In general, 70% of the root volume is distributed in the top 30 cm of soil (Manske and Vlek 2002) but this is not sufficient to extract all the available water deep in the soil profile (Clarke and Townley-Smith 1984). Increased yield was due to greater partitioning of the root mass at greater soil depths and an increased ability to extract water, and not to an overall increase in dry root mass (Reynold et al. 2007). Reduction of direct evaporation from the soil surface through increased early ground cover is another indicator of increased water use (Richards et al. 2002). Most of the LR genotypes showed superior NDVI values at an earlier stage compared with other categories (Supplemental Fig. 6), and a non-significant, but greater, positive correlation at 220–280 cm (Table 3) indicating the potential for improving NDVI trait. Interestingly, coleoptile length, which positively correlates with rooting depth in dry regions (Narayanan et al. 2014), was significantly greater in LR genotypes compared with other categories when seeds were sown at a soil depth of 15 cm (data not shown). This implies that a long coleoptile allows seed to be sown at greater soil depths where moisture is available in dry areas (Schillinger et al. 1998), improving seedling vigor and stand establishment (Rebetzke et al. 2007). Therefore, both of these traits provide an adaptive advantage to genotypes grown in environments where soil moisture is limited. There was also variation and an increase in chlorophyll content among the LR KAWLR genotypes. The resulting increase in photo assimilates might be used to increase root biomass; however, chlorophyll content was also high in the MC, and sometimes also in the SR and MR, genotypes (Supplemental Tables 3–5).
Stomatal aperture traits, which can be assessed non-destructively (e.g., CTD, SC or carbon isotope discrimination) can be measured quickly and effectively in shoot tissue, and used as indirect measures of root depth and water use (Richards et al. 2008). In the present research, CTD showed a correlation with depths of 140–160 cm (r = 0.52/0.54) and SC with depths of 160–180 cm (r = 0.52/0.54) in LR genotypes under T1 and T2 conditions (Table 3). This result is supported by a previous report (Reynold et al. 2007). It is clear that the LR genotypes with higher root values could capture and transpire more moisture, resulting in cooler canopies and perhaps greater WUE. However, some of the LR KAWLR that had greater root partitioning (or water absorption) at depth also had low SC compared to MC (data not shown). In drier soil, the roots send chemical signals to the leaves to reduce transpiration, decreasing growth rate and increasing WUE (Reynolds et al. 2005).
Overall, a stronger positive correlation was observed between SL and NKPS traits, and root biomass partitioning in LR genotypes, compared with other root categories under dry conditions (and compared with all categories under control conditions) (Supplemental Tables 3–5, Table 3). This may lead to a stronger association of KW and TKW with root partitioning at greater soil depth, as observed for LR KAWLR. There was also variation and a positive correlation for TN with TRB, but not with root biomass partitioning in LR KAWLR. However, a high TN was also evident in the other categories under drought as well as control conditions. Grain-filling rate, which is related to TKW, is reportedly influenced by water availability and WUE, respectively (Richards et al. 2002). Greater coleoptile length correlated with seed size (Botwright et al. 2001, Cornish and Hindmarsh 1998, Nik et al. 2011), and root biomass partitioning reportedly improves grain yield and harvest index (Atta et al. 2013, White and Wilson 2006). Even though mean PH did not vary much among LR genotypes, a moderately shorter (semi-long) PH compared with other LR genotypes was observed in response to dry soil in Japan (65–75 cm) (Figs. 3, 4) and Afghanistan (80–90 cm) (data not shown) in some LR genotypes (such as LR871, LR697 and LR616) that had greater root partitioning (or water absorption) at depth (Fig. 7). This might be related to Rht genes and a greater harvest index (Passioura 1977). Furthermore, coleoptile length, which is positively correlated with rooting depth in LR KAWLR, was associated with increased grain yield in LR genotypes in our yield trial in the dry region of Afghanistan (data not shown) and in previous reports (Rebetzke et al. 2007).
This research found that the geographic regions from which wheat genotypes originated had a significant impact on rooting depth. Out of eight agro-ecological zones in Afghanistan (Supplemental Fig. 1), A–D which have relatively drier weather were reported as a rain-fed pre-dominant region (USDA; http://www.pecad.fas.usda.gov/highlights/2009/06/afghanistan/). In our genetic clade-based (Manickavelu et al. 2014) geographical distribution analysis, LR genotypes dominated clades II, III, VI and XIII seemed to be distributed on regions A–D with a frequency increasing tendency from west to north (Supplemental Table 1, Fig. 8). This coincides with the data that suggest LR genotypes have the greatest potential to grow and extend their root systems, up to 300 cm (Figs. 3, 4, 6, 7), and also that they show a good correlation between root biomass and above ground traits, including KW and TKW (Table 3). Maximal utilization of stored soil moisture is important for dry environments, including the predominantly rain-fed northern region of Afghanistan, as previously reported for other rain-fed/dry regions worldwide (Manschadi et al. 2008). Plant root systems in these regions are adapted to thrive on the available soil moisture, and not deplete it before maturity (Blum 2005). Thus, wheat genotypes that evolved in these drier areas have adapted by increasing their rooting depth to capture water from deeper in the soil. Such characteristics may be associated with a general trend towards decreasing precipitation and increasing temperature from southern to northern Afghanistan.

In addition, this research also found that growth habit has a significant influence on root biomass partitioning and grain yield in wheat. Of the three genotypes with the best performance, two are winter-type wheat (Supplemental Fig. 1, Supplemental Table 1, Stanikzai et al. 2015). This result is consistent with previous reports (Schillinger et al. 1998, White and Wilson 2006) and the notion that the simplest way to increase root depth and distribution is to increase the duration of the vegetative period by sowing earlier or by planting later-flowering genotypes (Richards et al. 2001), a characteristic of winter wheat.
The current pre-breeding technology was able to identify the landraces from LR KAWLR that have a good root system, which is related to drought tolerance late in development, i.e., harvest. The data presented in this study indicate a physiological mechanism/response of LR KAWLR to moisture deficit in terms of changes in root partitioning that might reflect an increased ability to take up water from a greater depth, and thereby might confer a higher WUE. The LRs were strongly associated with agronomic and yield traits where LR-871, -697 and -616 showed the best performance. This study also showed the potential of the KAWLR collected by Dr. Kihara to assist in the Afghan wheat breeding program. Given the generally acceptable agronomic and favorable drought-adaptive characteristics of the selected lines, this is a positive approach. The robustness of plant germplasm identified in this research as phenotypic plasticity among the landraces may be exploited to improve adaptation and/or resource capture in wheat to be suffered from repeated historical climate change. Three LR genotypes, including the longest root genotype LR-871 (KU7604), are recommended for rain-fed wheat breeding in Afghanistan. These selected landraces have already been employed in a crossing program with sources of resistance to diseases, such as crown rot and leaf rust.
Acknowledgments
We acknowledge Dr. H. Tsuji, Dr. A. Manickavelu, Dr. B. Behnam and Dr. M. Osmanzai for their helpful comments. This work was supported by a Grant-in-Aid from the SATRPES Afghan Wheat project ‘Project for the Development of Wheat Breeding Materials for Sustainable Food Production in Afghanistan’ funded by the Japan Science and Technology Agency and the Japan International Co-operation Agency.
Literature Cited
- Afghanistan Statistical Yearbook (2010–11) http://cso.gov.af/Content/files/Agricalture.pdf.
- Atta, B.M., T. Mahmood and R.A. Trethowan (2013) Relationship between root morphology and grain yield of wheat in north-western NSW, Australia. Aust. J. Crop Sci. 13: 2108–2115.
- Beekma, J. and J. Fiddes (2011) “Floods and droughts: The Afghan water paradox”, Center for Policy and Human Development (CPHD).
- Blum, A. (2005) Drought resistance, water-use efficiency, and yield potential—are they compatible, dissonant, or mutually exclusive? Aust. J. Agric. Res. 56: 1159–1168.
- Botwright, T.L., G.J. Rebetzke, A.G. Condon and R.A. Richards (2001) Influence of variety, seed position and seed source on screening for coleoptile length in bread wheat (Triticum aestivum L.). Euphytica 119: 349–356.
- Clarke, J.M. and T.F. Townley-Smith (1984) Screening and selection techniques for improving drought resistance. In: Vose, P.B. and S.G. Blixt (eds.) Crop Beeding: A Contemporary Basis, Pergamon, Oxford UK, pp. 137–162.
- Cornish, P. and S. Hindmarsh (1988) Seed size influences the coleoptile length of wheat. Aust. J. Exp. Agric. 28: 521–524.
- Dardanelli, J.L., J.T. Ritchie, M. Calmon, J.M. Andriani and D.J. Collino (2004) An empirical model for root water uptake. Field Crops Res. 87: 59–71.
- Dennis, J., A. Diab and P. Trutmann (2002) The Planning of Emergency Seed Supply for Afghanistan in 2002 and Beyond: a draft concept paper prepared for the Tashkent Conference. Tashkent, 20–21 January, 2002. pp. 1–48.
- FAO (1972) Soil bulletin 21-Calcareous soil. Country reports, Afghanistan.
- Kamoshita, A., L.J. Wade, M.L. Ali, M.S. Pathan, J. Zhang, S. Sarkarung and H.T. Nguyen (2002) Mapping QTLs for root morphology of a rice population adapted to rainfed lowland conditions. Theor. Appl. Genet. 104: 880–893.
- Kihara, H., K. Yamashita and M. Tanaka (1965) Morphological, physiological and cytological studies in Aegilops and Triticum collected from Pakistan, Afghanistan and Iran. In: Yamashita, K. (ed.) Cultivated plants and their relatives (results of the Kyoto University Scientific Expedition to the Karakoram and Hindukush, 1955), the committee of the Kyoto University Scientific Expedition to the Karakoram and Hindukush, Kyoto University, Kyoto, Japan. Vol. 1: 1–140.
- Lopes, M.S., I. El-Basyoni, P.S. Baenziger, S. Singh, C. Royo, K. Ozbek, H. Aktas, E. Ozer, F. Ozdemir, A. Manickavelu et al. (2015) Exploiting genetic diversity from landraces in wheat breeding for adaptation to climate change. J. Exp. Bot. 66: 3477–3486.
- Ludlow, M.M. and R.C. Muchow (1990) A critical evaluation of traits for improving crop yields in water-limited environments. Adv. Agron. 43: 107–153.
- Manickavelu, A., T. Ban, H. Tsujimoto, M. Matsui and Y. Kondo (2013) Strategic plan and approaches for Afghanistan wheat improvement under SATREPS. Wheat Inf. Serv. 116: 9–11.
- Manickavelu, A., A. Jigly and T. Ban (2014) Molecular evaluation of orphan Afghan common wheat (Triticum aestivum L.) landraces collected by Dr. Kihara using single nucleotide polymorphic markers. BMC Plant Biol. 14: 320.
- Manschadi, A.M., G.L. Hammer, J.T. Christopher and P. deVoil (2008) Genotypic variation in seedling root architectural traits and implications for drought adaptation in wheat (Triticum aestivum L.). Plant Soil 303: 115–129.
- Manske, G.G.B. and P.L.G. Vlek (2002) Root architecture—wheat as a model plant. In: Waisel, Y., A. Eshel and U. Kafkafi (eds.) Plant Roots: The Hidden Half, 3rd edition, Marcel Dekker, New York USA, pp. 149–259.
- Narayanan, S., A. Mohan, S. Kulvinder, P.V. Gill and V. Prasad (2014) Variability of root traits in spring wheat germplasm. PLoS ONE 9: e100317.
- Nik, M.M., M. Babaeian and A. Tavassoli (2011) Effect of seed size and genotype on germination characteristic and seed nutrient content of wheat. Sci. Res. Essays. 6: 2019–2025.
- Osmani, A.A., S.H. Ahmadi, H. Haque, A. Manickavelu, H. Tsuji and T. Ban (2015) Study of root length system of Afghan wheat landraces in response to drought condition. Wheat Inf. Serv. 120: http://www.shigen.nig.ac.jp/ewis/article/html/165/article.html
- Pearson, K. (1895) Note on regression and inheritance in the case of two parents. Proc. R. Soc. Lond. 58: 240–242.
- Ray, D.K., N.D. Mueller, P.C. West and J.A. Foley (2013) Yield trends are insufficient to double global crop production by 2050. PLoS ONE 8: e66428.
- Rebetzke, G.J., R.A. Richards, N.A. Fettell, M. Long, A.G. Condon, R.I. Forrestera and T.L. Botwright (2007) Genotypic increases in coleoptile length improves stand establishment, vigour and grain yield of deep-sown wheat. Field Crops Res. 100: 10–23.
- Reynolds, M.P., M.A. Kazi and M. Sawkins (2005) Prospects for utilising plant-adaptive mechanisms to improve wheat and other crops in drought- and salinity-prone environments. Ann. Appl. Biol. 146: 239–259.
- Reynolds, M., F. Dreccer and R. Trethowan (2007) Drought-adaptive traits derived from wheat wild relatives and landraces. J. Exp. Bot. 58: 177–186.
- Richards, R.A. (1991) Crop improvement for temperate Australia: Future opportunities. Field Crops Res. 26: 141–169.
- Richards, R.A., A.G. Condon and G.J. Rebetzke (2001) Traits to improve yield in dry environments. In: Reynolds, M.P., J.I. Ortiz-Monasterio and A. McNab (eds.) Application of physiology in wheat breeding, Mexico, D.F., CIMMYT, pp. 88–100.
- Richards, R.A., G.J. Rebetzke, A.G. Condon and A.F. van Herwaarden (2002) Breeding opportunities for increasing the efficiency of water use and crop yield in temperate cereals. Crop Sci. 42: 111–121.
- Richards, R.A., M. Watt and G.J. Rebetzke (2007) Physiological traits and cereal germplasm for sustainable agricultural systems. Euphytica 154: 409–425.
- Richards, R.A., G.J. Rebetzke, A.G. Condon, M. Watt, W. Spielmeyer, M.H. Ellis, D.G. Bonnett and R. Dolferus (2008) Genetic improvement of wheat for dry environments—a trait based approach. In: Appels, R., R. Eastwood, E. Lagudah, P. Langridge, M. Mackay, M. McIntyre and P. Sharp (eds.) Proceedings of the 11th International Wheat Genetics Symposium, 24–29 August, Brisbane, Australia, pp. 1–6.
- Schillinger, W.F., E. Donaldson, R.E. Allan and S.S. Jones (1998) Winter wheat seedling emergence from deep sowing depths. Agron. J. 90: 582–586.
- Sinclair, T.R. (1994) Limits to crop yield? In: Boote, K.J., J.M. Bennett, T.R. Sinclair and G.M. Paulsen (eds.) Physiology and determination of crop yield, American Society of Agronomy, Madison USA, pp. 509–532.
- Sohail, Q., A. Manickavelu and T. Ban (2015) Genetic diversity analysis of Afghan wheat landraces (Triticum aestivum) using DArT markers. Genet. Resour. Crop. Evol. 62: 1147–1157.
- Stanikzai, A.S., T. Ban and A. Manickavelu (2015) Growth habit nature of Afghan wheat landraces collected by Late Dr. Kihara et al. Wheat Inf. Serv. 120: 20–25.
- Terasawa, Y., K. Takata, T. Kawahara, T. Ban, T. Sasakuma and T. Sasanuma (2008) Genetic variation of wheat landraces in Afghanistan. In: Appels, R., R. Eastwood, E. Lagudah, P. Langridge, M. Mackay, M. McIntyre and P. Sharp (eds.) Proceedings of the 11th International Wheat Genetics Symposium, 24–29 August, Brisbane, Australia, pp. 316.
- Turner, N.C., G.C. Wright and K.H.H. Siddique (2001) Adaptation of grain legumes (pulses) to water-limited environments. In: Sparks, D.L. (ed.) Advances in Agronomy, 71: 193–231.
- Uga, Y., K. Sugimoto, S. Ogawa, J. Rane, M. Ishitani, N. Hara, Y. Kitomi, Y. Inukai, K. Ono, N. Kanno et al. (2013) Control of root system architecture by DEEPER ROOTING 1 increases rice yield under drought conditions. Nat. Genet. 45: 1097–1102.
- Wasson, A.P., R.A. Richards, R. Chatrath, S.C. Misra, S.V. Prasad, G.J. Rebetzke, J.A. Kirkegaard, J. Christopher and M. Watt (2012) Traits and selection strategies to improve root systems and water uptake in water-limited wheat crops. J. Exp. Bot. 63: 3485–3498.
- White, E.M. and F.E.A. Wilson (2006) Responses of grain yield, biomass and harvest index and their rates of genetic progress to nitrogen availability in ten winter wheat varieties. Irish J. Agr. Food Res. 45: 85–101.