Abstract
A strawberry Multi-parent Advanced Generation Intercrosses (MAGIC) population, derived from crosses using six strawberry cultivars was successfully developed. The population was composed of 338 individuals; genome conformation was evaluated by expressed sequence tag-derived simple short repeat (EST-SSR) markers. Cluster analysis and principal component analysis (PCA) based on EST-SSR marker polymorphisms revealed that the MAGIC population was a mosaic of the six founder cultivars and covered the genomic regions of the six founders evenly. Fruit quality related traits, including days to flowering (DTF), fruit weight (FW), fruit firmness (FF), fruit color (FC), soluble solid content (SC), and titratable acidity (TA), of the MAGIC population were evaluated over two years. All traits showed normal transgressive segregation beyond the founder cultivars and most traits, except for DTF, distributed normally. FC exhibited the highest correlation coefficient overall and was distributed normally regardless of differences in DTF, FW, FF, SC, and TA. These facts were supported by PCA using fruit quality related values as explanatory variables, suggesting that major genetic factors, which are not influenced by fluctuations in other fruit traits, could control the distribution of FC. This MAGIC population is a promising resource for genome-wide association studies and genomic selection for efficient strawberry breeding.
Introduction
Cultivated strawberry (Fragaria × ananassa) is an important fruit species worldwide. Many strawberry breeders are using different crossing types in an attempt to improve the agronomic traits of cultivated strawberry, such as yield performance, resistance to diseases, skin color, firmness, etc. To develop new strawberry cultivars efficiently, a comprehensive understanding of the correlations among these important agronomic traits is important. Morishita (1994) analyzed the relationships among 14 agronomic traits in 161 strawberry cultivars from Japan, USA, Canada, UK, Denmark, the Netherlands, and Sweden. Zorrilla-Fontanesi et al. (2011) developed an F1 full-sib family of 95 F1 individuals derived from an intraspecific cross between 232 (Sel. 4-43 9 Vilanova) and 1392 (Gaviota 9 Cam-arosa) and studied the relationships among six agronomic and 11 fruit-quality traits. Lerceteau-Köhler et al. (2012) developed F1 progeny from a cross between the variety Capitola and the genotype CF1116 and revealed the relationships of 19 fruit traits.
Although these studies have provided important information for selection, each used propagated clone seedlings, not individual populations from crossed seeds. When breeding for new cultivars in practice, strawberry breeders must select individual plants from crossed seeds efficiently using a method that can predict the performance of these propagated seedlings. A means of comparing the agronomic traits of individual plants and propagated seedlings is, therefore, required.
DNA markers related to agronomic traits are useful for strawberry breeding. Cultivated strawberry has an octoploid genome (2n = 8x = 56) and its genome conformation is complicated because of the similarity of regions of homoeologous chromosomes. This complexity leads to difficulties in genome analysis and the development of specific DNA markers tightly linked to specific agronomic traits. Recently, however, information on strawberry genetics has begun to accumulate more quickly. James et al. (2003) and Hadonou et al. (2004) developed polymorphic microsatellite primer pairs in wild strawberry (F. vesca ‘Reugen’) while Sargent et al. (2004) developed 76 microsatellite markers derived from the cross F. vesca f. semperflorens × F. nubicola. Kunihisa et al. (2009) proposed 25 cleaved amplified polymorphic sequence markers that are useful for the discrimination of 117 strawberry cultivars. Shulaev et al. (2011) provided the genome sequence of a wild diploid relative of the cultivated strawberry, F. vesca ‘Hawaii 4’ and microsatellite linkage maps have been independently developed by both Sargent et al. (2012) and Isobe et al. (2013). Furthermore, Hirakawa et al. (2014) successfully revealed the subgenomic structure of F. × ananassa and have compared it to other Fragaria species. These sequence and marker studies have provided useful information not only for wild strawberries, but also for cultivated strawberry breeding.
To analyze the relationships among different agronomic traits and characterize the genomic regions responsible for specific traits, wide variations of the traits in a population are preferable. New cultivars and conventional genetic populations are usually derived from bi-parental crossing and subsequent selection, and the phenotypic and genetic variation of the progeny is usually limited to the combined range of the relevant parents.
Recently, The Complex Trait Consortium (Churchill et al. 2004) introduced the concept of a multi-parental advanced generation intercross (MAGIC) population using mice. Huang et al. (2015) demonstrated that a MAGIC population more clearly illustrated the fine-scale mosaics of founder parental genomes and wider genetic and phenotypic variation than populations derived from bi-parental crossing. In plants, MAGIC populations of rice (Bandillo et al. 2013), wheat (Cavanagh et al. 2008, Huang et al. 2012, Rebetzke et al. 2014), maize (dos Santos et al. 2016, Zhao et al. 2012), barley (Sannemann et al. 2015), and tomato (Pascual et al. 2015) have been developed. Using these lines, fine analyses of trait interactions and QTL analyses using genome-wide association studies (GWAS) have been performed to detect various QTLs for agronomic traits.
The objective of the present study was to develop a MAGIC population of cultivated strawberry to analyze the relationships among various important agronomic traits and to establish an efficient breeding program for strawberry.
Materials and Methods
Plant materials
The strategy for the development of a strawberry MAGIC population is shown in Fig. 1. Six strawberry (F. × ananassa) cultivars, Fukuoka S6 (trade name Amaou, Mitsui et al. 2003), Kaorino (Kitamura et al. 2015), Sachinoka (Morishita et al. 1997), 06A-184 (Fukuoka S6 × Sanchiigo, Mori et al. 2000), Beni hoppe (Takeuchi et al. 1999), and Ookimi (Okimura 2010) were used as founder parental lines. Selection of founder parents was primarily based on the genetic dissimilarity analysis of Isobe et al. (2013) and phenotypic variance, which is provided in Table 1. The six founder cultivars exhibited wide variations in numerous major agronomic traits, including flowering habit (days to flowering after transplanting, DTF), fruit weight (FW), fruit skin color (FC), fruit firmness (FF), soluble solid content (SC), and titratable acid (TA). Three types of F1 progeny were developed in 2011 using the six cultivars described; F1A, F1B, and F1C progeny were derived from crosses between Fukuoka S6 × Kaorino, Sachinoka × 06A-184, and Beni hoppe × Ookimi, respectively. Eight F1 progeny from each cross were used for genotyping with genome-wide expressed sequence tag-derived simple short repeat (EST-SSR) markers (Isobe et al. 2013). Four of the eight F1 progeny were selected for further advanced intercrossing by prioritizing primarily rare allele frequencies and secondarily the genetic diversity of each SSR marker according to their heterozygote values (Isobe et al. 2013). The 1st generation intercross (IC1) populations were obtained in 2012 using the following method; four F1A plants were emasculated and used as female parents, four F1B and four F1C plants were used as male parents; the crossing of F1A × F1B plants was conducted with mixed pollen of four F1B plants, and the crossing of F1A × F1C plants was conducted with mixed pollen of four F1C plants. Additionally, two other crosses, F1B × (F1A, F1C) and F1C × (F1A, F1B), were also accomplished. A total of 240 IC1 plants derived from the six crosses (ten IC1 plants from each F1 female plant) were used for development of the 2nd generation inter-cross (IC2) populations in 2013. From the IC1 populations, 48 plants (16 plants from each F1 cross) were selected with the same EST-SSR markers used in the F1 selection. The IC2 populations were developed from the mutual crossing of all 48 IC1 plants; the pollen of all 48 IC1 plants were collected and mixed before being applied to the pistils of all 48 emasculated IC1 plants to obtain 1,060 IC2 plants. Finally, 338 IC2 plants were selected almost evenly from each IC1 progeny, with a maximum of 10 derived from one IC1 plant, based on plant performance in the greenhouse. These plants represented the strawberry MAGIC population that was further examined in this study.

Table 1
Agronomic traits of the six founder parental lines of the strawberry MAGIC population
| Cultivar name |
Fukuoka S6 |
Kaorino |
Sachinoka |
06A-184 |
Beni hoppe |
Ookimi |
| Days to flowering |
slightly late |
early |
late |
slightly early |
slightly early |
late |
| Fruit weight |
large |
medium |
medium |
large |
large |
large |
| Fruit skin color |
dark red |
orange red |
dark red |
red |
red |
orange red |
| Fruit firmness |
soft |
soft |
hard |
soft |
medium |
hard |
| Soluble solid content |
high |
low |
high |
low |
high |
high |
| Acidity |
high |
low |
slightly high |
low |
medium |
medium |
Genotyping was performed using a set of 105 EST-SSR markers (Supplemental Table 1) for the F1 and IC1 populations during the development of the MAGIC population; the developed MAGIC population, which was composed of 338 IC2 plants, was also genotyped with a set of 336 EST-SSR markers (Supplemental Table 2) that were polymorphic among the six founder parental cultivars. The 105 EST-SSR markers, which were used for genotyping the F1 and IC1 populations, were selected while focusing on the equal distribution of the strawberry linkage groups (Isobe et al. 2013); the average marker density was 15 markers per chromosome in F. vesca. Genomic DNA of F1 and IC1 was extracted from young leaves of each plant with a DNeasy plant mini kit (Qiagen, Valencia, CA, USA); genomic DNA of IC2 was extracted using a Mag extractor (Toyobo, Osaka, Japan). PCR was performed in a 5-μL reaction volume using 0.6 ng of genomic DNA in 1× PCR buffer (Bioline, London, UK), 3 mM MgCl2, 0.08 U of BIOTAQ DNA polymerase (Bioline), 0.8 mM dNTPs, and 0.4 mM of each primer. The PCR products were separated with an ABI 3730xl fluorescent fragment analyzer (Applied Biosystems, MA, USA), according to the polymorphic fragment sizes of the PCR amplicons. Polymorphisms were investigated using the Gene Marker software (Softgenetics, PA, USA), based on the presence and absence of the relevant peak.
Insight for genomic conformation of the MAGIC population
To confirm that the developed MAGIC population harbored the genomic conformation of the six founder cultivars equally without any bias, the genetic similarity of the MAGIC population and the six founder cultivars was evaluated using allele data from all SSR markers. In this analysis, the allelic data were converted into a binary matrix using scores 1 or 0 for the presence or absence of a peak.
1) Cluster analysis
The allelic binary data were analyzed using GGT 2.0 (van Berloo et al. 2008) to investigate the genetic similarity of the individuals in the MAGIC population and the six founder cultivars using a Jaccard similarity coefficient. An unweighted pair group method (UPGMA) with arithmetic average dendrogram was constructed using MEGA version 6.0 (Tamura et al. 2013).
2) Principal component analysis
Principal component analysis (PCA) was performed using software R version 3.2.3 (R Core Team, 2015-12-10). In this analysis, allelic binary data were used as explanatory variables. The proportion of variance and eigenvector values of each principal component were used to evaluate the structure of the MAGIC population.
Trait evaluation
Fruit quality related traits, such as DTF, FW, FF, FC, SC, TA, and the anthocyanin content of the pericarp (AN_P) and flesh (AN_F) of individual plants from crossed seeds and propagated clones of the MAGIC population were evaluated during the 2013–2014 season (later designated 2013) and the 2014–2015 season (2014). Measurement of anthocyanin content was conducted only in 2014. The crossed seeds of the IC2 generation were sown on July 5, 2013, on nursery soil commonly used for vegetable seeds (Takii Seed, Kyoto, Japan). Germinated plants were moved to nursery pots (9 cm diameter) containing strawberry nursery soil (Seishin Industry, Fukuoka, Japan) for subsequent growth. Transplanting was performed on September 25 and harvesting began when each plant reached maturity. The amount of applied basal fertilizer was 5:3.8:1.9 g/m2 (N:P2O5:K2O), and additional fertilizer was applied at a rate of 10:11.8:11.3 g/m2 (N:P2O5:K2O) on October 20, approximately 30 days after transplantation. Watering and weed growth control were done as necessary, and there was no artificial lighting during the night. The flowering stage was defined as beginning with the opening of the first flower of the primary branch. Subsequent fruit quality traits were measured using fruit from the primary branch of each plant just after harvesting at maturity. The first fruit of the primary branch was excluded because it tended to develop an abnormal shape because of nutritional unbalance. Five fruits (the second, third, fourth, fifth, and sixth fruit) of the primary branch were used to measure FW and FC. FC was measured with a CM-d600 spectrophotometer (Konica Minolta, Tokyo, Japan) on the surface that received sunlight. Fruit skin color was expressed as L* × b*/a*, the measured raw values (L*: lightness, a*: color channel from green to red, b*: color channel from blue to yellow) of the spectrophotometer. Three fruits (the second, third, and fourth) of the primary branch were also used to measure FF, SC, and AC. FF was measured with a rheology analyzer, the creep meter RE2-3305B (Yamaden, Tokyo, Japan), using a 2.0 mm diameter stainless steel plunger at a speed of 1.7 mm/s. The penetration depth of the plunger was maintained at 40% of the total fruit thickness. SC was measured with an RA410 Brix meter (Kyoto Electronics Manufacturing, Kyoto, Japan). TA was measured with Coulometric acidity meter CAM500 (Kyoto Electronics Manufacturing).
Propagation of the clones from each line of the MAGIC population started in May 2014, with propagated clones grown according the same method as described for 2013. Transplantation was conducted on September 26, 2014. Plant cultivation and subsequent fruit quality related traits were measured as described for 2013. Additionally, in 2014, two fruits (the fifth and sixth fruit of the primary branch) of each line were used for the measurement of anthocyanin content. Approximately 100–150 mg of fruit skin and flesh were removed separately from raw fruit, weighed, frozen, and crushed with zirconia beads (5-mm diameter) using an MM300 Tissue Lyser (Qiagen). Anthocyanin was extracted using a 1% formic acid/methanol solution. The extracted anthocyanin solution was separated with an UltiMate 3000 high-performance liquid chromatograph (Thermo Fisher Scientific, Waltham, MA, USA) to detect four anthocyanin fractions, including cyanidin 3-glucoside (CG), pelargonidin 3-glucoside (PG), cyanidin 3-malonylglucoside (CM), and pelargonidin 3-malonylglucoside (PM). The peak area of each fraction was converted to the concentration of each anthocyanin per 1 g fresh weight of strawberry fruit.
Analysis of the relationships of fruit quality traits
The correlation coefficients between fruit quality traits were calculated in 2013 and 2014. Similarly, correlation coefficients of all traits across both 2013 and 2014 were also calculated. To characterize the fruit quality traits of the MAGIC population, PCA was conducted with all trait values as explanatory variables using R software version 3.2.3 (R Core Team).
Results
Diversity and genetic variation of the strawberry MAGIC population
In total, 336 EST-SSR markers were polymorphic among the six founder cultivars and 1,270 polymorphic loci were detected. We performed cluster analysis using the UPGMA method with the allelic binary data of the EST-SSR markers to evaluate the genetic diversity of the MAGIC population. Fig. 2 shows a dendrogram from this cluster analysis. The six founder cultivars were distributed almost evenly in the dendrogram, although Sachinoka and Beni hoppe were closer to each other. Table 2 shows the eigenvalue, proportion of variance, cumulative proportion, and eigenvector of ten major principal components derived from the PCA. Although the proportion of variance of PC1 was more than 0.2 (0.235 or 23.5% of total variance), the eigenvector absolute values were extremely low (0.068 and 0.089). Furthermore, the proportion of variance and eigenvectors of the other principal components (from PC2 to PC10) were less than 0.1.
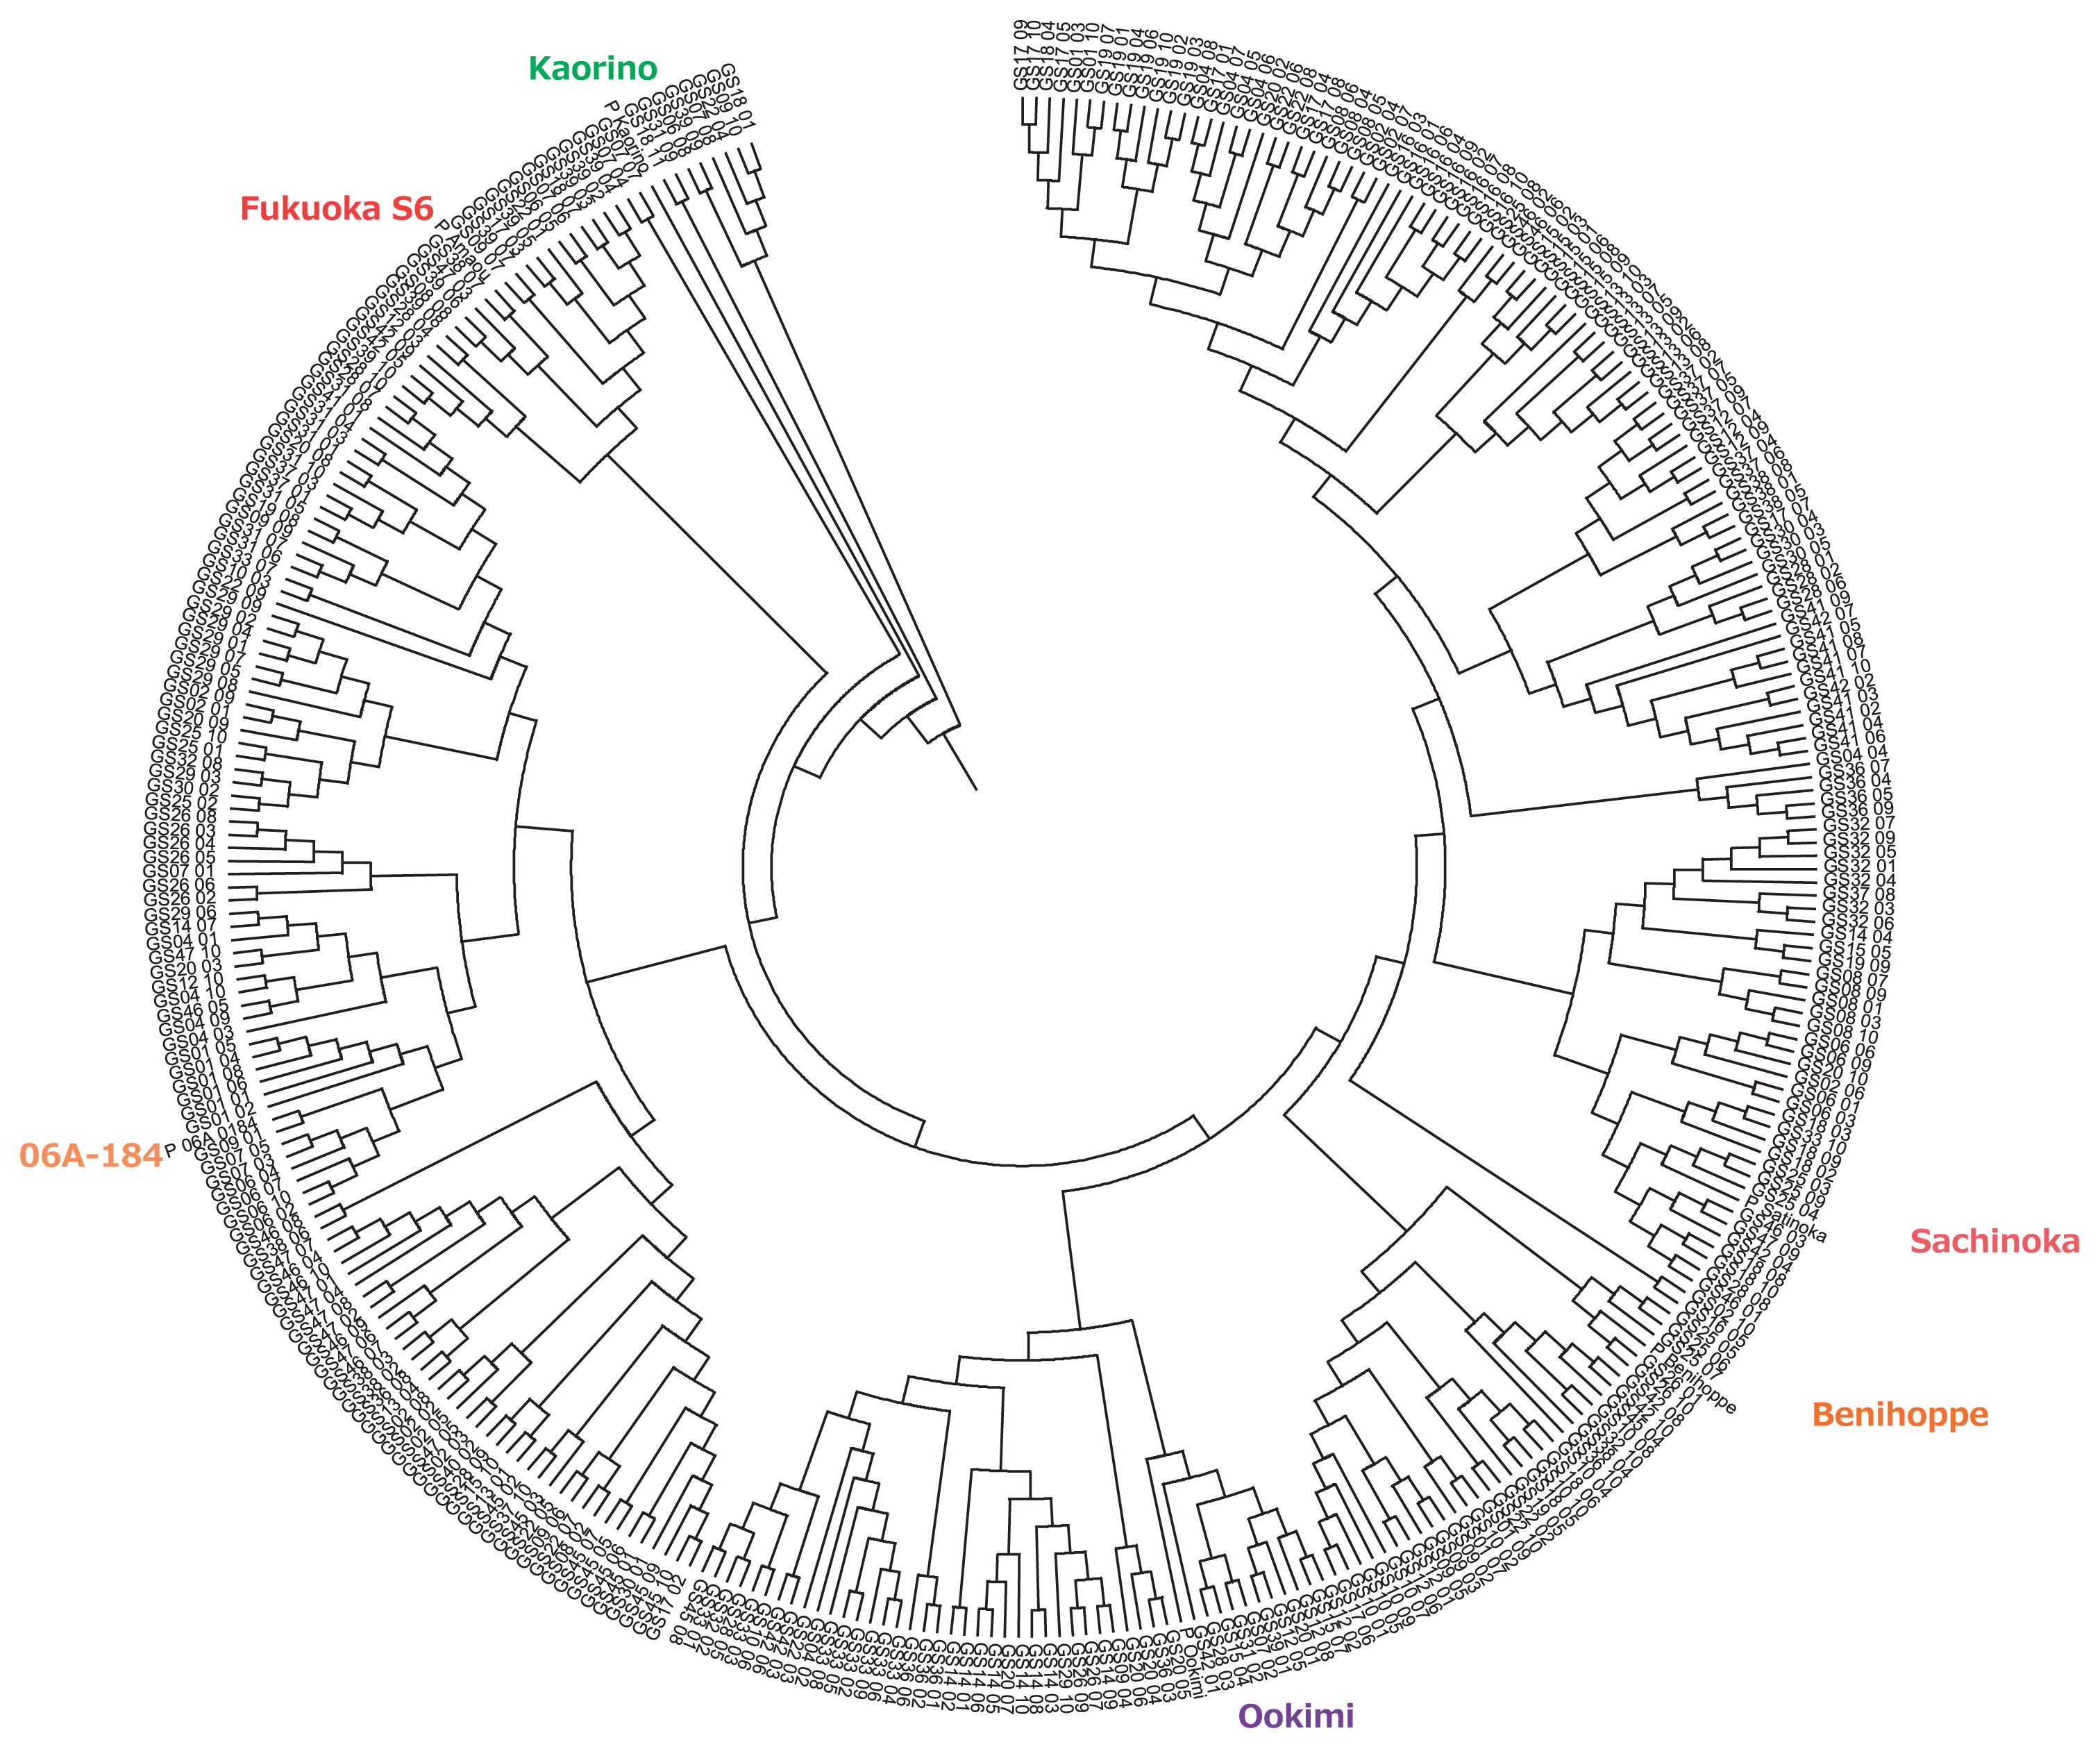
Table 2
Eigenvector value, proportion of varience, cumulative proportion, and eigen vactor of PCA analysis based on the SSR marker allele types of the strawberry MAGIC population
| Principal component |
PC1 |
PC2 |
PC3 |
PC4 |
PC5 |
PC6 |
PC7 |
PC8 |
PC9 |
PC10 |
| Eigen values |
2.852 |
1.114 |
0.704 |
0.562 |
0.496 |
0.434 |
0.351 |
0.326 |
0.319 |
0.263 |
| Proportion of variance |
0.235 |
0.092 |
0.058 |
0.046 |
0.041 |
0.036 |
0.029 |
0.027 |
0.026 |
0.022 |
| Cumulative proportion |
0.235 |
0.326 |
0.384 |
0.430 |
0.471 |
0.507 |
0.535 |
0.562 |
0.589 |
0.610 |
| Eigen vector |
max. |
0.068 |
0.082 |
0.083 |
0.092 |
0.082 |
0.082 |
0.087 |
0.108 |
0.095 |
0.074 |
| min. |
−0.089 |
−0.092 |
−0.082 |
−0.096 |
−0.089 |
−0.096 |
−0.082 |
−0.085 |
−0.086 |
−0.084 |
Number of SSR markers and their loci were 336 and 1270, respectivlely. Each SSR marker allele type, ‘0’, which means no signla of the relevant marker loci, and ‘1’, which means detecting signal with certain intensity, were used as explanatory variables for PCA.
Fig. 3 shows the distribution of fruit quality related traits, such as DTF, FW, FC, FF, SC, TA, AN_P, and AN_F. The MAGIC population showed transgressive distribution of all traits. Furthermore, the fruit quality related traits also exhibited normal distributions, except for DTF in both years, and TA and AN_F in 2014. For DTF, some of the plants among the MAGIC population in 2013 had late flowering (more than 100 days after transplanting). Although propagated clones tended to flower earlier than individual plants derived from crossed seeds, both populations showed a bimodal distribution. TA and AN_F exhibited geometric distribution patterns. In FF, SC, and TA, the distribution pattern in 2013 was different from that of 2014; a histogram of FF in 2014 shifted towards harder fruit than in 2013, and a histogram of SC and TA in 2014 similarly shifted higher than in 2013. Table 3 shows the correlation coefficients among all traits in 2013 and 2014. DTF was positively correlated with FW, but negatively correlated with SC and TA. FW was also negatively correlated with SC and TA. Consequently, SC and TA were highly positively correlated with each other. The correlation coefficients of FC with other traits were relatively low, as compared to those with other traits. Correlation coefficients between the same traits over two years were 0.234** (DTF), 0.487** (FW), 0.558** (FF), 0.611** (FC), 0.259** (SC), and 0.547** (TA). The highest correlation coefficient between years was detected for FC and the second highest for FF. Fig. 4 shows the distribution of FC for the MAGIC population in both years. Fukuoka S6 and Sachinoka had the darkest and second darkest coloration, respectively. Conversely, Kaorino and Ookimi had the lightest coloration. Additionally, both the founder cultivars and the MAGIC population showed similar distributions in FC in both years. Anthocyanin content of the founder cultivars of the MAGIC population is provided in Table 4. Fukuoka S6 had the highest anthocyanin content in the pericarp (2424.9 μg/g fresh weight) and 06A-184 had the highest content in the flesh (320.9). Kaorino had the lowest anthocyanin content in both organs (737.4 in pericarp and 4.8 in flesh), whereas Ookimi had the second lowest (887.7 and 18.0). These differences in anthocyanin in the founder cultivars agreed with their fruit pericarp colors (Fig. 4). Of the four types of anthocyanin, PG was the major component of both the pericarp (76.6–95.3%) and flesh (94.6–100%). Among the MAGIC population, PG content and total anthocyanin content were significantly correlated with fruit pericarp color values (L* × b*/a* = −0.570** and −0.613**).

Table 3
Correlation coefficients among fruits quality traits of the MAGIC population
| Year |
Trait |
DTF |
FW |
FF |
FC |
SC |
TA |
| 2013 |
DTF |
1 |
|
|
|
|
|
|
FW |
0.253 ** |
1 |
|
|
|
|
|
FF |
−0.088 * |
−0.118 ns |
1 |
|
|
|
|
FC |
−0.140 * |
−0.020 * |
0.303 ** |
1 |
|
|
|
SC |
−0.445 ** |
−0.311 ** |
0.306 ** |
0.189 * |
1 |
|
|
TA |
−0.274 ** |
−0.338 ** |
0.260 ** |
0.153 * |
0.561 ** |
1 |
| 2014 |
DTF |
1 |
|
|
|
|
|
|
FW |
0.263 ** |
1 |
|
|
|
|
|
FF |
−0.111 * |
−0.094 ns |
1 |
|
|
|
|
FC |
−0.017 ns |
−0.124 * |
−0.101 ns |
1 |
|
|
|
SC |
−0.279 ** |
−0.306 ** |
0.384 ** |
0.053 ns |
1 |
|
|
TA |
−0.139 * |
−0.318 ** |
0.263 ** |
−0.048 ns |
0.554 ** |
1 |
n = 217. DTF: Days to flowering, FW: fruits weight, FF: fruits firmness, FC: fruits color, SC: sugar content, TA: titratable acidity.
* and ** mean correlation coefficients are significant at 5% and 1% level, respectively.
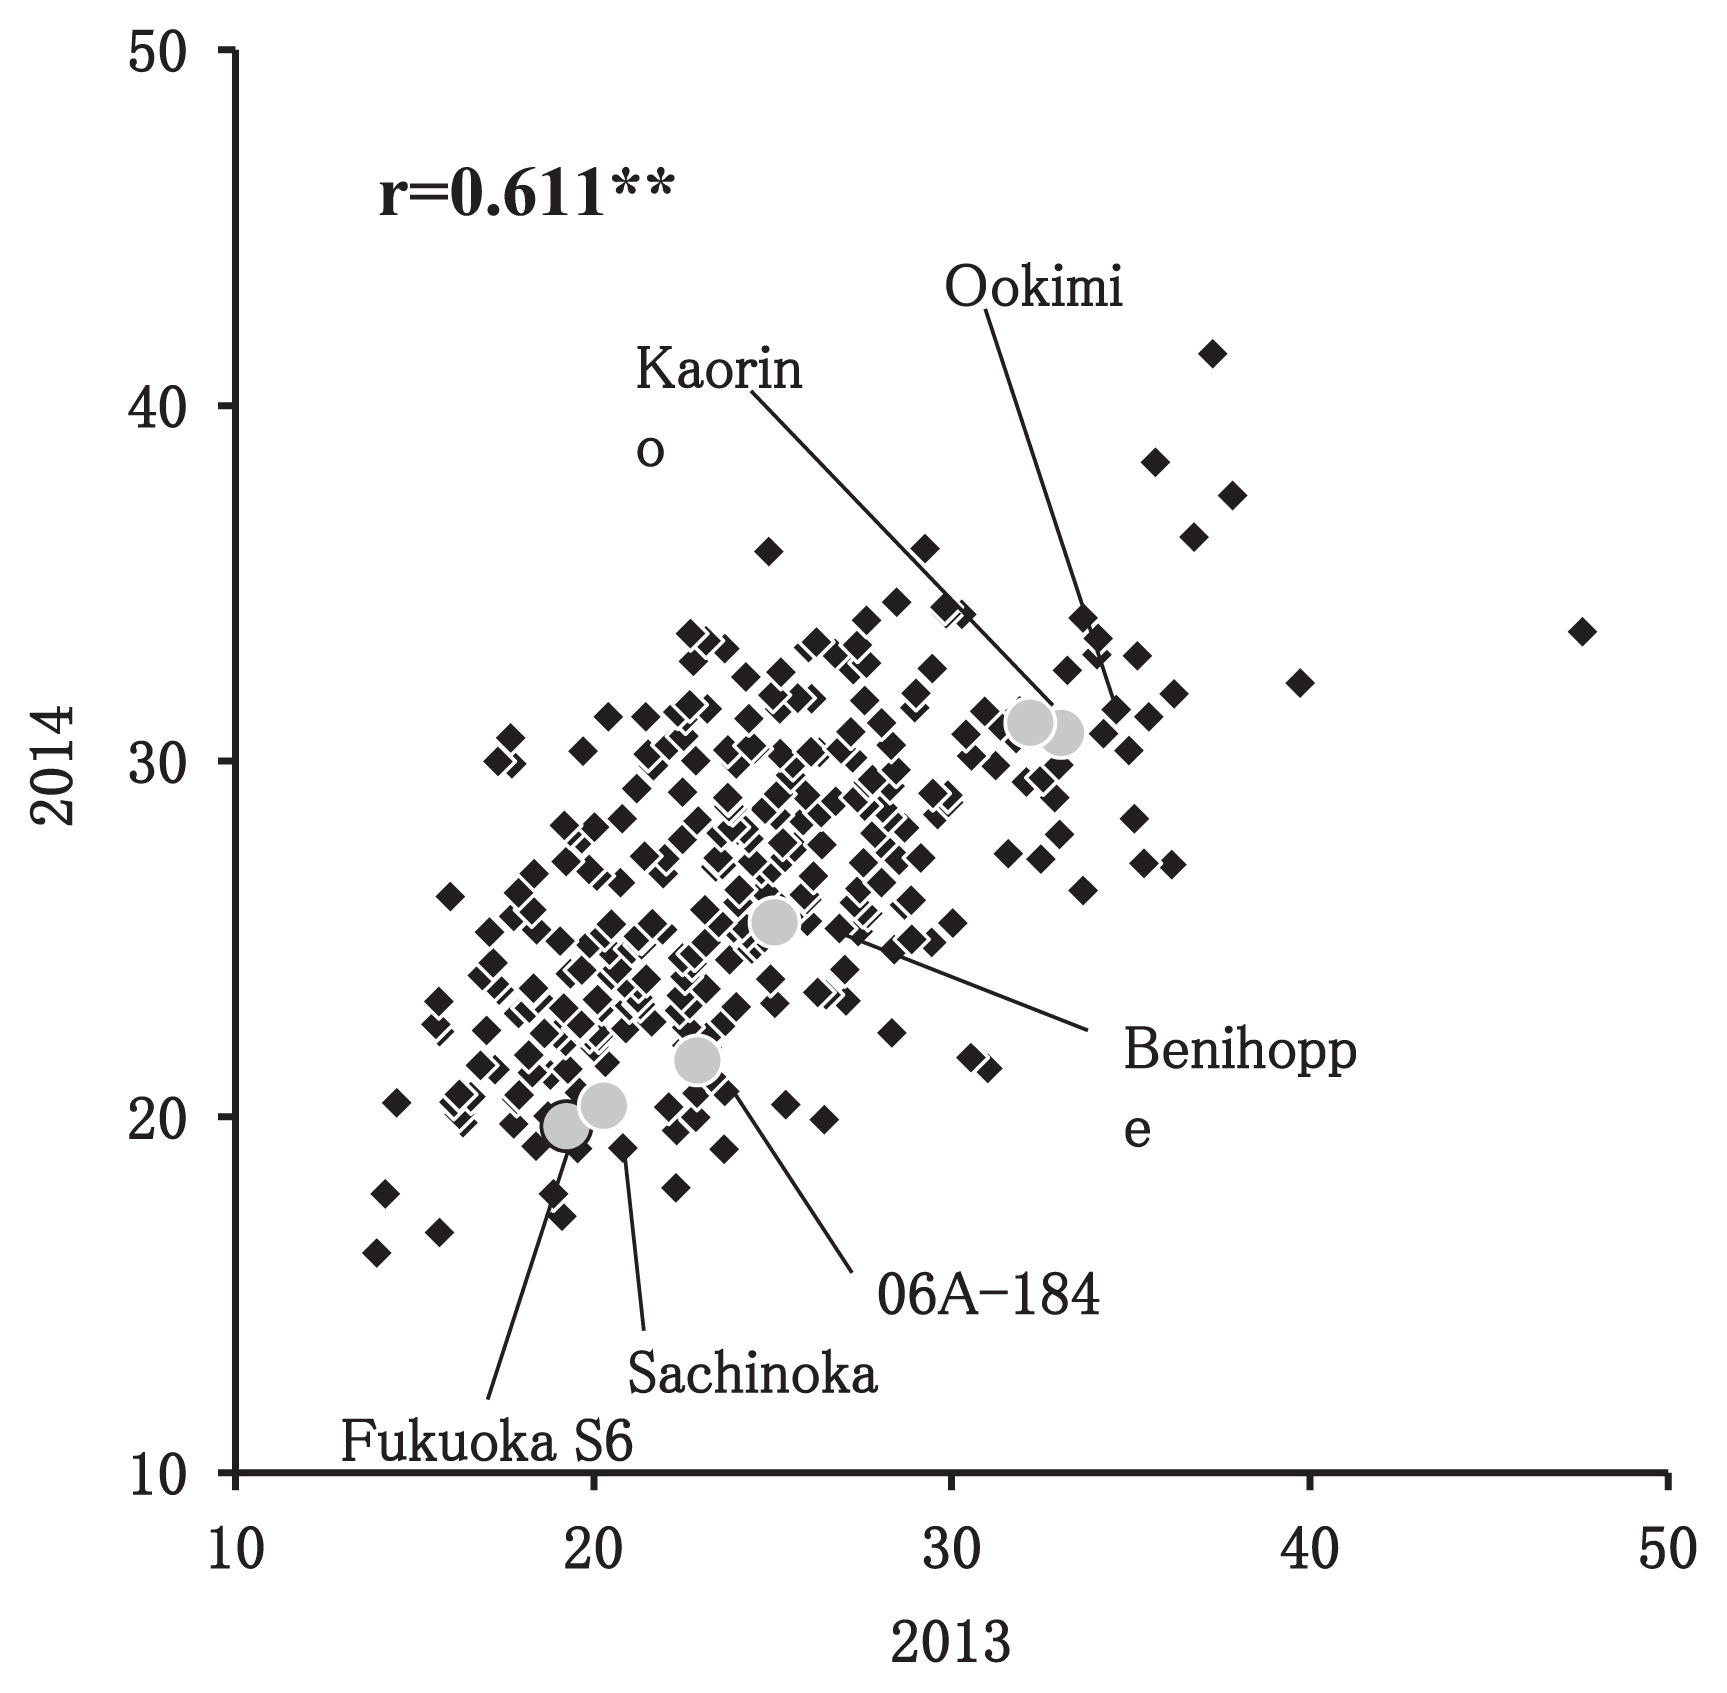
Table 4
Anthocyanin composition of founder cultivars of the strawberry MAGIC population
| Cultivar |
pericarp (μg/gFW) |
flesh (μg/gFW) |
| CG |
PG |
CM |
PM |
Total |
CG |
PG |
CM |
PM |
Total |
| Fukuoka S6 |
200.8 |
2223.2 |
0.9 |
0.0 |
2424.9 |
0.0 |
220.0 |
0.0 |
0.0 |
220.0 |
| Kaorino |
82.1 |
575.7 |
8.9 |
70.6 |
737.4 |
0.0 |
4.5 |
0.0 |
0.3 |
4.8 |
| Sachinoka |
100.3 |
2049.0 |
1.1 |
0.0 |
2150.3 |
0.4 |
138.9 |
0.0 |
0.0 |
139.3 |
| 06A-184 |
450.3 |
1470.4 |
0.0 |
0.0 |
1920.7 |
0.7 |
320.2 |
0.0 |
0.0 |
320.9 |
| Beni hoppe |
87.1 |
1201.9 |
7.2 |
123.2 |
1419.3 |
0.3 |
82.9 |
0.3 |
17.6 |
101.1 |
| Ookimi |
91.1 |
795.9 |
0.7 |
0.0 |
887.7 |
0.0 |
18.0 |
0.0 |
0.0 |
18.0 |
|
pericarp (%) |
flesh (%) |
| Fukuoka S6 |
8.3 |
91.7 |
0.0 |
0.0 |
100 |
0.0 |
100.0 |
0.0 |
0.0 |
100 |
| Kaorino |
11.1 |
78.1 |
1.2 |
9.6 |
100 |
0.0 |
94.6 |
0.0 |
5.4 |
100 |
| Sachinoka |
4.7 |
95.3 |
0.0 |
0.0 |
100 |
0.3 |
99.7 |
0.0 |
0.0 |
100 |
| 06A-184 |
23.4 |
76.6 |
0.0 |
0.0 |
100 |
0.2 |
99.8 |
0.0 |
0.0 |
100 |
| Beni hoppe |
6.1 |
84.7 |
0.5 |
8.7 |
100 |
0.3 |
82.0 |
0.3 |
17.4 |
100 |
| Ookimi |
10.3 |
89.7 |
0.1 |
0.0 |
100 |
0.0 |
100.0 |
0.0 |
0.0 |
100 |
upper and lower sections indicates actual values of each anthocyanin and its relative ratio, respectively. CG: Cyanidin 3-glucoside, PG: Pelargonidin 3-glucoside, CM: Cyanidin 3-malonylglucoside, PM: Pelargonidin 3-malonylglucoside.
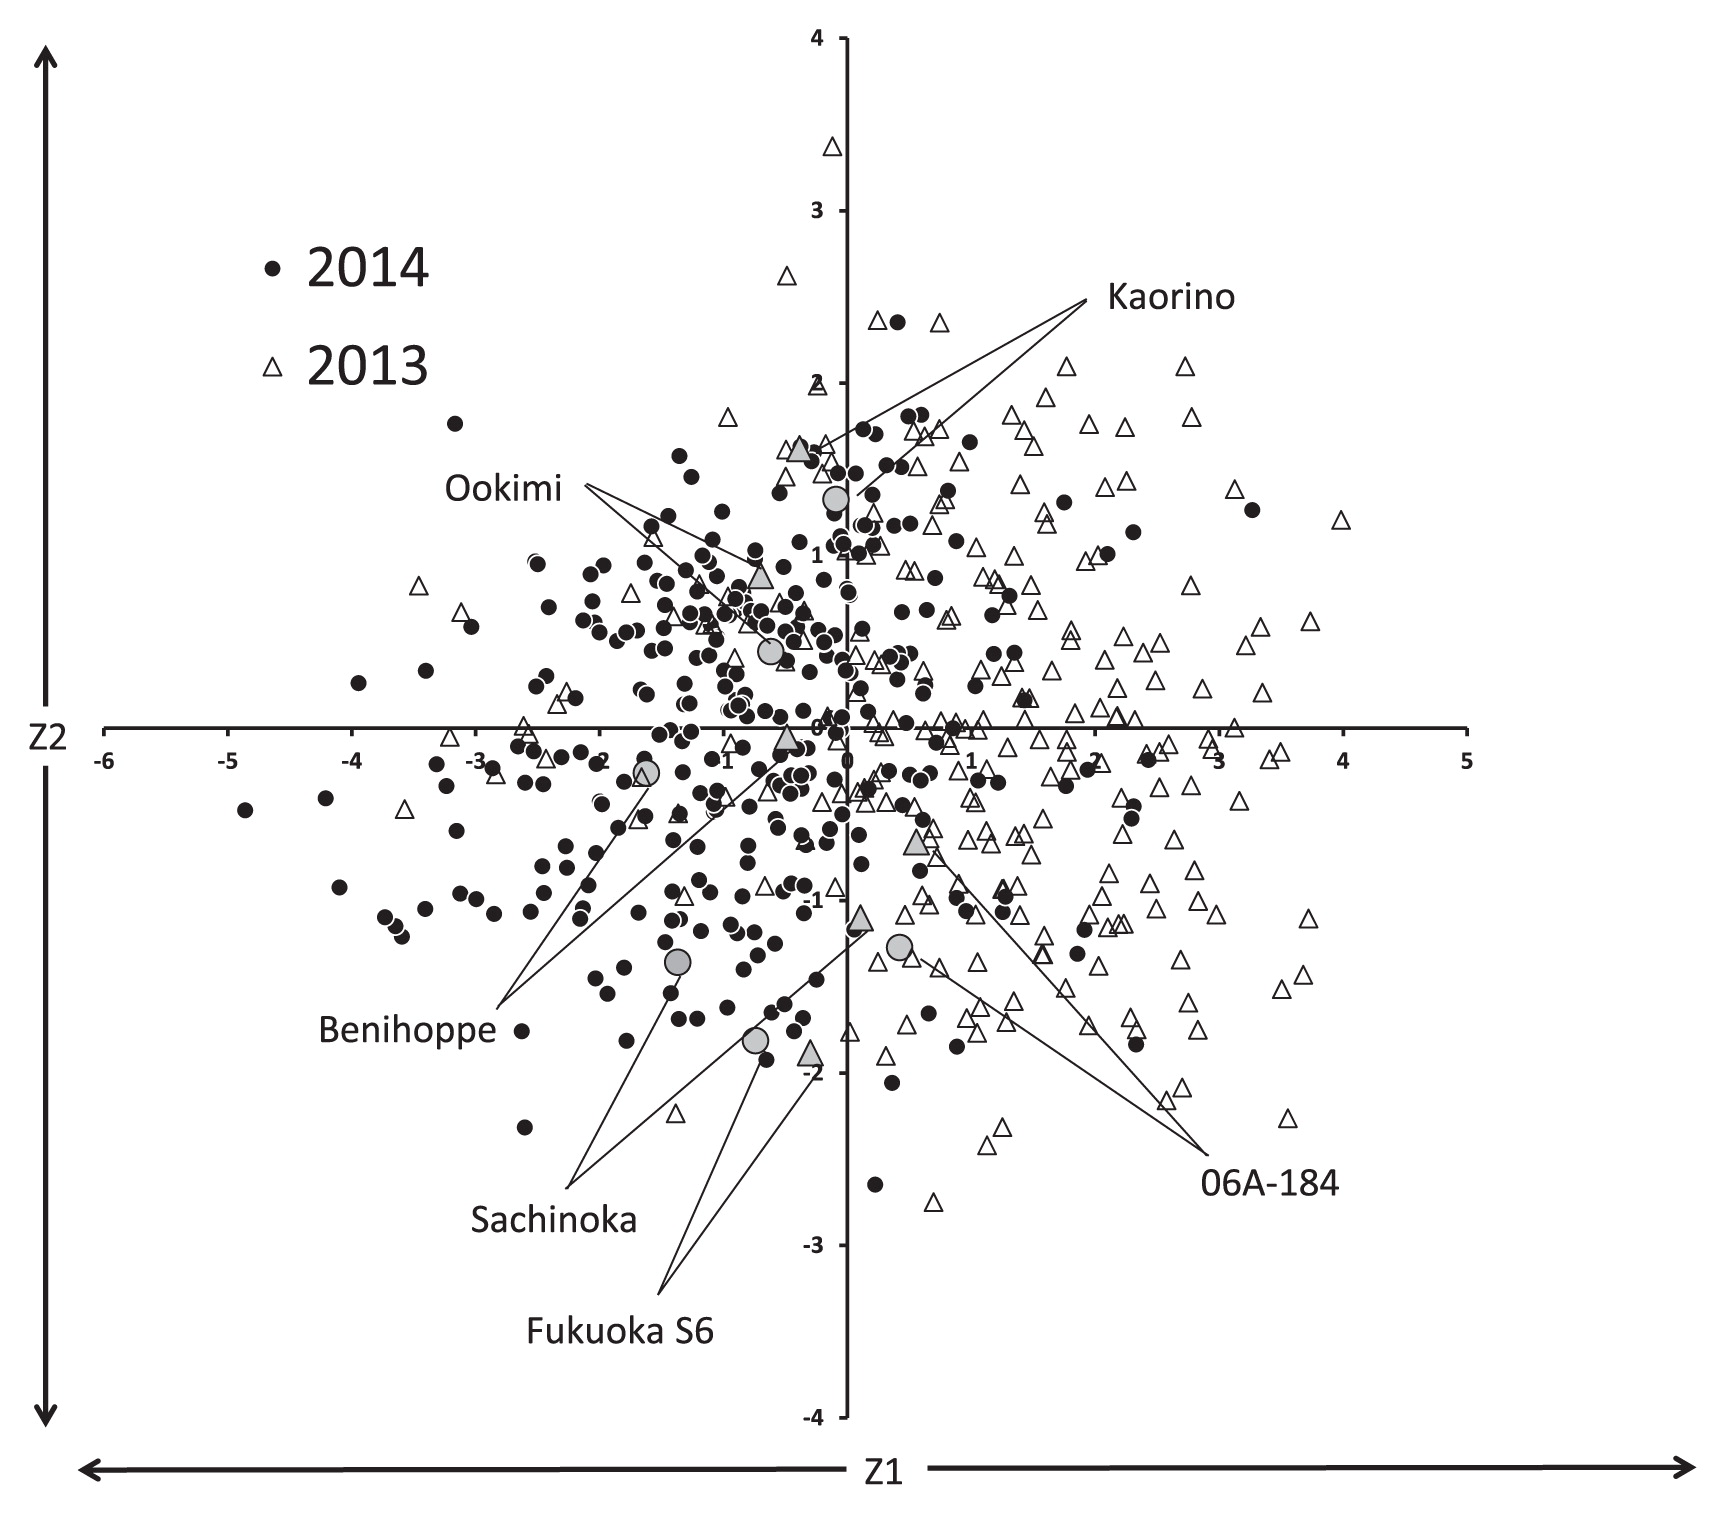
To characterize the MAGIC population, PCA was performed using the fruit quality related traits DTF, FW, FF, FC, SC, and TA as explanatory variables. Table 5 shows the factor loading, proportion of variance, and cumulative proportion of the PCA. DTF, FW, FF, SC, and TA primarily and almost evenly contributed to the differences in PC1 based on the factor loading values. The contribution of FC to PC1 was lower than that of the other traits. Conversely, only FC primarily contributed to the differences in PC2 because the factor loading value of FC for PC2 was high (0.90) compared with the other traits (from −0.22 to 0.30). Similar to PC1, both FW and FF mainly contributed to the differences in PC3, although FW and FF in PC1 were positive and negative (0.59 and −0.63), respectively, whereas in PC3 they were both positive (0.56 and 0.60). The cumulative proportion of variance of the three major principal components was over 0.73. A scatter plot of PC1 and PC2 of the MAGIC population in 2013 and 2014 is shown in Fig. 5. The definite values of PC1 in 2013 differed from those of 2014. However, those of PC2 in 2013 were similar to those in 2014. The order of the founder cultivars to the direction of PC2 resembled that of fruit pericarp color; Kaorino and Ookimi are in the upper regions in Fig. 5, Fukuoka S6 and Sachinoka in the lower regions, and 06A-184 and Beni hoppe in the middle.
Table 5
Factor loading, proportion variance, and cumulative proportion of principle component analysis based on fruits quality values of the strawberry MAGIC population
| Trait |
PC1 |
PC2 |
PC3 |
| DTF |
0.66 |
0.00 |
0.28 |
| FW |
0.59 |
0.30 |
0.56 |
| FF |
−0.63 |
0.17 |
0.60 |
| FC |
−0.30 |
0.90 |
−0.26 |
| SC |
−0.87 |
−0.04 |
0.13 |
| TA |
−0.76 |
−0.22 |
0.14 |
| Eigenvector value |
2.59 |
0.97 |
0.85 |
| Proportion of variance |
0.43 |
0.16 |
0.14 |
| Cumulative proportion |
0.43 |
0.59 |
0.73 |
Priciple component analysis was performed using fruit quality traits data of 2013 and 2014. n = 539. DTF: Days to flowering, FW: fruits weight, FF: fruits firmness, FC: fruits color, SC: sugar content, TA: titratable acidity.
Discussion
Diversity and genetic variation of the strawberry MAGIC population
Huang et al. (2015) summarized the advantages of MAGIC populations by focusing on their greater genetic and phenotypic diversity compared with populations derived from bi-parental crosses. As the genetic and phenotypic variation of populations from bi-parental crosses is roughly limited to that of both parents, and useful alleles detected in the population might not be functional in different genetic backgrounds. In contrast, if we choose the correct founder multi-parents to develop MAGIC populations, wider phenotypic variations could be analyzed and the detected QTLs in MAGIC populations could be useful in many genetic backgrounds. Numerous DNA markers are, however, essential to develop and analyze MAGIC populations (Huang et al. 2015) because the conformation of the genomic structure of the MAGIC population was more complex than that of bi-parental populations.
Table 6
Correlation coefficient of fruits color values and anthocyanin content of pericarp
|
L*·b*/a* |
CG |
PG |
CM |
PM |
Total |
| L*·b*/a* |
1 |
|
|
|
|
|
| CG |
−0.509** |
1 |
|
|
|
|
| PG |
−0.570** |
0.437** |
1 |
|
|
|
| CM |
−0.179** |
0.216** |
−0.061ns |
1 |
|
|
| PM |
−0.055 ns |
−0.091 ns |
−0.135* |
0.546** |
1 |
|
| Total |
−0.613** |
0.538** |
0.987** |
0.035 ns |
−0.033 ns |
1 |
**,* indicates significant at 1% and 5% level, respectively.
ns means not significant.
In strawberry, because of the complexity of the genomic structure (2n = 8x = 56), the development of DNA markers and linkage analysis has been limited. Recently, however, many DNA markers have been developed not only for the diploid species, such as F. vesca, but also for octoploid species, such as cultivated strawberry (Hadonou et al. 2004, Isobe et al. 2013, James et al. 2003, Kunihisa et al. 2009, Sargent et al. 2004, Shulaev et al. 2011). Furthermore, linkage analyses have been performed using these makers by Sargent et al. (2012) and Isobe et al. (2013) resulting in a set of EST-SSR markers, developed by Isobe et al. (2013), that includes 4,474 markers, which fully cover the cultivated strawberry genome. We have, therefore, developed a cultivated strawberry MAGIC population using these EST-SSR markers. In our MAGIC population, genotyping was carried out using 336 EST-SSR markers that were polymorphic among the six founder cultivars.
Huang et al. (2015) also established that selection of founder parents was important because this selection could affect the generalizability of a developed MAGIC population to the current breeding populations. Major Japanese strawberry cultivars were derived from only some ancestors, and Yoshida (2003) revealed that coefficients of inbreeding (CI) of recently developed strawberry cultivars, Nyoho, Tochiotome, and Akihime, were larger than those of sweet potato and potato cultivars; however, the six founder parents displayed wide phenotypic differences covering almost all natural variation in DTF, FW, FF, FC, SC, and TA in cultivated strawberries (Table 1). From the viewpoint of generalizability, the five cultivars (Fukuoka S6, Kaorino, Sachinoka, Beni hoppe, and Ookimi) from which the six founder parents are derived are widely cultivated in Japan. Isobe et al. (2013) showed that Fukuoka S6, Kaorino, Sachinoka, and Beni hoppe belonged to different clusters based on the polymorphism of 45 SSR markers. Although Ookimi belonged to the same cluster as Sachinoka, the agronomic traits of both cultivars were different from each other (Table 1); furthermore, Ookimi is the only cultivar that exhibits resistance to powdery mildew among the six founder cultivars. Cultivar 06A-184 was developed from a cross between Fukuoka S6 and Sanchiigo, and although 06A-184 might be genetically similar to Fukuoka S6, the phenotypic differences between these cultivars were large (Table 1), and genetic similarity of both parents, analyzed by cluster analysis (Fig. 2), was relatively low. Furthermore, 1,270 polymorphic loci were detected using 336 polymorphic SSR markers in the MAGIC population. Although choosing foreign cultivars as some of the founder parents might have expanded the genetic diversity of the MAGIC population, the developed MAGIC population would not be of practical usefulness because of its dissimilar and unfamiliar fruit quality. This demonstrates that we selected the appropriate founder parents for the development of the MAGIC population for strawberry breeding in Japan.
In addition to founder selection, the subsequent selection of the following generation was also extremely important for the development of a MAGIC population. Dell’Acqua et al. (2015) analyzed the suitability of the maize MAGIC population by implementing cluster analysis and PCA. Similarly, we performed cluster analysis and PCA to evaluate genetic diversity, variation, and suitability of the strawberry MAGIC population in this study. A dendrogram of cluster analysis revealed that the six founder cultivars were distributed almost evenly among the MAGIC population in the dendrogram circle, implying that the developed MAGIC population almost completely reflected the genetic diversity of the founder parents. According to PCA (Table 2), PC1 primarily accounted for the total variance of the MAGIC population, representing 23% of the variance. The maximum and minimum eigenvector of all SSR markers were extremely low at 0.068 and −0.089, respectively. This suggests that none of the specific marker variances were the main contributors to the differences in PC1. Other principal components (from PC2 to PC10) accounted for a lower (under 10%) proportion of the variance than did PC1. Equal distribution of the allelic SSR markers on the strawberry genome indicated that the lower principal components explained very little of the genetic structure of the MAGIC population. As a result, cluster analysis and PCA demonstrated that the strawberry MAGIC population developed in this study exhibited a mosaic structure of the founder cultivars without any bias and was suitable for further phenotypic and genetic analysis.
Fig. 3 shows the distribution of the fruit quality related traits DTF, FW, FC, FF, SC, TA, and AN. Regarding phenotypic variance, all the trait values of the MAGIC population showed transgressive distribution and most of the traits had a normal distribution, except for DTF (Fig. 3A). Because the individual plants derived from seeds are smaller than propagated seedlings, the flower bud differentiation of small seed lings is likely to be late (Morishita et al. 1993, Yamakawa and Noguchi 1989), leading to later flowering. In addition to seedling size, strawberry seedlings absorb nitrogen in soils after transplantation and flower later in autumn because of the dramatic change in the nitrogen level (Furuya et al. 1988, Matsumoto et al. 1983), with flowering time showing a generally bimodal distribution that could have led to the differences in the distribution of DTF in Fig. 3A. Normal distributions of trait values except for DTF suggest that many genetic regions affected trait variance.
Correlation coefficients among fruit quality related traits were calculated and are shown in Table 3. FW was positively correlated with DTF and negatively correlated with SC and TA. Hortynski et al. (1976) showed that high yield was correlated with a low SC value. Furthermore, Monma and Takada (1991) compared 11 traits in five F1 progeny lines and showed that fruit yield per plant was correlated significantly with SC and TA. Regarding the correlation with FW, our results supported these previous findings, consistent with the tendency for fruit density to decline as fruits increase in size. Additionally, Monma and Takada (1991) revealed that SC and TA were strongly correlated with each other using F1 progenies, although Morishita (1994) did not detect a significant correlation between SC and TA when examining general strawberry varieties; these differences might have been caused by the use of different population types.
Strawberry pericarp pigmentation was primarily caused by anthocyanin accumulation, with PG being the principal form (da Silva et al. 2007, Lukton et al. 1955, Yoshida et al. 2002, Yoshida and Tamura 2005); anthocyanins of the pericarp and flesh were not distinguished in these previous studies. We also found that PG was a major anthocyanin in both the pericarp and flesh (Table 4), supporting the results of the previous studies. Table 4 indicates that there were clear varietal differences in the anthocyanin content of the six founder cultivars. These differences were similar to those of FC, with the L* × b*/a* of the fruit pericarp color being strongly correlated with the PG content (r = −0.570**) and total anthocyanin content (r = −0.613**), supporting the fact that anthocyanin, especially PG, is a major source of strawberry pericarp pigmentation.
When comparing the individual plants (2013) and propagated seedlings (2014), FC and FF showed the highest (r = 0.611**) and the second highest (r = 0.558**) correlations, respectively. Although the correlation coefficients of DTF and SC were significant, their definite values were lower (r = 0.234** and 0.259**, respectively) than those of FC and FF, suggesting that genetic factors could play important roles in the variance of FC and FF and that environmental factors contributed less to trait variance. According to Table 3, FC showed lower or no significant correlations with other traits. Moreover, PCA using fruit quality related traits values as explanatory variables revealed that FC mainly contributed to the variance of PC2 and that the other traits played larger roles in the variance of PC1 and PC3 (Table 5). These findings indicate that FC was primarily genetically controlled and its variance did not tend to be affected by the variance of other traits. For the peach, de Souza et al. (1998) pointed out that the heritability and repeatability of fruit blush (pigmentation) were higher than those of fruit size, soluble solids, and titratable acidity. Additionally, Lin-Wang et al. (2010) showed that the DNA sequences of apple MYB10 genes were similar to those of other Rosaceae species, including Prunus persica (peach), F. vesca, and cultivated strawberries, suggesting that the genetic control system for coloration could be identical among the species in the Rosaceae family.
Here, we focus on the details of PCA analysis conducted in this study. In the case of PC1, the effects of DTF and FW were positive (0.66 and 0.59, respectively), whereas those of FF, SC, and TA were negative (−0.63, −0.87, and −0.76, respectively). As shown in Table 3, DTF was positively and negatively correlated with FW (r = 0.253**, 0.263**) and SC (r = −0.445**, −0.279**), respectively. This tendency was in accordance with the proportion of the variance in PC1. All the fruits related qualities, except for FC, contributed to the variance of PC1 to some extent, and DTF might have primarily affected the other traits: FW, FF, SC, and TA. These facts suggested that PC1 was an index for harvest time and fruit size, and PC2 was an index for fruit pericarp color. As the effects of FW and FF were positive in PC3, PC3 might be an index of the potential fruit filling ability of the relevant plant.
In this study, we successfully developed a strawberry MAGIC population derived from six cultivated strawberry cultivars. The MAGIC population sufficiently and evenly covered the genetic variance of six founder cultivars and showed transgressive segregation of trait values for practical analysis. Throughout the comparison of fruit quality related traits, we found that genetic factors mainly affected the variance of FC. Regarding the detection of genetic regions controlling phenotypic values, GWAS was effective and has been performed in many crops; (Bandillo et al. 2013, Buet et al. 2013, Cavanagh et al. 2008, Gaur et al. 2012, Huang et al. 2012, Pascual et al. 2015, Pea et al. 2013, Rebetzke et al. 2014, Sannemann et al. 2015). Genomic selection (GS) is another application of the MAGIC population. Attempts to improve phenotypic performance by GS have been carried out in many crops: maize (Bernardo and Yu 2007), rice (Onogi et al. 2016, Yamamoto et al. 2014), tomato (Yamamoto et al. 2016), Japanese pair (Iwata et al. 2013), and wheat (Heffner et al. 2011, Poland et al. 2012). The strawberry MAGIC population developed in this study could be useful for GWAS and GS to rapidly and efficiently improve crop performance. Yamamoto et al. (2014) demonstrated that more than six cycles of intercrossing increased QTL mapping power in an intermated recombinant inbred population of rice. The strawberry MAGIC population developed in this study is also expected to increase the QTL mapping power by contemplating more generations in the future.
Acknowledgements
We thank the Kyushu Okinawa Agricultural Research Center of the National Agriculture and Food Research Organization, Shizuoka Prefectural Research Institute of Agriculture and Forestry, and Mie Prefecture Agricultural Research Institute for providing the founder cultivar seedlings. We also thank S. Sasamoto, T. Wada, C. Minami, H. Tsuruoka, M. Kato, K. Nannri, and A. Kurabayashi in the Kazusa DNA Research Institute for technical assistance. This study was partly supported by a grant from the Genomicsbased Technology for Agricultural Improvement (DHR1.) and the Science and Technology Research Promotion Program for Agriculture, Forestry, Fisheries, and Food Industry (27003A) of the Ministry of Agriculture, Forestry, and Fisheries of Japan.
Literature Cited
- Bandillo, N., C. Raghavan, P.A. Muyco, M.A.L. Sevilla, I.T. Lobina, C.J. Dilla-Ermita, C.-W. Tung, S. McCouch, M. Thomson, R. Mauleon et al. (2013) Multi-parent advanced generation inter-cross (MAGIC) populations in rice: progress and potential for genetics research and breeding. Rice 6: 11.
- Bernardo, R. and J. Yu (2007) Prospects for genomewide selection for quantitative traits in maize. Crop Sci. 47: 1082–1090.
- Cavanagh, C., M. Morell, I. Mackay and W. Powell (2008) From mutations to MAGIC: resources for gene discovery, validation and delivery in crop plants. Curr. Opin. Plant Biol. 11: 215–221.
- Churchill, G.A., D.C. Airey, H. Allayee, J.M. Angel, A.D. Attie, J. Beatty, W.D. Beavis, J.K. Belknap, B. Bennett, W. Berrettini et al. (2004) The Collaborative Cross, a community resource for the genetic analysis of complex traits. Nat. Genet. 36: 1133–1137.
- da Silva, F.L., M.T. Escribano-Bailón, J.J. Pérez Alonso, J.C. Rivas-Gonzalo and C. Santos-Buelga (2007) Anthocyanin pigments in strawberry. LWT - Food Sci. Technol. 40: 374–382.
- Dell’Acqua, M., D.M. Gatti, G. Pea, F. Cattonaro, F. Coppens, G. Magris, A.L. Hlaing, H.H. Aung, H. Nelissen, J. Baute et al. (2015) Genetic properties of the MAGIC maize population: a new platform for high definition QTL mapping in Zea mays. Genome Biol. 16: 167.
- de Souza, V.A., D.H. Byrne and J.F. Taylor (1998) Heritability, genetic and phenotypic correlations, and predicted selection response of quantitative traits in peach: II. An analysis of several fruit traits. J. Am. Soc. Hortic. Sci. 123: 604–611.
- dos Santos, J.P.R., L.P.M. Pires, R.C. de Castro Vasconcellos, G.S. Pereira, R.G. Von Pinho and M. Balestre (2016) Genomic selection to resistance to Stenocarpella maydis in maize lines using DArTseq markers. BMC Genet. 17: 86.
- Furuya, S., M. Yamashita and A. Yamasaki (1988) Effects of nitrogen content on the flower bud initiation induced by chilling under dark condition in strawberries. Bull. Natal. Res. Inst. Veg., Ornam. Plants & Tea. Ser. D 1: 51–57.
- Hadonou, A.M., D.J. Sargent, F. Wilson, C.M. James and D.W. Simpson (2004) Development of microsatellite markers in Fragaria, their use in genetic diversity analysis, and their potential for genetic linkage mapping. Genome 47: 429–438.
- Hirakawa, H., K. Shirasawa, S. Kosugi, K. Tashiro, S. Nakayama, M. Yamada, M. Kohara, A. Watanabe, Y. Kishida, T. Fujishiro et al. (2014) Dissection of the octoploid strawberry genome by deep sequencing of the genomes of Fragaria species. DNA Res. 21: 169–181.
- Hortynski, J., I. Flis and T. Hulewicz (1976) Phenotypic correlations concerning generative and vegetative characters in the strawberry (Fragaria × ananassa Duch.). Z. Pflanzenzuechtung (Germany, FR) 77: 121–132.
- Huang, B.E., A.W. George, K.L. Forrest, A. Kilian, M.J. Hayden, M.K. Morell and C.R. Cavanagh (2012) A multiparent advanced generation inter-cross population for genetic analysis in wheat. Plant Biotechnol. J. 10: 826–839.
- Huang, B.E., K.L. Verbyla, A.P. Verbyla, C. Raghavan, V.K. Singh, P. Gaur, H. Leung, R.K. Varshney and C.R. Cavanagh (2015) MAGIC populations in crops: current status and future prospects. Theor. Appl. Genet. 128: 999–1017.
- Isobe, S.N., H. Hirakawa, S. Sato, F. Maeda, M. Ishikawa, T. Mori, Y. Yamamoto, K. Shirasawa, M. Kimura, M. Fukami et al. (2013) Construction of an integrated high density simple sequence repeat linkage map in cultivated strawberry (Fragaria × ananassa) and its applicability. DNA Res. 20: 79–92.
- Iwata, H., T. Hayashi, S. Terakami, N. Takada, Y. Sawamura and T. Yamamoto (2013) Potential assessment of genome-wide association study and genomic selection in Japanese pear Pyrus pyrifolia. Breed. Sci. 63: 125–140.
- James, C.M., F. Wilson, A.M. Hadonou and K.R. Tobutt (2003) Isolation and characterization of polymorphic microsatellites in diploid strawberry (Fragaria vesca L.) for mapping, diversity studies and clone identification. Mol. Ecol. Notes 3: 171–173.
- Kitamura, H., T. Mori, J. Kohori, S. Yamada and H. Shimizu (2015) Breeding and extension of the new strawberry cultivar Kaorino with extremely early flowering and resistance to anthracnose. Hort. Res. (Japan) 14: 89–95.
- Kunihisa, M., H. Ueda, N. Fukino and S. Matsumoto (2009) DNA markers for identification of strawberry (Fragaria × ananassa Duch.) cultivars based on probability theory. J. Japan. Soc. Hort. Sci. 78: 211–217.
- Lerceteau-Köhler, E., A. Moing, G. Guerin, C. Renaud, A. Petit, C. Rothan and B. Denoyes (2012) Genetic dissection of fruit quality traits in the octoploid cultivated strawberry highlights the role of homoeo-QTL in their control. Theor. Appl. Genet. 124: 1059–1077.
- Lin-Wang, K., K. Bolitho, K. Grafton, A. Kortstee, S. Karunairetnam, T.K. McGhie, R.V. Espley, R.P. Hellens and A.C. Allan (2010) An R2R3 MYB transcription factor associated with regulation of the anthocyanin biosynthetic pathway in Rosaceae. BMC Plant Biol. 10: 50.
- Lukton, A., C. Chichester and G. Mackinney (1955) Characterization of a second pigment in strawberries. Nature 176: 790.
- Matsumoto, O., Y. Harada and S. Fukuda (1983) Influence of the nitrogenous nutritional difference of strawberry seedlings on days to flower-bud differentiation and flowering. Kinki Chugoku Agri. Res. 65: 40–43.
- Mitsui, H., K. Fujita, T. Sueyoshi and H. Fushihara (2003) New strawberry cultivar Fukuoka S6 and Fukuoka S7 for forcing culture. Bull. Fukuoka Agric. Res. Cent. 22: 61–68.
- Monma, S. and K. Takada (1991) Inheritance of soluble solids content and acidity in strawberry (Fragaria × ananassa Duch.). J. Japan. Soc. Hort. Sci. 59: 719–726.
- Mori, T., T. Toya and T. Fujiwara (2000) Development of the new strawberry cultivar Sanchiigo with resistance to anthracnose. Bull. Mie Agri. Tech. Cent. 27: 27–36.
- Morishita, M., T. Mochizuki and O. Yamakawa (1993) Flower induction and selection on earliness of strawberry seedlings by short-day and low night temperature treatment. J. Japan. Soc. Hort. Sci. 61: 857–864.
- Morishita, M. (1994) Studies on genetic variation and inheritance of quality and yield characters for advanced strawberry breeding. Bull. Natl. Res. Inst. Veg., Ornam. Plants & Tea, Ser. A 8: 1–53.
- Morishita, M., T. Mochizuki, Y. Noguchi, K. Sone and O. Yamakawa (1997) ‘Sachinoka’, a new strawberry variety for forcing culture. Bull. Natl. Res. Inst. Veg., Ornam. Plants & Tea, Ser. 12: 91–115.
- Okimura, M. (2010) Development and dissemination of new strawberry cultivars Ookimi and Koinoka. Bio Kyushu 195.
- Onogi, A., M. Watanabe, T. Mochizuki, T. Hayashi, H. Nakagawa, T. Hasegawa and H. Iwata (2016) Toward integration of genomic selection with crop modelling: the development of an integrated approach to predicting rice heading dates. Theor. Appl. Genet. 129: 805–817.
- Pascual, L., N. Desplat, B.E. Huang, A. Desgroux, L. Bruguier, J.P. Bouchet, Q.H. Le, B. Chauchard, P. Verschave and M. Causse (2015) Potential of a tomato MAGIC population to decipher the genetic control of quantitative traits and detect causal variants in the resequencing era. Plant Biotechnol. J. 13: 565–577.
- Poland, J., J. Endelman, J. Dawson, J. Rutkoski, S. Wu, Y. Manes, S. Dreisigacker, J. Crossa, H. Sánchez-Villeda, M. Sorrells et al. (2012) Genomic selection in wheat breeding using genotyping-by-sequencing. Plant Genome 5: 103–113.
- Rebetzke, G.J., A.P. Verbyla, K.L. Verbyla, M.K. Morell and C.R. Cavanagh (2014) Use of a large multiparent wheat mapping population in genomic dissection of coleoptile and seedling growth. Plant Biotechnol. J. 12: 219–230.
- Sannemann, W., B.E. Huang, B. Mathew and J. Léon (2015) Multiparent advanced generation inter-cross in barley: high-resolution quantitative trait locus mapping for flowering time as a proof of concept. Mol. Breed. 35: 86.
- Sargent, D.J., T.M. Davis, K.R. Tobutt, M.J. Wilkinson, N.H. Battey and D.W. Simpson (2004) A genetic linkage map of microsatellite, gene-specific and morphological markers in diploid Fragaria. Theor. Appl. Genet. 109: 1385–1391.
- Sargent, D.J., T. Passey, N. Šurbanovski, E. Lopez Girona, P. Kuchta, J. Davik, R. Harrison, A. Passey, A.B. Whitehouse and D.W. Simpson (2012) A microsatellite linkage map for the cultivated strawberry (Fragaria × ananassa) suggests extensive regions of homozygosity in the genome that may have resulted from breeding and selection. Theor. Appl. Genet. 124: 1229–1240.
- Shulaev, V., D.J. Sargent, R.N. Crowhurst, T.C. Mockler, O. Folkerts, A.L. Delcher, P. Jaiswal, K. Mockaitis, A. Liston, S.P. Mane et al. (2011) The genome of woodland strawberry (Fragaria vesca). Nat. Genet. 43: 109–116.
- Takeuchi, T., H. Fujinami, T. Kawata and M. Mastsumura (1999) Pedigree and characteristics of a new strawberry cultivar Beni hoppe. Bull. Shizuoka Agri. Exp. Stn. 44: 13–24.
- Tamura, K., G. Stecher, D. Peterson, A. Filipski and S. Kumar (2013) MEGA6: Molecular Evolutionary Genetics Analysis Version 6.0. Mol. Biol. Evol. 30: 2725–2729.
- van Berloo, R. (2008) GGT 2.0: versatile software for visualization and analysis of genetic data. J. Hered. 99: 232–236.
- Yamamoto, E., H. Iwata, T. Tanabata, R. Mizobuchi, J.-i. Yonemaru, T. Yamamoto and M. Yano (2014) Effect of advanced intercrossing on genome structure and on the power to detect linked quantitative trait loci in a multi-parent population: a simulation study in rice. BMC Genet. 15: 50.
- Yamamoto, E., H. Matsunaga, A. Onogi, H. Kajiya-Kanegae, M. Minamikawa, A. Suzuki, K. Shirasawa, H. Hirakawa, T. Nunome, H. Yamaguchi et al. (2016) A simulation-based breeding design that uses whole-genome prediction in tomato. Sci. Rep. 6: 19454.
- Yoshida, T. (2003) Inbreeding in several recently bred cultivars of vegetatively propagated crops. Jpn. J. Soc. Crop Sci. 72: 309–313.
- Yoshida, Y., N. Koyama and H. Tamura (2002) Color and anthocyanin composition of strawberry fruit: Changes during fruit development and differences among cultivars, with special reference to the occurrence of pelargonidin 3-malonylglucoside. J. Japan. Soc. Hort. Sci. 71: 355–361.
- Yoshida, Y. and H. Tamura (2005) Variation in concentration and composition of anthocyanins among strawberry cultivars. J. Japan. Soc. Hort. Sci. 74: 36–41.
- Zhao, Y., M. Gowda, W. Liu, T. Würschum, H.P. Maurer, F.H. Longin, N. Ranc and J.C. Reif (2012) Accuracy of genomic selection in European maize elite breeding populations. Theor. Appl. Genet. 124: 769–776.
- Zorrilla-Fontanesi, Y., A. Cabeza, P. Dominguez, J.J. Medina, V. Valpuesta, B. Denoyes-Rothan, J.F. Sanchez-Sevilla and I. Amaya (2011) Quantitative trait loci and underlying candidate genes controlling agronomical and fruit quality traits in octoploid strawberry (Fragaria × ananassa). Theor. Appl. Genet. 123: 755–778.