Abstract
Kernel moisture content at harvest stage (KMC) is an important factor affecting maize production, especially for mechanical harvesting. We investigated the genetic basis of KMC using an association panel comprising of 144 maize inbred lines that were phenotypically evaluated at two field trial locations. Significant positive or negative correlations were identified between KMC and a series of other agronomic traits, indicating that KMC is associated with other such traits. Combining phenotypic values and the Maize SNP3K Beadchip to perform a genome-wide association study revealed eight single nucleotide polymorphisms (SNPs) associated with KMC at P ≤ 0.001 using a mixed linear model (PCA+K). These significant SNPs could be converted into five quantitative trait loci (QTLs) distributed on chromosomes 1, 5, 8, and 9. Of these QTLs, three were co-localized with genomic regions previously reported. Based on the phenotypic values of the alleles corresponding to significant SNPs, the favorable alleles were mined. Eight maize inbred lines with low KMC and harboring favorable alleles were identified. These QTLs and elite maize inbred lines with low KMC will be useful in maize breeding.
Introduction
Kernel moisture content at harvest stage (KMC) is an important factor that influences maize production, especially maize-growing areas in northern latitudes (Li et al. 2017, Sala et al. 2012). Low KMC not only protects maize kernels from mildew, but is also beneficial for mechanical harvesting. Conversely, high KMC restricts the popularization of mechanical harvesting, increases production costs and seriously affects kernel quality in China (Li et al. 2017). Therefore, breeding elite varieties with low KMC is a major goal for maize breeders.
KMC is normally considered as a quantitative trait that is controlled by multiple genes and is sensitive to environmental factors (Hallauer et al. 2010, Sentz 1971, Song et al. 2017, Wang and Li 2017). KMC was significantly decreased by introgressing tropical germplasm into temperate germplasm via recurrent selection (Hawbaker et al. 1997). However, evaluating KMC is a labor-intensive procedure and therefore not suitable for large segregating populations.
With the development of molecular markers, molecular marker-assisted selection (MAS) provides a useful tool to enhance the accuracy and efficiency of breeding (Collard and Mackill 2008). Consequently, it is necessary to dissect the genetic basis of KMC. Previous studies have shown that KMC is controlled mainly by additive effects with high heritability (Austin et al. 2000, Sala et al. 2006, Sentz 1971, Song et al. 2017), suggesting that MAS should be effective. Thus far, hundreds of quantitative trait loci (QTLs) for maize KMC have been identified in diverse populations by linkage analysis (Austin et al. 2000, Beavis et al. 1994, Blanc et al. 2006, Frascaroli et al. 2007, Ho et al. 2002, Melchinger et al. 1998, Mihaljevic et al. 2004, 2005, Sala et al. 2006, Song et al. 2017). Xiang et al. (2012) and Sala et al. (2012) collected 96 and 184 QTLs for KMC and subsequently estimated 44 and 34 meta-QTLs, respectively. Although numerous QTLs were mapped, they have rarely been used in maize breeding because of the large confidence intervals of these QTLs and the restricted allelic sampling between bi-parents.
Considering the limitations of bi-parental mapping, an alternative approach to identify genetic loci is to use genome-wide association study (GWAS) based on linkage disequilibrium. Such method enables researchers to explore a greater number of alleles with a higher mapping resolution (Yu and Buckler 2006). As a high-resolution gene mapping tool, GWAS has been applied in identifying favorable alleles for KMC-related traits, such as kernel field dehydration rate (Dai et al. 2017, Zhang et al. 2016) and husk traits (Cui et al. 2016, Zhou et al. 2016). However, to the best of our knowledge, reports on GWAS of KMC are limited. In this study, we used the GWAS approach, employing 144 maize inbred lines that were genotyped using the Maize SNP3K Beadchip and phenotypically evaluated in two field trial locations, to detect QTLs and favorable alleles for KMC as well as to analyze the phenotypic relationship between KMC and other agronomic traits.
Materials and Methods
Plant material and genotyping
An association mapping panel composed of 144 maize inbred lines was used as plant material (Supplemental Table 1).
Genotypes of the 144 maize inbred lines were evaluated using the Maize SNP3K Beadchip (Illumina, San Diego, CA, USA) with methods reported previously by Yang et al. (2011), at the National Maize Improvement Center of China, China Agricultural University. The Maize SNP3K Beadchip contained 3,072 random single nucleotide polymorphisms (SNPs) (including 1,884 SNPs within different genes and 1,188 intergenic SNPs) of good quality selected from 49,585 SNPs that evenly cover the maize genome (Ganal et al. 2011). Finally, 2,824 SNPs with minor allele frequency >5% and missing data <20% were obtained for subsequent analysis.
Field trials and phenotyping
The trials were performed in 2016 at two locations: Nantong, Jiangsu Province (NT, 120°E, 31°N), which is located in mid-east China and has an average temperature of 15.1°C and an average of 1,040 mm of rain per year, as well as Sanya, Hainan Province (SY, 108°E, 18°N), which is located in south China and has an average temperature of 25.7°C and an average of 1,347 mm of rain per year.
Before the experimental treatment, the physiological maturity of each line was evaluated in the field, and the 144 maize inbred lines were sown at three dates according to their growth periods. They were planted on the 17th, 21st and 25th of March, respectively, to obtain a similar physiological maturity in the field in NT, adjusting the harvest stage of association mapping panel to between 12th and 16th of July. In SY, the association mapping panel was sown on 7th, 11th and 15th of November also according to its physiological maturity, respectively, and the harvest stage was adjusted to between 20th and 24th of February of next year.
Each line was grown in single rows 5 m long and spaced 0.6 m between rows with a planting density of 65,000 plants/hm2, following a randomized complete block design with two replications per location. Agronomic management of the field experiments was the same at both locations. The ears were bagged before silking, and artificial pollination was carried out at the same time for each line. The KMC for 12 uniformly growing plants in the middle of rows was measured using a hand-held moisture meter (Reid et al. 2010) at 10 days after physiological maturity (i.e., the date of kernel milk line disappearance and black layer formation according to Vieira et al. 1995) was designated as harvest stage.
A set of 18 agronomic traits was also measured, including three morphological traits (plant height (PH), ear height (EH) and stem diameter (SD)), two maturity traits (days to silking (DTS) and tasseling (DTT)), three husk-related traits (husk number (HN), length (HL) and weight (HW)), five ear-related traits (ear length (EL), ear diameter (ED), kernel row number (KRN), kernel number per row (KNPR) and cob diameter (CD)), and five kernel-related traits (kernel length (KL), width (KW) and thickness (KT), 100-kernel weight (HKW) and kernel drying rate after physiological maturity (KDR)).
Phenotypic data analysis
The phenotypic data were subjected to descriptive statistical analysis, analysis of variance, correlation analysis, LSD test and linear regression analysis using R software version 3.1.1 for Windows® (https://www.r-project.org/). The broad-sense heritability (H2) for KMC was estimated using the following formula: H2 (%) = σ2g/(σ2g + σ2ge/n + σ2e/nr) × 100%, where σ2g is the genotypic variance, σ2ge is the variance for interactions of genotype with environment, σ2e is the error variance, n is the number of environments, and r is the number of replications (Hallauer et al. 2010). To minimize the effects of environment, the best linear unbiased predictions (BLUPs) for KMC across two locations were estimated using lmer function of lme4 package for further analysis.
Population structure, relative kinship, and linkage disequilibrium
Population structure was estimated using the software STRUCTURE 2.3 (Pritchard et al. 2000) with 2,824 SNPs. The number of subpopulations (k) was set from 1 to 10 with five independent runs for each k. Both burn-in periods and Markov chain Monte Carlo replication number were set at 100,000 in each run under the admixture model. The k value was estimated by the log likelihood of the data (LnP(D)) and an ad hoc statistic Δk, based on the rate of change of LnP(D) between successive k values (Evanno et al. 2005). Nei’s genetic distance (Nei 1972) was calculated and used to construct a neighbor-joining tree using the software PowerMarker 3.25 (Liu and Muse 2005) with the same SNP set.
The relative kinship matrix (K) of the 144 maize inbred lines was computed using the software SPAGeDi 1.3 (Hardy and Vekemans 2002) with negative values between two individuals set to zero. The linkage disequilibrium (LD) parameter r2 between pairwise SNPs was calculated by the software TASSEL 5.0 with 1,000 permutations (Bradbury et al. 2007).
Genome-wide association study
GWAS was conducted using the software TASSEL 5.0 (Bradbury et al. 2007). Six statistical models, namely a naive general linear model (GLM), GLM with Q-matrix (GLM (Q)), GLM with PCA-matrix (the top three principal components, GLM (PCA)), a mixed linear model with K-matrix (MLM (K)), MLM with PCA-matrix and K-matrix (MLM (PCA+K)), and MLM with Q-matrix and K-matrix (MLM (Q+K)), were applied to control spurious associations from population structure and relative kinship. As the Bonferroni correction (0.05/2,824 = 1.77 × 10⁻⁵) was too stringent and its applicability in GWAS is disputed (Gupta et al. 2014), a compromised threshold of P ≤ 0.001 was selected to be significant for association signals.
Results
Phenotypic variation for KMC
The descriptive statistics and analysis of variance for KMC in the association mapping panel are presented in Table 1. Wide phenotypic variation among the 144 accessions was observed: from 21.50% to 41.00% in NT and from 19.63% to 43.64% in SY (Table 1). The mean of KMC in NT and SY was 33.97% and 33.93%, respectively (Table 1), and a highly positive correlation (r2 = 0.71, P < 0.001) was observed between the two locations. The KMC at both locations approximately fitted a normal distribution with little skewness and kurtosis (Table 1, Fig. 1a), indicating that this trait was controlled by multiple loci in this panel.
Table 1
Phenotypic performance, variance component and broad-sense heritability of kernel moisture content at harvest stage
| Location |
Mean ± SDa (%) |
Range (%) |
Skewness |
Kurtosis |
σ2g b |
σ2ge c |
H2 d (%) |
| Nantong |
33.97 ± 0.38 |
21.50–41.00 |
−0.18 |
−0.59 |
17.50** |
6.81** |
82.00 |
| Sanya |
33.93 ± 0.45 |
19.63–43.63 |
−0.38 |
−0.42 |
|
|
|
| BLUPe |
33.95 ± 0.32 |
23.38–40.43 |
−0.17 |
−0.53 |
|
|
|
a standard deviation; b variance of genotype; c variance of genotype × environment; d broad-sense heritability; e best linear unbiased prediction;
** Significant at
P < 0.01.
Based on the BLUP values across the two locations, 8 of the 144 lines (5.56%) showed low KMC below 27% moisture, 49 lines (34.03%) showed high KMC above 35%, and the remaining lines showed moderate KMC. The variances of genotype (σ2g) and genotype × environment (σ2ge) were significant at P < 0.01 (Table 1), and the broad-sense heritability was high (82.00%), suggesting that much of the phenotypic variation in this panel was genetically controlled.
Correlation analysis of KMC with other agronomic traits
The results of the correlation analysis between KMC and 18 agronomic traits are presented in Fig. 1b. KMC exhibited highly significant negative correlation with KDR, and there was low but significant negative correlation with KL and HKW. In addition, KMC showed significant positive correlation with DTS, DTT, SD, HL, HN, HW, CD, and KT, with correlation coefficients from 0.17 to 0.59.
Population structure and linkage disequilibrium
The population structure analysis performed using STRUCTURE software, showed that the LnP(D) values continued to increase as K varied from 1 to 10 (Supplemental Fig. 1a); however, Δk reached its peak at K = 3 (Supplemental Fig. 1b), suggesting this association mapping panel could be divided into three subpopulations. A neighbor-joining tree was constructed based on Nei’s genetic distance showing three clusters for this panel (Supplemental Fig. 1c), which was consistent with the results of the population structure analysis.
The three subpopulations were designated as G1, G2 and G3. Subpopulation G1 mainly comprised the Reid germplasm, derived from American synthetic variety BSSS. G2 comprised the Lancaster germplasm, in which the representative inbred line Mo17 was distributed, and a small number of tropical germplasm lines. G3 mainly comprised the Chinese Tang Si Ping Tou and PB germplasm, but also included a few Lvda Red Cob germplasm lines (Supplemental Table 1).
The average LD decay distance across all chromosomes was ~300 kb, where the LD parameter (r2) dropped to half of its maximum value, and the LD decay distance differed among 10 chromosomes, ranging from ~200 kb on chromosome 7 to ~1000 kb on chromosome 9 (Supplemental Fig. 1d).
Genome-wide association study
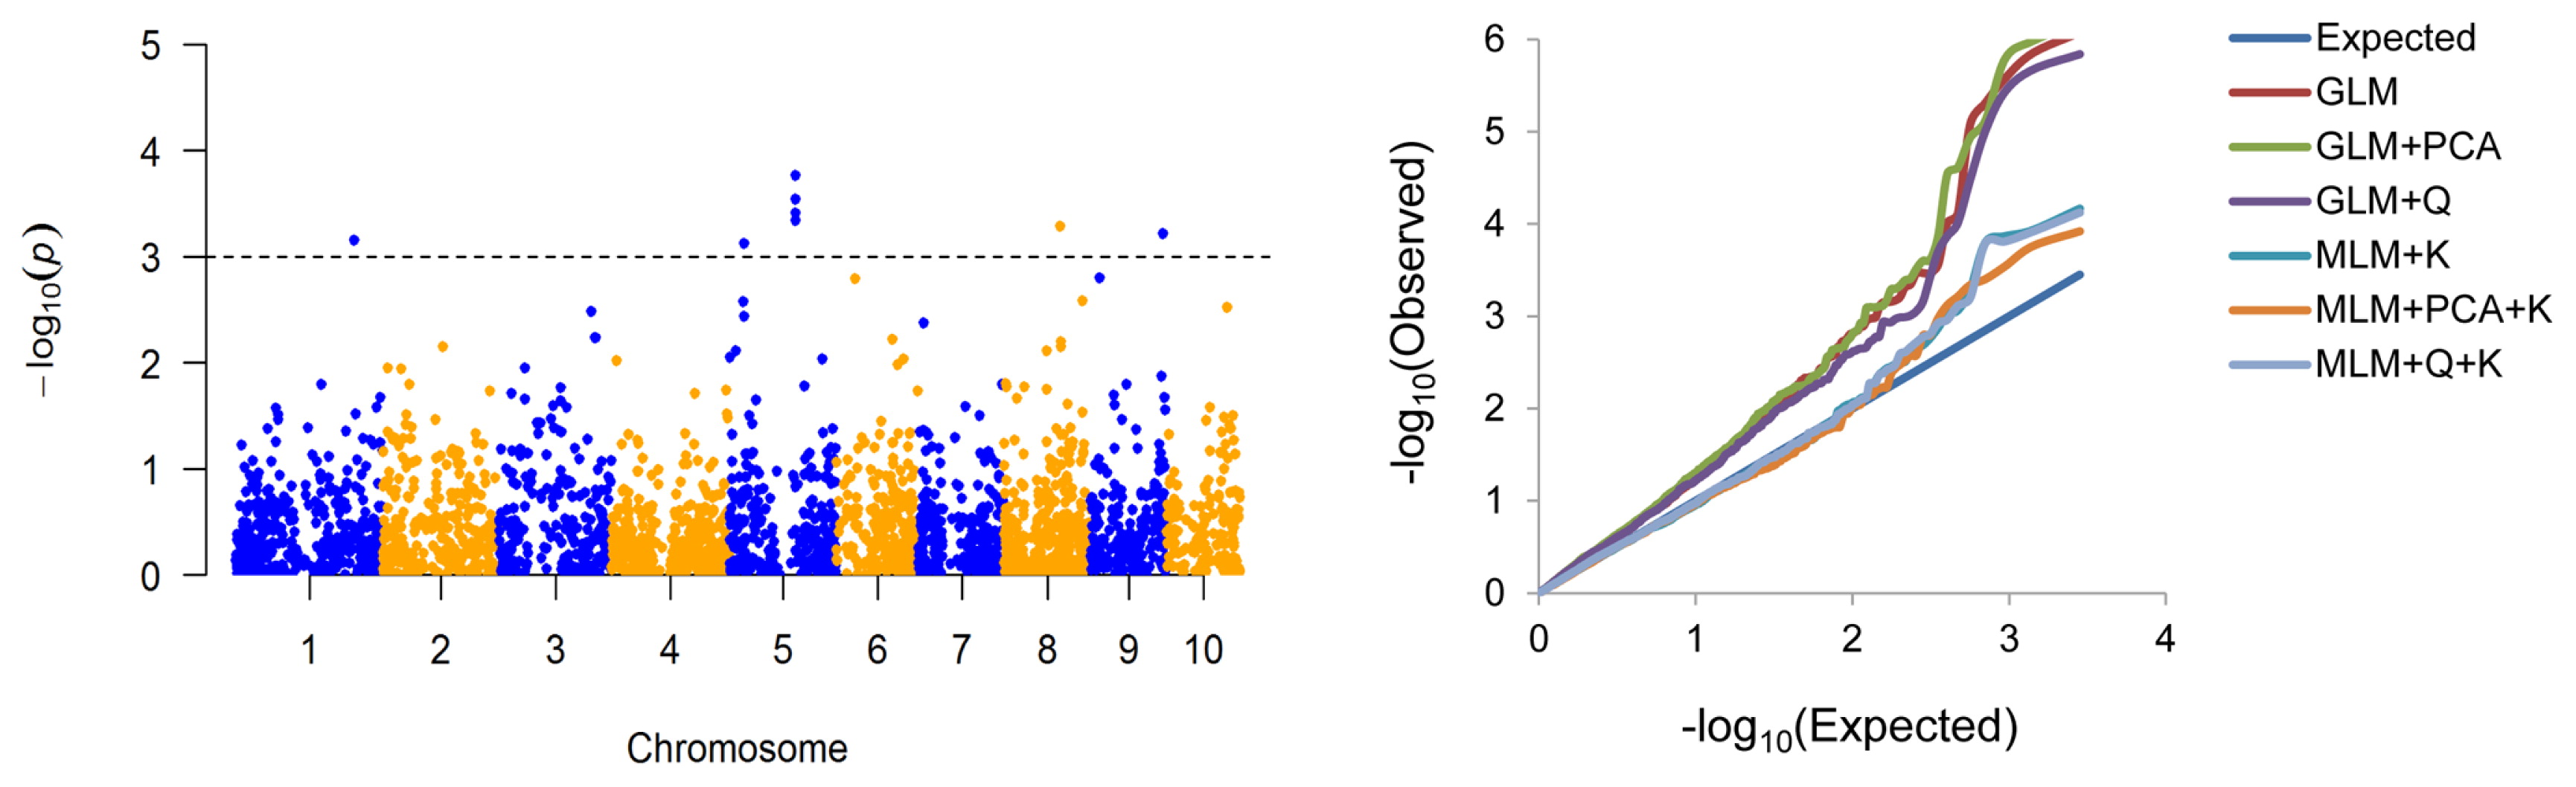
Considering the potential for spurious associations in GWAS, six statistical models were compared, as shown in the quantile-quantile plots (Fig. 2). The MLMs (K, PCA+K and Q+K) were significantly better than the GLMs (naive, Q and PCA). Among the MLMs, PCA+K gave the best fit to our data and so it was chosen for the GWAS.
GWAS was conducted by MLM (PCA+K) using the BLUP values across the two trial locations. Eight associated SNPs were detected at P ≤ 0.001 (with −log10(P) ranging from 3.12 to 3.92) on chromosomes 1, 5, 8 and 9, which accounted for 7.73% to 11.18% of the phenotypic variation (Table 2, Fig. 2). To further confirm the eight associated SNPs, we also identified SNPs for KMC that were significant at individual location (either NT or SY). These eight significant SNPs were detected in at least one location (Supplemental Table 2). In addition to the original eight SNPs, one SNP (8_PZE-108103951) was detected only in SY (Supplemental Table 2).
Table 2
QTLs/SNPs were detected for kernel moisture content at harvest stage in this study
| QTL |
SNP |
Bin |
Position |
Alleles |
−log10 (P) |
R2 (%)a |
Reference |
| qKMC1.07 |
1_PZE-101194927 |
1.07 |
241912518 |
A/Cb |
3.15 |
7.85 |
|
| qKMC5.03 |
5_PZE-105042539 |
5.03 |
29708107 |
A/C |
3.12 |
9.74 |
Ho et al. (2002) |
| qKMC5.04 |
5_PZE-105093385 |
5.04 |
135189300 |
A/G |
3.34 |
9.67 |
|
|
5_PZE-105093414 |
5.04 |
135233554 |
A/G |
3.54 |
10.51 |
|
|
5_PZE-105093430 |
5.04 |
135278708 |
A/G |
3.76 |
11.18 |
|
|
5_PZE-105093464 |
5.04 |
135302345 |
A/G |
3.40 |
9.90 |
|
| qKMC8.04 |
8_PZE-108064150 |
8.04 |
114429371 |
A/G |
3.28 |
7.73 |
Blanc et al. (2006) |
| qKMC9.06 |
9_PZE-109105795 |
9.06 |
147893495 |
A/G |
3.21 |
9.23 |
Austin et al. (2000) |
a percentage of phenotypic variance explained; b underlined base stand for favorable alleles.
Given that some associated SNPs occurred within the same LD blocks, the eight associated SNPs were allocated to five QTL regions. These QTLs were named using prefix “qKMC” plus the chromosome bin identifier number (Table 2). Of these, three QTLs, qKMC5.03, qKMC8.04 and qKMC9.06, were overlapping QTL regions previously reported by linkage analysis (see Discussion).
Favorable allele mining
It is necessary to determine which allele is the favorable allele to aid in MAS. Accordingly, the mean values for each allele corresponding to significant SNPs were calculated, based on the BLUP values across the two locations. The favorable alleles of the significant SNPs were mined (Table 2) and 21 haplotypes (each haplotype including at least two lines) were identified across five robust SNPs corresponding to the QTLs (Fig. 3). At group level, among lines harboring 0 to 1 favorable alleles, KMC showed no significant change, while KMC declined significantly when harboring two favorable alleles, as well as the KMC declined linearly with increasing numbers of favorable alleles (Fig. 3). We also found a significant negative correlation between the KMC and the number of favorable alleles in each haplotype (R2 = 0.35, P < 0.01) using linear regression analysis (Fig. 4).
Discussion
Because KMC is vulnerable to environmental factors such as temperature, air humidity and rainfall (Wang and Li 2017), the availability of a reliable methodology to measure KMC at similar times in the different lines and locations is a prerequisite for QTL mapping. In this study, we used a hand-held moisture meter to measure KMC, a method that has been reported to be useful for evaluating genetic materials for QTL mapping (Kebede et al. 2016, Reid et al. 2010, Sala et al. 2006). The 144 maize inbred lines were sown at three dates according to their growth periods, enabling us to measure KMC of each line over similar periods. The phenotypic values showed a significant positive correlation (r2 = 0.71, P < 0.001) between the two locations, indicating good reproducibility of the data.
Although the maize ear is enclosed by husks, moisture in the kernels can evaporate into the air through the husks, and it can also be transported to other plant parts via the cob and stem. Therefore, close correlations might be expected between KMC and some other agronomic traits. Fairly close relationships between KMC and some other traits were identified (Fig. 1b). As expected, KMC exhibited highly significant negative correlation with KDR and moderately significant positive correlation with DTS and DTT, as previously reported (Johnson and Tanner 1972, Li et al. 2000, Sala et al. 2006, Wang and Li 2017), and there was low but significant correlation with HKW, KL and KT. Three husk-related traits (HN, HL and HW) showed positive correlations with KMC, suggesting fewer layers of husk as well as shorter and lighter husks, were associated with greater loss of kernel moisture. KMC was also positively correlated with CD and SD. This was probably because the thicker the cob and stem, the more moisture content they would have. More moisture might then flow into the kernels under the action of water potential difference, resulting in higher KMC. Correlations such as these could be important factors to consider in maize breeding.
Population structure, a key factor for GWAS, may cause significant differences in allelic frequencies within different subpopulations, which may lead to spurious associations as a result of LD between alleles and nearby polymorphisms (Yan et al. 2011). The association mapping panel used in this study was divided into three subpopulations (Supplemental Fig. 1b, 1c); therefore, spurious associations could be expected because of the inherent complexity of the population. To control for false associations, we compared six statistical models and showed that MLM (PCA+K) provided the best reduction in false-positive frequencies (Fig. 2).
The Bonferroni correction is often used in multiple hypothesis testing. At the level of α = 0.05, the threshold of significant association would be at 1.77 × 10⁻⁵, a threshold that none of the loci in this study would achieve. The Bonferroni correction is thought to be a very stringent standard and its applicability in GWAS is debatable (Gupta et al. 2014). As we chose the optimal model to correct for population structure, we believed that most of the spurious loci were readily corrected. Therefore, we selected P ≤ 0.001 (−log10(P) ≥ 3) as the threshold for significant association to either reduce the false-positive frequency or detect a set number of true positive loci, as reported in previous studies (Feng et al. 2016, Hwang et al. 2014, Shi et al. 2014, Vagndorf et al. 2017).
Using the BLUP data set, eight significant associated SNPs were identified at P ≤ 0.001 by the MLM (PCA+K) model and could be converted into five QTLs distributed on chromosomes 1, 5, 8, and 9 (Table 2, Fig. 2). Furthermore, these eight SNPs were validated at each trial location (Supplemental Table 2). Of the five QTLs, three (qKMC5.03, qKMC8.04 and qKMC9.06) have been described previously (Austin et al. 2000, Blanc et al. 2006, Ho et al. 2002), while the remaining two were putatively novel loci. qKMC5.03 was located within a QTL region identified by Ho et al. (2002). qKMC8.04 and qKMC9.06 were consistent with the QTL region identified by Blanc et al. (2006) and Austin et al. (2000), respectively. Interestingly, qKMC5.04 was located in a QTL region for KDR detected by Liu et al. (2010), Sala et al. (2006) and Wang et al. (2012). qKMC9.06 was ~75 kb away from a locus for KDR detected by Zhang et al. (2016). The occurrence of pleiotropic QTL regions better supports the result that KMC is highly significantly correlated with KDR in this and other studies (Johnson and Tanner 1972, Sala et al. 2006, Wang and Li 2017). Given the large genomic region, we cannot be confident whether these two traits are controlled by a single gene that has pleiotropic effects or multiple genes that are tightly linked in these two regions. Thus, further QTL fine mapping may be required.
GWAS has been widely applied for detecting genetic loci for various traits in many crop plants to enhance the efficiency of molecular breeding (Ogura and Busch 2015). The identified favorable alleles and QTLs could be transferred or pyramided into a plant line for genetic improvement by MAS. For example, Liu et al. (2015) transferred a major QTL for KRN (KNR4) into two maize inbred lines using MAS. The lines with introgressed favorable alleles of KNR4 showed KRN improved by almost two rows. Zheng et al. (2017) pyramided three disease-resistance QTLs to enhance resistance to Fusarium crown rot in common wheat. The pyramided lines with three resistant alleles exhibited better resistance than those lines with two, a single or no resistant alleles. Our results showed that as few as two favorable alleles significantly reduced KMC, and each additional favorable allele further reduced KMC (Figs. 3, 4), suggesting that pyramiding of these favorable alleles could reduce KMC effectively.
To keep the kernel quality suitable for mechanical harvesting, the KMC of a maize variety should be less than 27% in Huanghuaihai Plain, a main maize production area of China (Xie et al. 2014). Breeding of varieties with low KMC is possible through selection of maize inbred lines with low KMC (Sweeney et al. 1994). In this study, we identified eight inbred lines harboring favorable alleles that exhibited low KMC (defined as KMC of less than 27%, Supplemental Table 3) and that would be potential elite donor parents for maize genetic improvement. However, two of these eight lines (‘JS06730’ and ‘T1011’) have only two or one favorable alleles (Supplemental Table 3). This phenomenon may be because rare alleles could be missed in this relatively small association mapping panel (Yan et al. 2011).
In summary, GWAS was successfully employed to identify genetic loci for KMC in maize. Eight significant associated SNPs, which could be converted into five QTLs distributed on chromosomes 1, 5, 8, and 9, were identified. The genetic loci and elite inbred lines with low KMC identified in this study will have potential application in maize breeding.
Acknowledgments
This study was supported by the Natural Science Foundation of Jiangsu Province, China (BK20171252), the Scientific and Technological Project of Nantong City, China (MS12015086), and the Key Research and Development Program of Jisngsu Province, China (BE2017365-6). We thank Huw Tyson, PhD, from Liwen Bianji, Edanz Editing China (www.liwenbianji.cn/ac), for editing the English text of a draft of this manuscript.
Literature Cited
- Austin, D.F., M. Lee, L.R. Veldboom and A.R. Hallauer (2000) Genetic mapping in maize with hybrid progeny across testers and generations: grain yield and grain moisture. Crop Sci. 40: 30–39.
- Beavis, W.D., O.S. Smith, D. Grant and R. Fincher (1994) Identification of quantitative trait loci using a small sample of topcrossed and F4 progeny from maize. Crop Sci. 34: 882–896.
- Blanc, G., A. Charcosset, B. Mangin, A. Gallais and L. Moreau (2006) Connected populations for detecting quantitative trait loci and testing for epistasis: an application in maize. Theor. Appl. Genet. 113: 206–224.
- Bradbury, P.J., Z. Zhang, D.E. Kroon, T.M. Casstevens, Y. Ramdoss and E.S. Buckler (2007) TASSEL: software for association mapping of complex traits in diverse samples. Bioinformatics 23: 2633–2635.
- Collard, B.C. and D.J. Mackill (2008) Marker-assisted selection: an approach for precision plant breeding in the twenty-first century. Philos. Trans. R. Soc. Lond., B, Biol. Sci. 363: 557–572.
- Cui, Z.H., J.H. Luo, C.Y. Qi, Y.Y. Ruan, J. Li, A. Zhang, X.H. Yang and Y. He (2016) Genome-wide association study (GWAS) reveals the genetic architecture of four husk traits in maize. BMC Genomics 17: 946.
- Dai, L.Q., L. Wu, Q.S. Dong, Z. Zhang, N. Wu, Y. Song, S. Lu and P.W. Wang (2017) Genome-wide association study of field grain drying rate after physiological maturity based on a resequencing approach in elite maize germplasm. Euphytica 213: 182.
- Evanno, G., S. Regnaut and J. Goudet (2005) Detecting the number of clusters of individuals using the software STRUCTURE: a simulation study. Mol. Ecol. 14: 2611–2620.
- Feng, Y., Q. Lu, R.R. Zhai, M.C. Zhang, Q. Xu, Y.L. Yang, S. Wang, X.P. Yuan, H.Y. Yu, Y.P. Wang et al. (2016) Genome wide association mapping for grain shape traits in indica rice. Planta 244: 819–830.
- Frascaroli, E., M.A. Canè, P. Landi, G. Pea, L. Gianfranceschi, M. Villa, M. Morgante and M.E. Pè (2007) Classical genetic and quantitative trait loci analyses of heterosis in a maize hybrid between two elite inbred lines. Genetics 176: 625–644.
- Ganal, M.W., G. Durstewitz, A. Polley, A. Berard, E.S. Buckler, A. Charcosset, J.D. Clarke, E.-M. Graner, M. Hansen, J. Joets et al. (2011) A larger maize (Zea mays L.) SNP genotyping array: development and germplasm genotyping, and genetic mapping to compare with B73 reference genome. PLoS ONE 6: e28334.
- Gupta, P.K., P.L. Kulwal and V. Jaiswal (2014) Association mapping in crop plants: opportunities and challenges. Adv. Genet. 85: 109–147.
- Hallauer, A.R., M.J. Carena and J.B.M. Filho (2010) Quantitative genetics in maize breeding, 6th edn. Springer, Iowa.
- Hardy, O.J. and X. Vekemans (2002) SPAGeDi: a versatile computer program to analyse spatial genetic structure at the individual or population levels. Mol. Ecol. Res. 2: 618–620.
- Hawbaker, M.S., W.H. Hill and M.M. Goodman (1997) Application of recurrent selection for low grain moisture content at harvest in tropical maize. Crop Sci. 37: 1650–1655.
- Ho, J., S. McCouch and M. Smith (2002) Improvement of hybrid yield by advanced backcross QTL analysis in elite maize. Theor. Appl. Genet. 105: 440–448.
- Hwang, E.Y., Q.J. Song, G.F. Jia, J.E. Specht, D.L. Hyten, J. Costa and P.B. Cregan (2014) A genome-wide association study of seed protein and oil content in soybean. BMC Genomics 15: 1.
- Johnson, D.R. and J.W. Tanner (1972) Calculation of the rate and duration of grain filling in corn (Zea mays L.). Crop Sci. 12: 485–486.
- Kebede, A.Z., T. Woldemariam, L.M. Reid and L.J. Harris (2016) Quantitative trait loci mapping for Gibberella ear rot resistance and associated agronomic traits using genotyping-by-sequencing in maize. Theor. Appl. Genet. 129: 17–29.
- Li, L.L., X.P. Lei, R.Z. Xie, K.R. Wang, P. Hong, F.G. Zhang and S.K. Li (2017) Analysis of influential factors on mechanical grain harvest quality of summer maize. Sci. Agric. Sin. 50: 2044–2051.
- Li, Y.J., J.M. Shi, C.M. Ju and J. Zhu (2000) A preliminary study on the correlation between grain water content and varieties traits in maize. J. Maize Sci. 8: 37–38.
- Liu, K. and S.V. Muse (2005) PowerMarker: an integrated analysis environment for genetic marker analysis. Bioinformatics 21: 2128– 2129.
- Liu, L., Y.F. Du, X.M. Shen, M.F. Li, W. Sun, J. Huang, Z.J. Liu, Y.S. Tao, Y.L. Zheng, J.B. Yan et al. (2015) KRN4 controls quantitative variation in maize kernel row number. PLoS Genet. 11: e1005670.
- Liu, X.J., Z.H. Wang, X. Wang, T.F. Li and L. Zhang (2010) Primary mapping of QTL for dehydration rate of maize kernel after physiological maturing. Acta Agron. Sin. 36: 47–52.
- Melchinger, A.E., H.F. Utz and C.C. Schön (1998) Quantitative trait locus (QTL) mapping using different testers and independent population samples in maize reveals low power of QTL detection and large bias in estimates of QTL effects. Genetics 149: 383–403.
- Mihaljevic, R., H.F. Utz and A.E. Melchinger (2004) Congruency of quantitative trait loci detected for agronomic traits in testcrosses of five populations of European maize. Crop Sci. 44: 114–124.
- Mihaljevic, R., H.F. Utz and A.E. Melchinger (2005) No evidence for epistasis in hybrid and per se performance of elite european flint maize inbreds from generation means and qtl analyzes. Crop Sci. 45: 2605–2613.
- Nei, M. (1972) Genetic distance between populations. Am. Nat. 106: 283–292.
- Ogura, T. and W. Busch (2015) From phenotypes to causal sequences: using genome wide association studies to dissect the sequence basis for variation of plant development. Curr. Opin. Plant Biol. 23: 98–108.
- Pritchard, J.K., M. Stephens and P. Donnelly (2000) Inference of population structure using multilocus genotype data. Genetics 155: 945–959.
- Reid, L.M., X. Zhu, M.J. Morrison, T. Woldemariam, C. Voloaca, J. Wu and K. Xiang (2010) A non-destructive method for measuring maize kernel moisture in a breeding program. Maydica 55: 163–171.
- Sala, R.G., F.H. Andrade, E.L. Camadro and J.C. Cerono (2006) Quantitative trait loci for grain moisture at harvest and field grain drying rate in maize (Zea mays L.). Theor. Appl. Genet. 112: 462–471.
- Sala, R.G., F.H. Andrade and J.C. Cerono (2012) Quantitative trait loci associated with grain moisture at harvest for line per se and testcross performance in maize: a meta-analysis. Euphytica 185: 429–440.
- Sentz, J.C. (1971) Genetic variances in a synthetic variety of maize estimated by two mating designs. Crop Sci. 11: 234–238.
- Shi, L.Y., X.L. Lv, J.F. Weng, H.Y. Zhu, C.L. Liu, Z.F. Hao, Y. Zhou, D.G. Zhang, M.S. Li, X.K. Ci et al. (2014) Genetic characterization and linkage disequilibrium mapping of resistance to gray leaf spot in maize (Zea mays L.). Crop J. 2: 132–143.
- Song, W., Z. Shi, J.F. Xing, M.X. Duan, A.G. Su, C.H. Li, R.Y. Zhang, Y.X. Zhao, M.J. Luo, J.D. Wang et al. (2017) Molecular mapping of quantitative trait loci for grain moisture at harvest in maize. Plant Breed. 136: 28–32.
- Sweeney, P.M., S.K. Martin and C.P. Clucas (1994) Indirect inbred selection to reduce grain moisture in maize hybrids. Crop Sci. 34: 391–396.
- Vagndorf, N., N.H. Nielsen, V. Edriss, J.R. Andersen, J. Orabi, L.N. Jørgensen and A. Jahoor (2017) Genomewide association study reveals novel quantitative trait loci associated with resistance towards Septoria tritici blotch in North European winter wheat. Plant Breed. 136: 474–482.
- Vieira, R.D., L. Minohara, N.M. Carvalho and M.C.M. Bergamaschi (1995) Relationship of black layer and milk line development on maize seed maturity. Sci. Agric. 52: 142–147.
- Wang, K.R. and S.K. Li (2017) Analysis of influence factors on kernel dehydration rate of maize hybrids. Sci. Agric. Sin. 50: 2027–2035.
- Wang, Z., X. Wang, L. Zhang, X.J. Liu, H. Di, T.F. Li and X.C. Jin (2012) QTL underlying field grain drying rate after physiological maturity in maize (Zea Mays L.). Euphytica 185: 521–528.
- Xiang, K., L.M. Reid, Z.M. Zhang, X.Y. Zhu and G.T. Pan (2012) Characterization of correlation between grain moisture and ear rot resistance in maize by QTL meta-analysis. Euphytica 183: 185–195.
- Xie, R.Z., X.P. Lei, K.R. Wang, Y.Q. Guo, Z.W. Chai, P. Hou and S.K. Li (2014) Research on corn mechanically harvesting grain quality in Huanghuaihai Plain. Crops 2: 76–79.
- Yan, J.B., M. Warburton and J. Crouch (2011) Association mapping for enhancing maize (Zea mays L.) genetic improvement. Crop Sci. 51: 433–449.
- Yang, X.H., S.B. Gao, S.T. Xu, Z.X. Zhang, B.M. Prasanna, L. Li, J.S. Li and J.B. Yan (2011) Characterization of a global germplasm collection and its potential utilization for analysis of complex quantitative traits in maize. Mol. Breed. 28: 511–526.
- Yu, J.M. and E.S. Buckler (2006) Genetic association mapping and genome organization of maize. Curr. Opin. Biotechnol. 17: 155–160.
- Zhang, J., J.J. Guo, Y. Liu, D.M. Zhang, Y.F. Zhao, L.Y. Zhu, Y.Q. Huang, Z.Q. Zhang and J.T. Chen (2016) Genome-wide association study identifies genetic factors for grain filling rate and grain drying rate in maize. Euphytica 212: 201–212.
- Zheng, Z., S. Gao, M.X. Zhou, G.J. Yan and C.J. Liu (2017) Enhancing Fusarium crown rot resistance by pyramiding large-effect QTL in common wheat (Triticum aestivum L.). Mol. Breed. 37: 107.
- Zhou, G.F., D.R. Hao, G.Q. Chen, H.H. Lu, M.L. Shi, Y.X. Mao, Z.L. Zhang, X.L. Huang and L. Xue (2016) Genome-wide association study of the husk number and weight in maize (Zea mays L.). Euphytica 210: 195–205.