Notes
Molecular identification of the causal locus for the petaloid phenotype in Daucus carota
2019 Volume 69 Issue 1 Pages 186-188


Details
2019 Volume 69 Issue 1 Pages 186-188
Homeotic alteration phenotype of the flowers in Daucus carota are widely used for hybrid breeding, consequently molecular markers tightly-linked to such phenotype are in demand. Here we report the identification of a gene locus responsible for the phenotypic expression of stamen conversion into a petal-like structure, or petaloid. Using a segregating population and sequencing analysis of two bulked populations, we discovered a large contributing peak on the long arm of chromosome 4. DcMADS2, a homolog of the B-class floral homeotic gene PISTILLATA, found at the center of the peak region, was considered the strongest candidate causal gene. We established PCR primers that could be used to distinguish the two DcMADS2 alleles linked to each petaloid- and non-petaloid-phenotype.
Genetics of male sterility expression in Daucus carota (carrot) is known to be complicated (Kozik et al. 2012). In this species, two different types of cytoplasmic male sterility (CMS) are known. Formation of brownish unfertile anthers, commonly known as the brown-anther sterility phenotype, is one such trait being utilized in F1 hybrid breeding programs. Conversion of stamens into petal-like or carpel-like structures, known as the petaloid or carpeloid, is another type of male-sterility known in this species (Fig. 1A) (Linke et al. 2003). This phenotype is expressed as a result of nuclear-cytoplasmic genotype interaction. The cytoplasmic genotypes of the two-types are known to be distinct. Different genetic models with the involvement of at least two genetic loci in the expression of petaloid in carrots have been proposed by past studies (Banga et al. 1964, Kozik et al. 2012). Furthermore, expression of the CMS phenotype is reported to be influenced by environmental backgrounds such as high temperatures (Wolyn and Chahal 1998). Therefore, molecular markers that enable genetic diagnosis of the male-sterility phenotype are invaluable in carrot breeding.
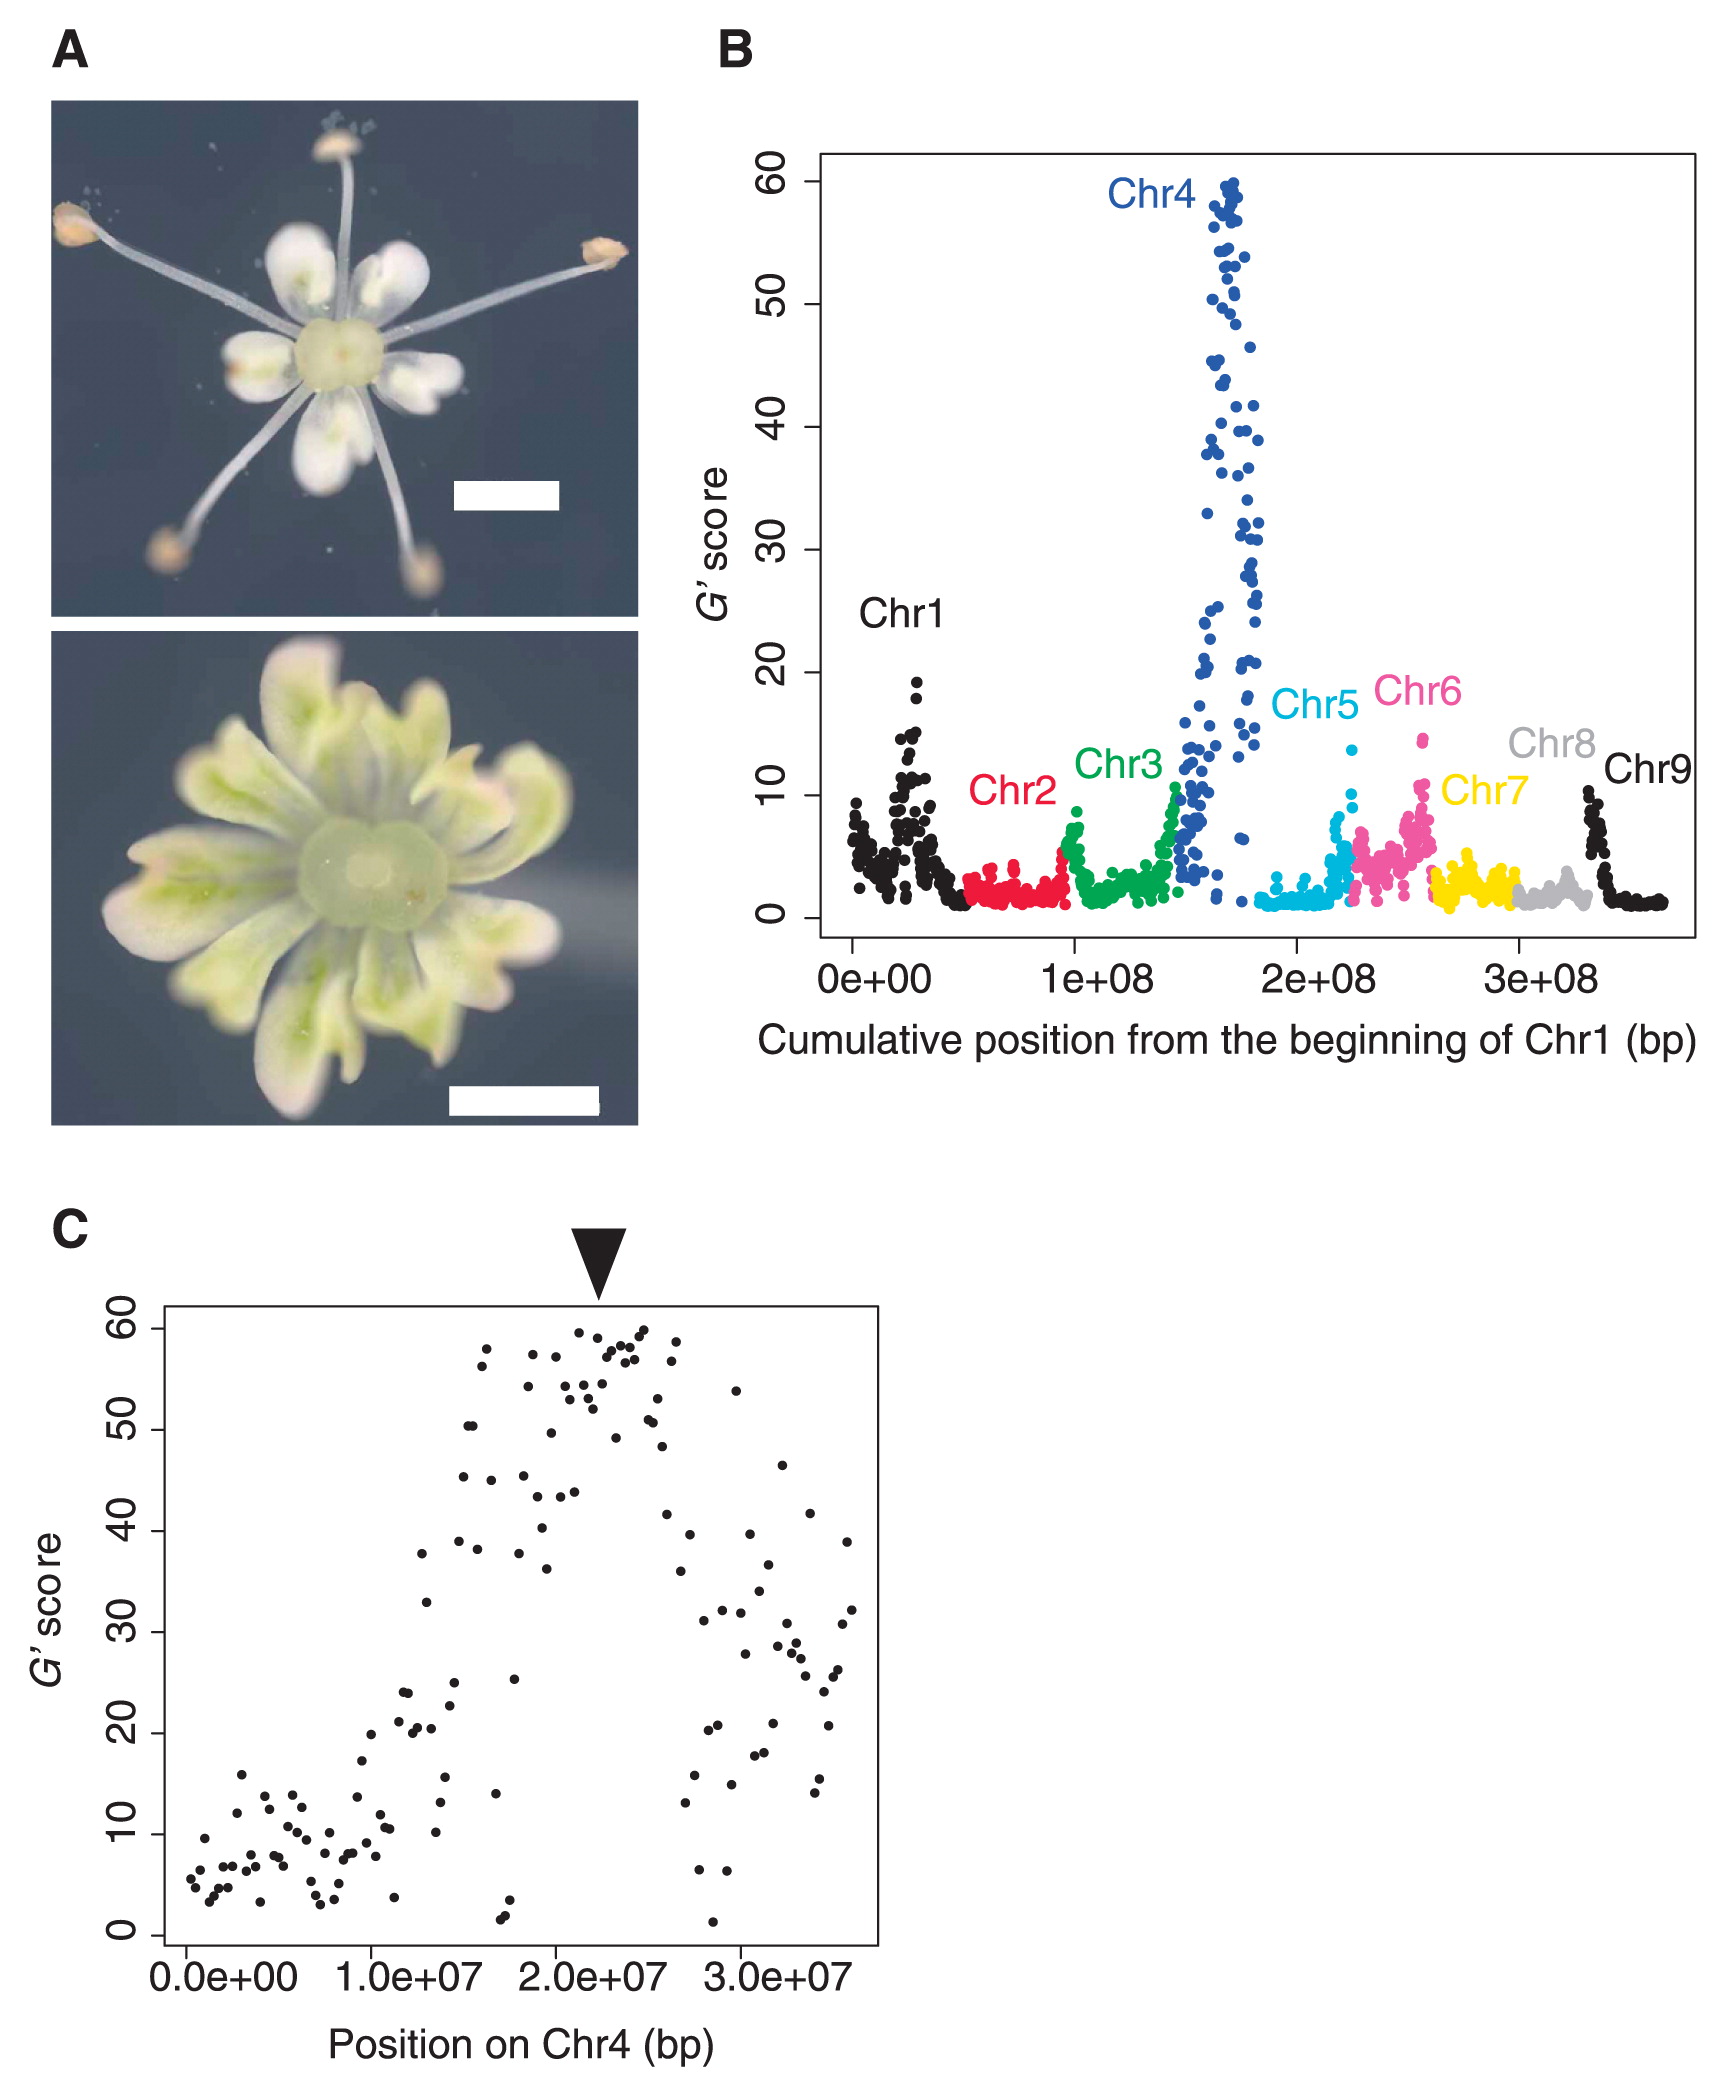
QTLseq analysis of the petaloid phenotype. A) Representative photo images of the flowers from fertile (upper panel) and male-sterile (lower panel) individuals. Scale bars: 1 mm. B) The result of the QTLseq analysis. Each plot represents a SNP window. C) Detailed view of the QTLseq analysis for chromosome 4. Arrowhead indicates the approximate location of the DcMADS2 gene.
Recently, gene identification is facilitated by high-throughput sequencing technology. Notably, identification of the quantitative trait loci using bulked-segregant analysis, or QTLseq, is becoming a powerful strategy for the discovery of causal genetic loci of a phenotype (Takagi et al. 2013). Here we employed the QTLseq approach to identify the causal gene locus of the petaloid phenotype in carrots.
We used a segregated population obtained from a cross between a petaloid strain (YSN6MS) and a fertile individual spontaneously found in the green house of Yamato Noen Co. Ltd. (YSN6spF). Carrots were grown in a field at Tenri, Japan during 2015. Leaves from fifteen individuals from each of the fertile (F) and male-sterile (MS) populations were sampled.
Sequence analysisDNA from the bulked leaves was extracted by using the DNeasy Plant mini kit (Qiagen) following the manufacturer’s protocol. The library preparation and sequence run were conducted by Macrogen (Seoul, Korea). The TruSeq DNA PCR-Free kit (Illumina) was used to prepare libraries. Paired end reads were prepared and a sequence run performed using the HiSeq X Ten platform. Raw sequence data files were deposited to the National Center for Biotechnology Information Sequence Read Archive (NCBI-SRA: https://www.ncbi.nlm.nih.gov/sra) under ID SRP155318.
Sequence analysis and variant callingMapping of the reads to the Daucus carota genome assembly (in NCBI under accession ID: PRJNA268187) was done using the BWA program (Li and Durbin 2009). Variant calling was conducted using samtools software (Li et al. 2009).
QTLseq analysisSingle nucleotide polymorphisms (SNPs) shared between the two populations were selected using a custom perl script. SNPs with a coverage depth between 75 to 225 were used for further analysis. We used the G′ score based statistical framework proposed in a previous study (Magwene et al. 2011) to detect QTLs. G′ is a modified version of G statistic scores that calculates the SNP segregation distortion between the two segregant bulks. The window size for the G′ calculation was set at 500 kilo-base-pair (kbp), and the distance between the adjacent window was set at 250 kbp. The G′ score was calculated using a custom perl script. Series of scripts used for this workflow are deposited in Open Science Framework (https://osf.io). Manhattan plots were created using the R software (R Core Team 2017).
PCR Restriction Fragment Length Polymorphism (PCR-RFLP) analysisA pair of PCR primers (5′-GGGATATTACAGGCTCTCAGCAATG-3′/5′-TTAGGCTGCAAGCGGAAGGCAAAG-3′) were designed for the PCR amplification of the region surrounding the DraI site on position 22,416,901 of chromosome 4. Tks Gflex DNA Polymerase (TaKaRa) with the following PCR routine: 94°C 1 min; (98°C 10 sec, 55°C 15 sec, 68°C 30 sec) × 35 cycles; 68°C 5 min, was used to amplify the PCR fragment. Five μl of the PCR product was digested by 0.2 μl of DraI (15 U/μl, TaKaRa) with incubation at 37°C for two hours. PCR products were electrophoresed on a 1% agarose gel.
We obtained ca. 417 million and ca. 536 million reads from the F and MS bulks via the deep-sequencing runs, respectively. Mean coverage depths of the carrot genome were 132.90 and 169.05 for the F and MS bulks, respectively. Detailed statistics for the sequencing results are presented in Table 1. The total number of SNPs called were 6,836,994 for the F bulk, and 6,629,607 for the MS bulk (Table 1). From the QTLseq analysis, we detected the strongest contributing peak on the long arm of chromosome 4, at approximately the 17.50 to 27.75 mega-base-pair (mbp) position on the pseudomolecule (Fig. 1B, 1C). The window in the center of the peak harbored SNPs between the 22.25 and 22.75 mbp position on the pseudomolecule of chromosome 4 (Fig. 1C).
| Sample | Total reads | Mapped reads | Mean depth | Number of SNPs |
|---|---|---|---|---|
| F | 417,577,082 | 368,311,807 | 132.9 | 6,836,994 |
| MS | 536,062,242 | 468,086,107 | 169.05 | 6,629,607 |
We hypothesized that a causal gene for the petaloid phenotype is related to the B-class floral homeotic gene. To identify such a candidate, we used the protein sequences of 1,296 gene models within this 17.50 to 27.75 mbp region for BLAST searches against the Arabidopsis thaliana proteins. As a result, we found a gene (LNRQ01000004.1_prot_KZM98268.1_1702 in the Daucus carota genome assembly PRJNA268187) with a homology against A. thaliana AT5G20240, or the PISTILATA gene (Piwarzyk et al. 2007). The genomic region of this gene spanned from 22,416,479 to 22,417,257 bp region of the pseudochromosome, which is approximately at around the center of this QTL region, meeting the criteria of a suitable candidate. This gene was named as DcMADS2 by a previous study, and was found to be down-regulated in the carpeloid CMS flower (Linke et al. 2003). It is possible that DcMADS2 is the causal gene for the petaloid phenotype investigated in this study.
We searched manually for a SNP by assessing changes in the restriction enzyme digestion patterns within the DcMADS2 genic region. We found a DraI site on position 22,416,901 bp of chromosome 4 in the MS bulk, whereas a series of SNPs were found on this site in the F bulk. To enable detection of PCR-RFLP, we designed PCR primers that could amplify the DNA fragment surrounding this site. As expected, DraI-treatment yielded complete digestion of the PCR fragments from an MS individual, whereas a mixture of digested and undigested bands from an F individual was detected (Fig. 2).
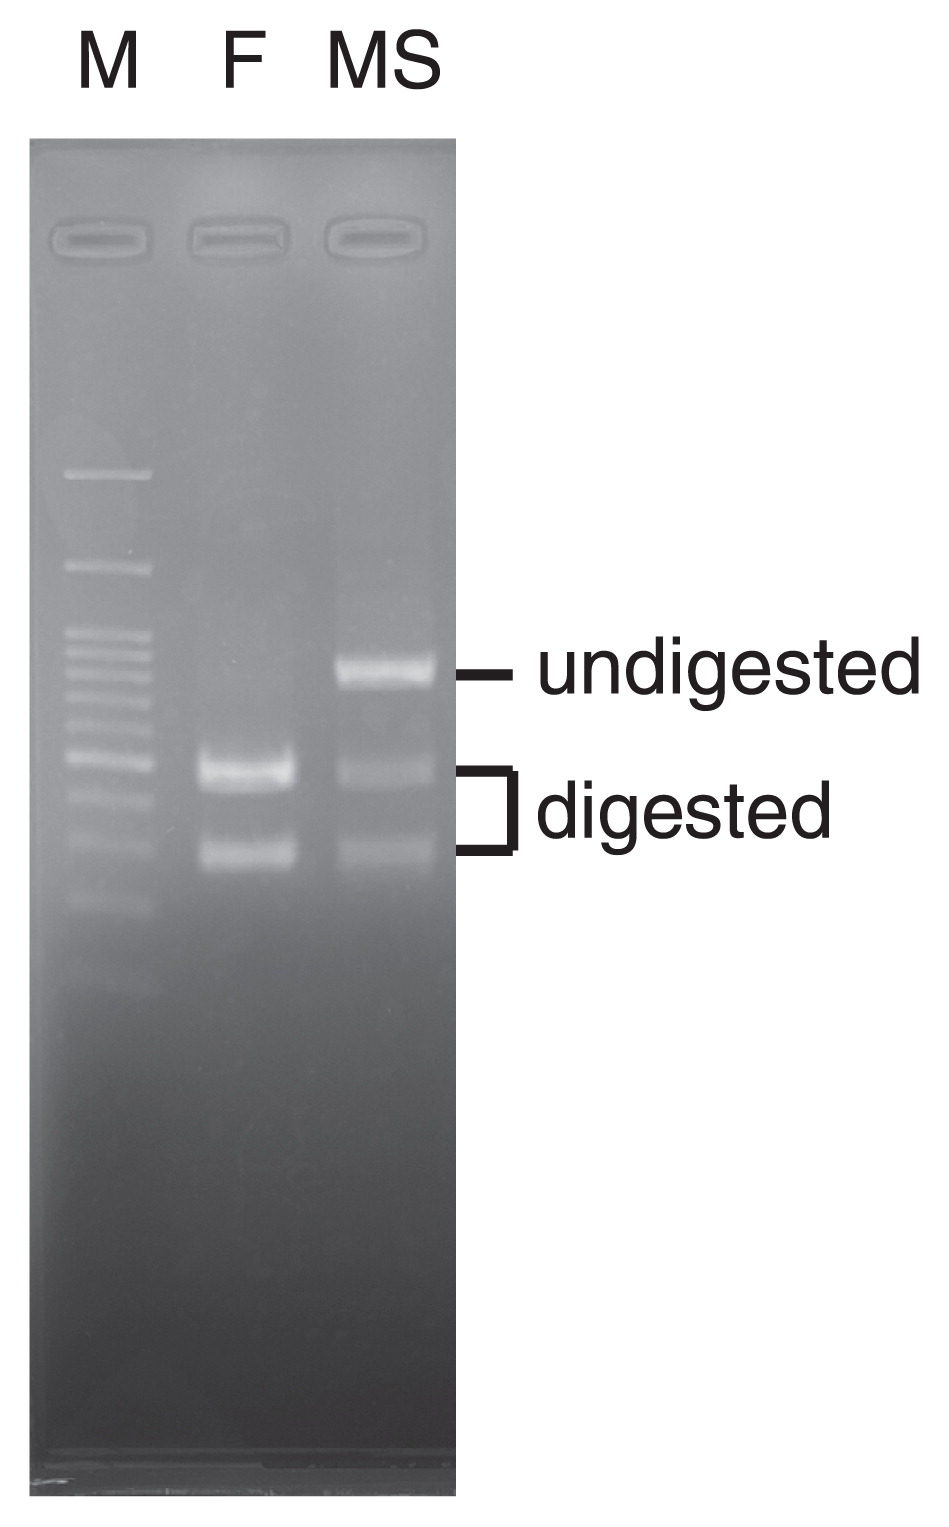
The PCR-RFLP analysis of DcMADS2. M indicates a 100-bp-sized DNA ladder marker. F: fertile individual. MS: male-sterile individual. Restriction enzyme DraI was used to digest the PCR product.
In this study we found the QTL responsible for the carrot petaloid phenotype analyzed in this study. It is possible that this QTL is related to the petaloid previously reported as the phenotype of CMS. However, the locus we identified is distinct from the fertility restorer locus previously reported on chromosome 9 (Alessandro et al. 2013). Breeding programs should benefit from the DNA marker established in this study. Future studies may aim to clarify the role of DcMADS2 in the expression of the petaloid phenotype.
We thank M. Okamura, M. Niidome and M. Tsuda for technical assistance. This work was supported in part by Grants-in-Aid for Scientific Research on Innovative Areas (16H01467, 18H04776 to S.F.), Grants-in-Aid for Scientific Research (18H02456 to S.F.), Grant-in-Aid for Challenging Exploratory Research (15K14626 to S.F.) from the Ministry of Education, Culture, Sports, Science and Technology of Japan (MEXT) and Japan Science and Technology Agency (JST) PRESTO program (JPMJPR16Q8) to S.F..