Abstract
THICK TASSEL DWARF1 (TD1) is a critical gene that negatively modulates meristem size during maize inflorescence development and may also regulate ear-related traits. In the present study, the whole genomic DNA sequences and the promoter regions of TD1 were analyzed in 165 diverse maize inbred lines. Polymorphism analysis identified 39 SNPs and five InDels in the genic region of TD1 and allowed 23 haplotypes to be classified. Among these sites, eight SNPs and one InDel were significantly associated with kernel number (KN) (p < 0.05), seven SNPs and one InDel were significantly associated with kernel number per row (KNPR) (p < 0.05), and three SNPs were significantly associated with kernel row number (KRN) (p < 0.05). In addition, 21 SNPs and 14 InDels were identified in the promoter regions of TD1, and two SNPs and seven InDels of these sites were found to be significantly associated with KRN (p < 0.05). The results denote that Hap_7 was the favorable haplotype for both KN and KNPR, and Hap_2 was the elite haplotype for KRN. These favorable haplotypes could be utilized in molecular marker-assisted selection (MAS) to improve KN, KNPR, or KRN, and thereby further increase grain yield in maize breeding programs.
Introduction
Maize (Zea mays L.) is one of the most extensively cultivated crops worldwide and plays a vital role in ensuring food security, so improving its grain yield is a primary goal in maize breeding. Kernel number (KN), kernel weight (KW), and ear number per unit area are three major components of grain yield in maize. The KN trait is determined by kernel number per row (KNPR) and kernel row number (KRN), which are two primary maize breeding targets. Both KNPR and KRN are determined during maize inflorescence development (Brown et al. 2011).
Normally, during the development of the maize inflorescence, a shoot apical meristem is converted to an inflorescence meristem (IM), which then further develops branch meristems, spikelet meristems, and floral meristems and undergoes further differentiation (Pautler et al. 2013, Tanaka et al. 2013). The CLAVATA (CLV)-WUSCHEL (WUS) negative-feedback loop is the principal mechanism of shoot apical meristem homeostasis in angiosperms, which was first reported in Arabidopsis two decades ago (Schoof et al. 2000). The CLA and WUS genes are negative and positive regulators of plant meristematic stem cells, respectively; the clv mutation results in the early termination of meristems, while the wus mutation leads to an over-accumulation of stem cells (Pautler et al. 2013). CLV1 encodes a leucine-rich repeat receptor-like kinase (LRR-RLK) and CLV2 encodes a leucine-rich repeat receptor-like protein. The CLV protein complex can suppress the expression of WUS (Clark et al. 1997, Jeong et al. 1999). As the CLV-WUS feedback loop is relatively conserved among plants in the Gramineae, many orthologs in this pathway have been reported in maize. For example, by combining QTL mapping and mutant analysis, FASCIATED EAR2 was identified as a homolog of CLV2 in Arabidopsis that functions to regulate the size of the IM and thus KRN in maize (Bommert et al. 2013). Similarly, THICK TASSEL DWARF1 (TD1) in maize has been identified as an ortholog of Arabidopsis CLV1 with 58% amino acid identity (Lunde and Hake 2009). The TD1 protein has two major domains: an LRR-RLK domain and a kinase domain. In addition, TD1 plays a significant role in the CLV-WUS pathway in the dominant negative regulation of IM size during inflorescence development. In addition, the double mutant td1/fea2 presents a synergistic phenotype compared to that of either single mutant, which indicates that TD1 might function in a different pathway than does FASCIATED EAR2. Mutations in TD1 cause unusual IM enlargement and an abnormal ear phenotype. Therefore, TD1 might be associated with KNPR and KRN, and thereby with KN. Although TD1 functions in CLV signaling to affect ear development, which in turn, could influence ear-related traits, it has not been used in maize breeding programs because most of the studies analyzing its function were based on relatively extreme mutants (Bommert et al. 2005).
Association analysis is an approach used to identify relationships between target traits and genetic markers and candidate genes in a population (Flint-Garcia et al. 2003). Two major association strategies include genome-wide association studies and candidate gene association analyses (Flint-Garcia et al. 2005). In recent years, candidate gene association analysis has become popular for identifying favorable alleles and haplotypes for various traits in maize. For example, based on this strategy, Dwarf8, which is involved in the gibberellic acid metabolism pathway, was identified as a key gene associated with plant height in maize (Thornsberry et al. 2001). In addition, ZmIPT2 was confirmed to be significantly associated with kernel weight (KW), and the favorable haplotype of ZmIPT2-T can now be used in MAS for selection of high-KW varieties (Weng et al. 2013).
The genetic mechanism of development of maize inflorescence traits has long been studied in regard to yield improvement, but most of these studies have involved classical mutant analysis (Li et al. 2018). Therefore, in this study, we will analyze the role of natural variation in the TD1 locus in the regulation of maize ear-related traits. The present study focuses on (i) analyzing the nucleotide polymorphisms in the TD1 gene and promoter regions and identifying TD1 haplotypes; (ii) performing association analysis between TD1 and KN, KNPR, and KRN in 165 inbred lines across four environments to identify favorable allelic variants for these traits and to calculate linkage disequilibrium (LD) values to determine the relationship between each allele; and (iii) investigating the elite haplotypes of KN, KNPR, and KRN to guide the genetic improvement of maize grain yield.
Materials and Methods
Plant materials, experimental design, and analysis of phenotypic data
In the present study, 165 diverse inbred lines were used for candidate gene association mapping. These lines were chosen from five typical maize-growing regions in China and represent most of the commercial hybrid maize parents developed in China (Su et al. 2011). These lines were subdivided according to their relationships to seven heterotic groups, including 20 lines from BSSS (American BSSS including Reid), 27 lines from PA (group A germplasm derived from a modern U.S. hybrid in China), 23 lines from PB (group B germplasm derived from a modern U.S. hybrid in China), 33 lines from Lan (Lancaster Surecrop), 28 lines from LRC (derivative lines from Lvda Reb Cob, a Chinese landrace), 30 lines from SPT (lines derived from Sipingtou, a Chinese landrace), and four lines of unknown pedigree (Liu et al. 2015a).
All of the data for KN, KNPR, and KRN were collected at Sanya in 2007 (EA1) and Sanya in 2008 (EA2) in Hainan Province, and at Shunyi in 2011 (EB1) and Shunyi in 2012 (EB2) in Beijing. The trial was implemented as a randomized complete-block design. Three replications of 17 plants from each line were planted in 4.5m rows 0.6m apart. General maize cultural practices were carried out during this trial. KN, KNPR, and KRN were calculated from five randomly selected mature ears with water content less than 13%. The data for analysis were the mean phenotypic values of each plot over three replications in each environment. Analysis of variance for KN, KNPR, and KRN was conducted using the “aov” function in R software (https://www.r-project.org/) with year defined as a fixed effect. Broad-sense heritability (H2) of maize ear-related traits across four environments was calculated based on the methods in Knapp et al. (1985) using the formula
H
2
=
σ
g
2
/
(
σ
g
2
+
σ
g
e
2
/
e
+
σ
2
/
e
×
r
), where
σ
g
2 represents genetic variance,
σ
g
e
2 is the genotype × environment interaction, σ 2 is the error variance, e represents the number of environments, and r is the number of replications per environment. Correlations between KN, KNPR, and KRN were calculated using the “corrplot” package in R software.
DNA extraction, PCR amplification, and DNA sequencing
Fresh leaves were collected from plants of each inbred line and genomic DNA was extracted using the CTAB method (Murray and Thompson 1980). Primers were designed based on the published TD1 gene and promoter sequences (Accession number LOC103626458 (NCBI GenBank (https://www.ncbi.nlm.nih.gov))) (Supplemental Table 1) and the sequences were then amplified from each of the 165 inbred lines. Each 50 μL PCR reaction mixture was assembled on ice and was composed of 200 ng genome DNA, 25 μL 2× PCR buffer for KOD FX DNA polymerase (all PCR reagents from Toyobo, Japan), 10 μL 2 mM dNTPs, 1 μL 1.0 U/μL KOD FX, 1 μL 100 ng/μL of each forward and reverse primer and the volume was completed with double distilled water. PCR was implemented using the following conditions: initial denaturing at 94°C for 2 min; then 36 cycles of 98°C for 10 s, annealing at 58°C for 30 s, and 68°C for 3 min; followed by final extension at 68°C for 10 min; and then holding at 4°C using a PTC-200 thermal cycler (Bio-Rad, California, USA). All PCR products were cloned into the pEASY vector (Transgen Biotech, Beijing) and sequenced by the Qingke Biological Company, Beijing.
Analysis of genotypic data
The DNA sequences of the TD1 gene and promoter regions from 165 inbred lines were sequenced (MK060690-MK060854 (NCBI Genebank)). Alignment of these sequences for all 165 lines was performed using ClustalX 2.0 (Larkin et al. 2007). Nucleotide diversity (π) in the TD1 gene and promoter regions was estimated as the mean number of nucleotide differences per site between sequences (Nei and Li 1979) using DNASP 5.0 (Librado and Rozas 2009, Rozas 2009). The data of SNP markers in chromosome 5 were from the MaizeSNP50 BeadChip (Illumina, Inc.). The sliding window was made by DNASP 5.0 with a window size of 100 sites and step size of 25 sites.
Association and LD analyses
Analysis of associations between the candidate TD1 gene and promoter region sequences and the phenotypic means for KN, KNPR, and KRN collected from the 165 inbred lines in different environments was performed using TASSEL 5.0 (https://tassel.bitbucket.io). Minor single nucleotide polymorphisms (SNPs) and insertions and deletions (InDels) were filtered out using a criterion for minor allele frequency <5%. A mixed linear model that accounts for both population structure and relative kinship among these 165 lines was used for association mapping to considerably decrease false-positive associations (Yu et al. 2006). Estimates of population structure and relative kinship were generated using STRUCTURE v2.3.4 (http://web.stanford.edu/group/pritchardlab/structure_software/release_versions/v2.3.4/html/structure.html) (Pritchard et al. 2000a, 2000b) and SPAGeDi (http://ebe.ulb.ac.be/ebe/SPAGeDi.html) software, respectively. Significant associations were defined for polymorphic sites with p < 0.05. Polymorphic sites significantly associated with a trait that were detected in more than one environment were identified as stable associations for the following analysis. LD was estimated between all pairs of polymorphic sites within the sequenced regions of TD1. The LD heatmap and r2 values were generated using Haploview 4.2 (Barrett et al. 2005).
Haplotype classification and tests of association of haplotypes with phenotypic values in each environment
Haplotype classification was conducted based on all of the polymorphic sites in the TD1 gene region using Haploview 4.2 software (Barrett et al. 2005). Tests of the significance of associations between the phenotypic values for KN, KNPR, and KRN in each environment and each haplotype were carried out using t-tests computed in Microsoft Excel (Microsoft Office, Washington, USA, 2013).
Results
Phenotypic analysis of ear-related traits
The analysis indicated that phenotypic values for all traits were normally distributed (Supplemental Fig. 1). Moreover, analysis of variance results indicated significant phenotypic variation in KN, KNPR, and KRN (p < 0.01) among the 165 inbred lines. Such phenotypic variation revealed that this population would be suitable for association analysis (Table 1). In all of the lines analyzed, KN values ranged from 93.30 to 613.33 and KNPR values varied from 7.44 to 40.00. The line with the lowest KRN, 7.60 rows, was from the PA group, while the line with the highest KRN, 22.00 rows, was from the LRC the group. Further, a negative correlation was observed between values of KNPR and KRN in all four environments (Supplemental Fig. 2).
Table 1
Analysis of variance for kernel number, kernel number per row, and kernel row number
| Source of variation |
KNa |
KNPR |
KRN |
| Genotype |
8.29E-34**b |
1.92E-43** |
1.56E-49** |
| Environment |
5.24E-10** |
7.95E-12** |
3.80E-02* |
| Genotype × Environment |
1.5E-102** |
2.00E-99** |
6.46E-113** |
| Residual variance |
1631.996 |
5.0106 |
0.9253 |
| Heritability |
83.21% |
85.37% |
86.98% |
a KN, kernel number; KNPR, kernel number per row; KRN, kernel row number.
b ** indicates
p < 0.01; * indicates
p < 0.05.
The genomic DNA sequences of TD1 and its promoter regions from 165 inbred lines were sequenced and analyzed for nucleotide diversity and a total of 60 SNPs and 19 InDels were identified. Among these polymorphic sites, 21 SNPs and 14 InDels were located within the TD1 promoter regions, and 35 SNPs and three InDels were located in exon_1. None of the three InDels led to a frame shift mutation. Three SNPs were located in exon_2, one InDel was located in an intron, two SNPs were found in the 3′ untranslated region (UTR), and no polymorphic sites were identified in the 5′ UTR (Table 2).
Table 2
Summary of nucleotide and allelic diversity in the
TD1 gene and promoter regions
| Parameters |
Promoter |
5′ UTR |
Exon_1 |
Intron |
Exon_2 |
3′ UTR |
| Position (bp) |
−734–−25 |
−24–−1 |
0–2633 |
2634–2723 |
2724–3087 |
3088–3307 |
| Polymorphic sites |
35 |
0 |
38 |
1 |
3 |
2 |
| SNPs |
21 |
0 |
35 |
0 |
3 |
1 |
| InDels |
14 |
0 |
3 |
1 |
0 |
1 |
| π |
0.0166 |
NA |
0.0056 |
0.0011 |
0.0039 |
0.0026 |
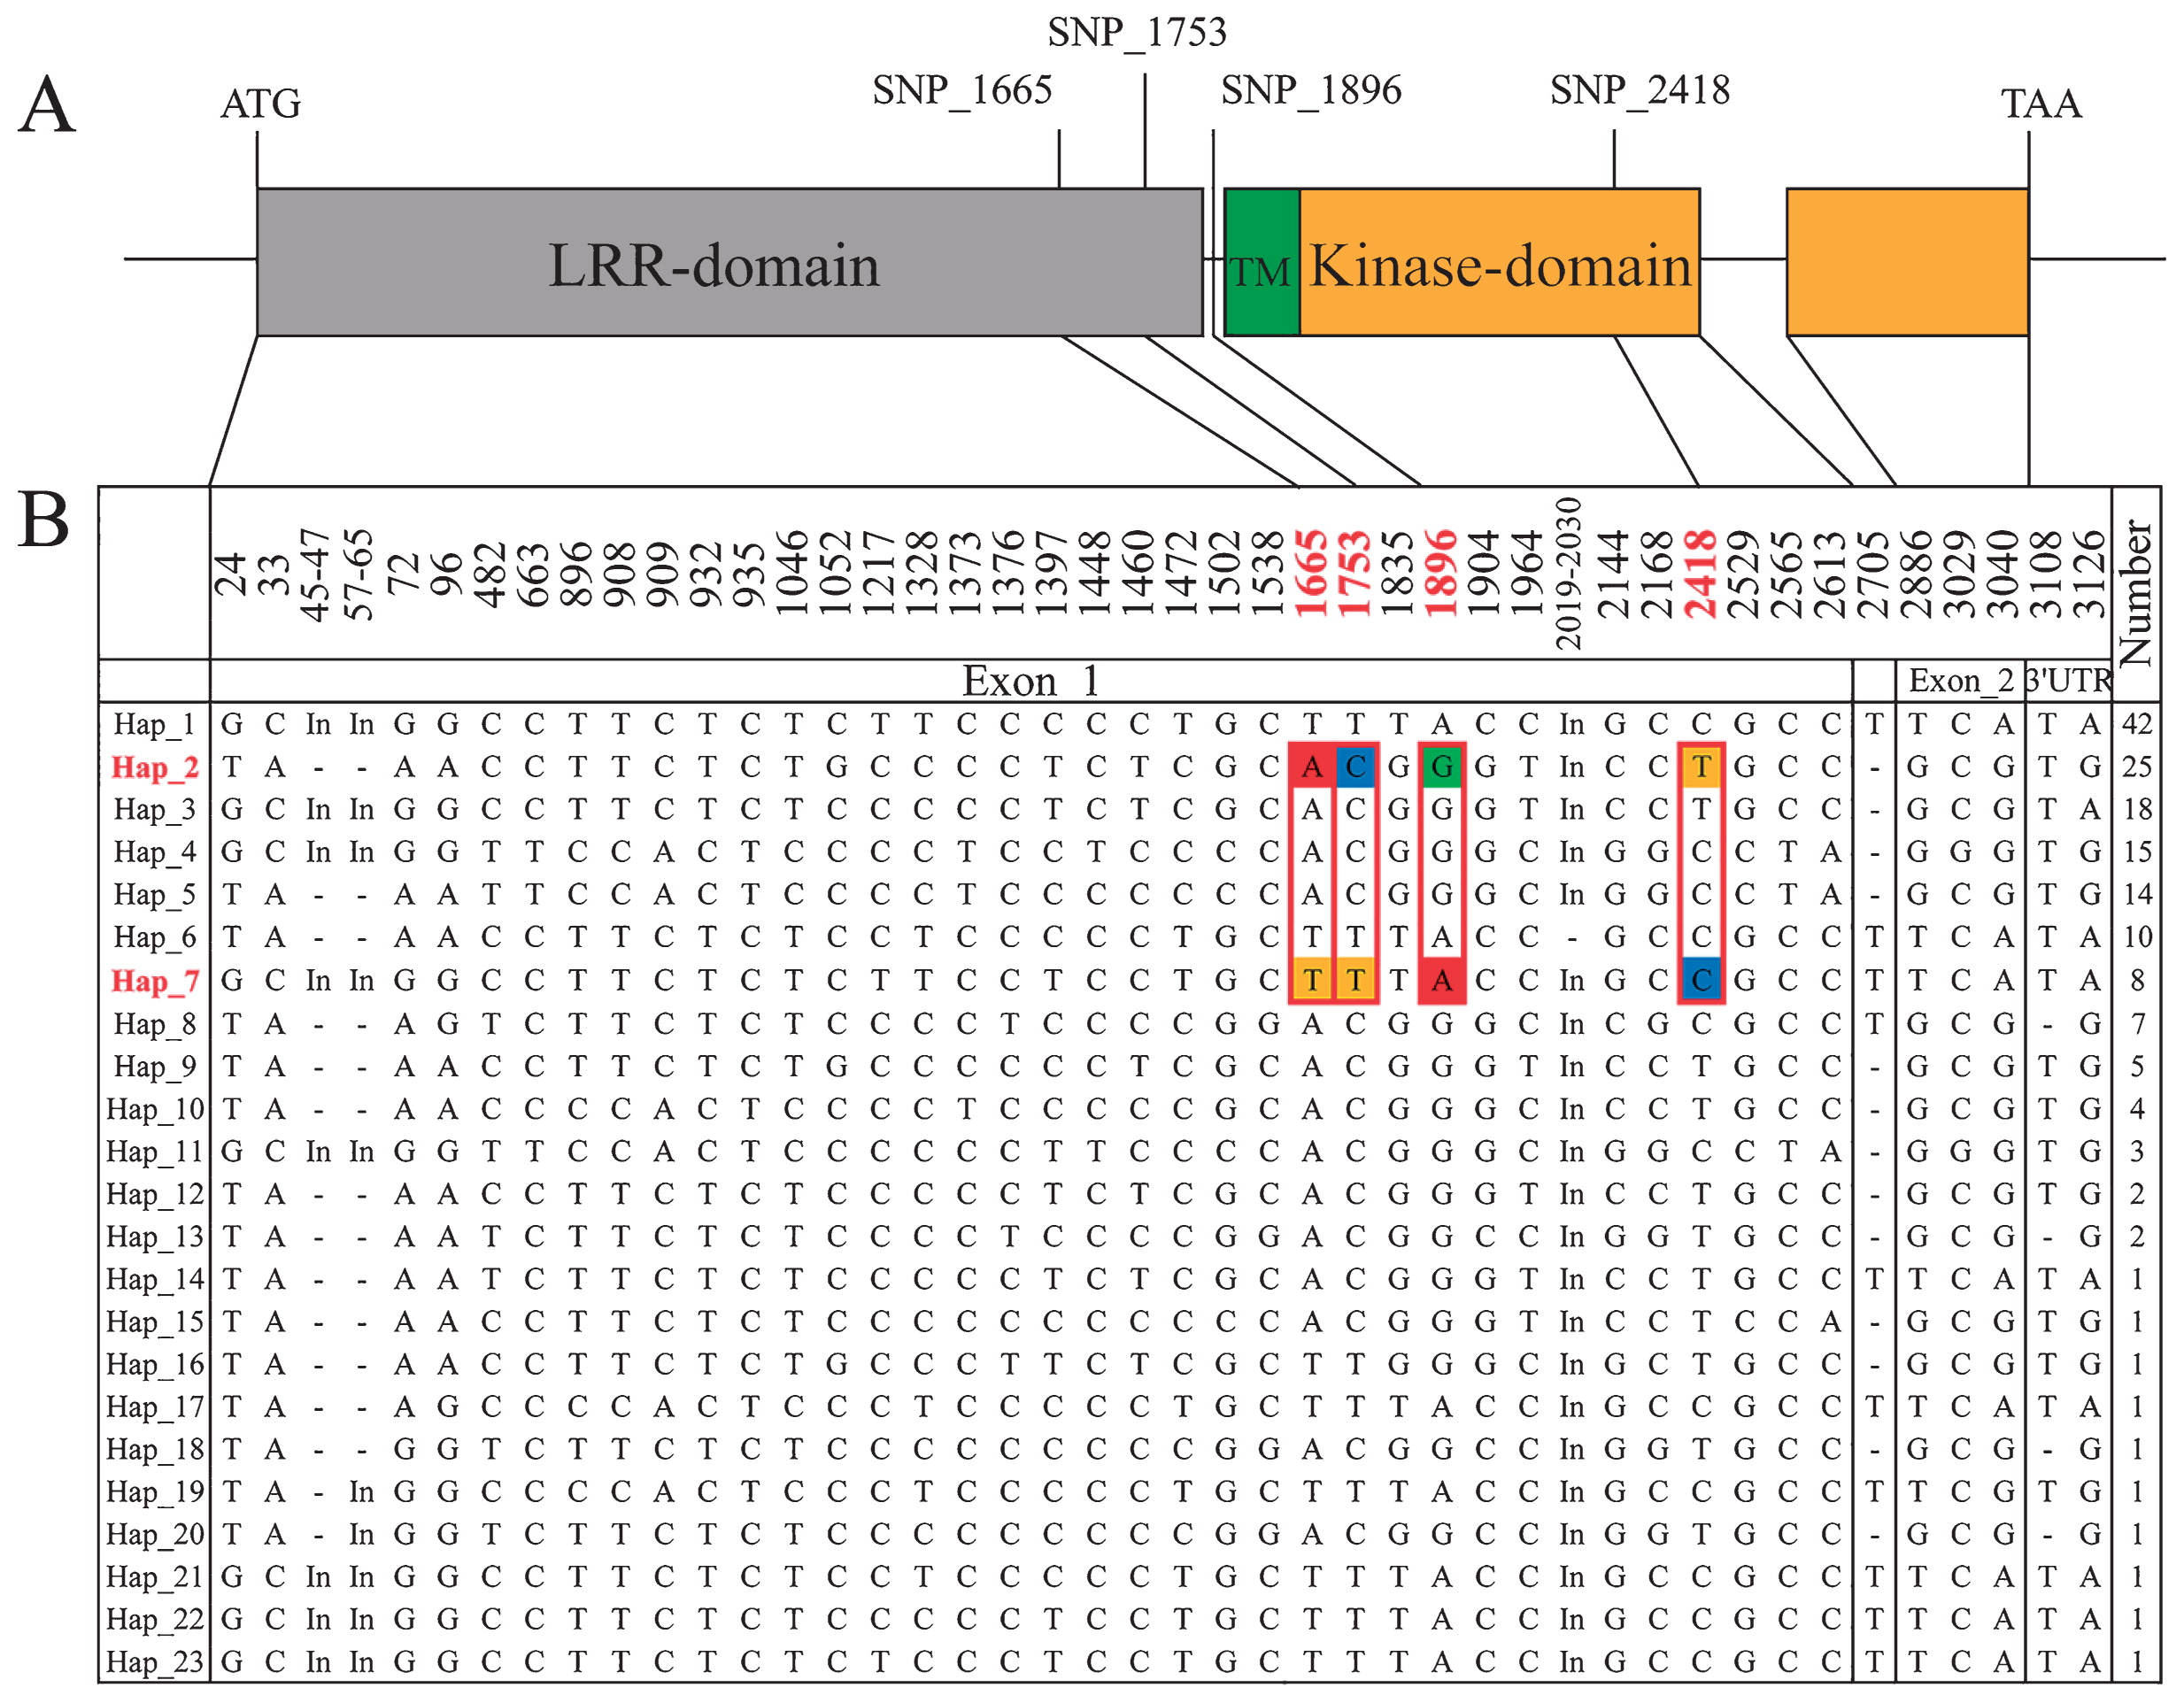
As shown in Table 2, the frequencies of polymorphic sites in the promoter regions (π = 0.0166) were higher than in other regions of TD1. The π values for exon_1 and exon_2 were much higher than those for the intron, revealing that the vast majority of polymorphic sites occurred in exons. Moreover, all of the polymorphic sites in the TD1 gene could be used to categorize these 165 inbred lines into 23 haplotypes (Hap_1 to Hap_23). Hap_1 comprised 42 lines, while Hap_2, Hap_3, Hap_4, Hap_5, Hap_6, Hap_7, and Hap_8 comprised 25, 18, 15, 14, 10, 8, and 7 inbred lines, respectively. The remaining 15 haplotypes included fewer than five inbred lines (Fig. 1B).
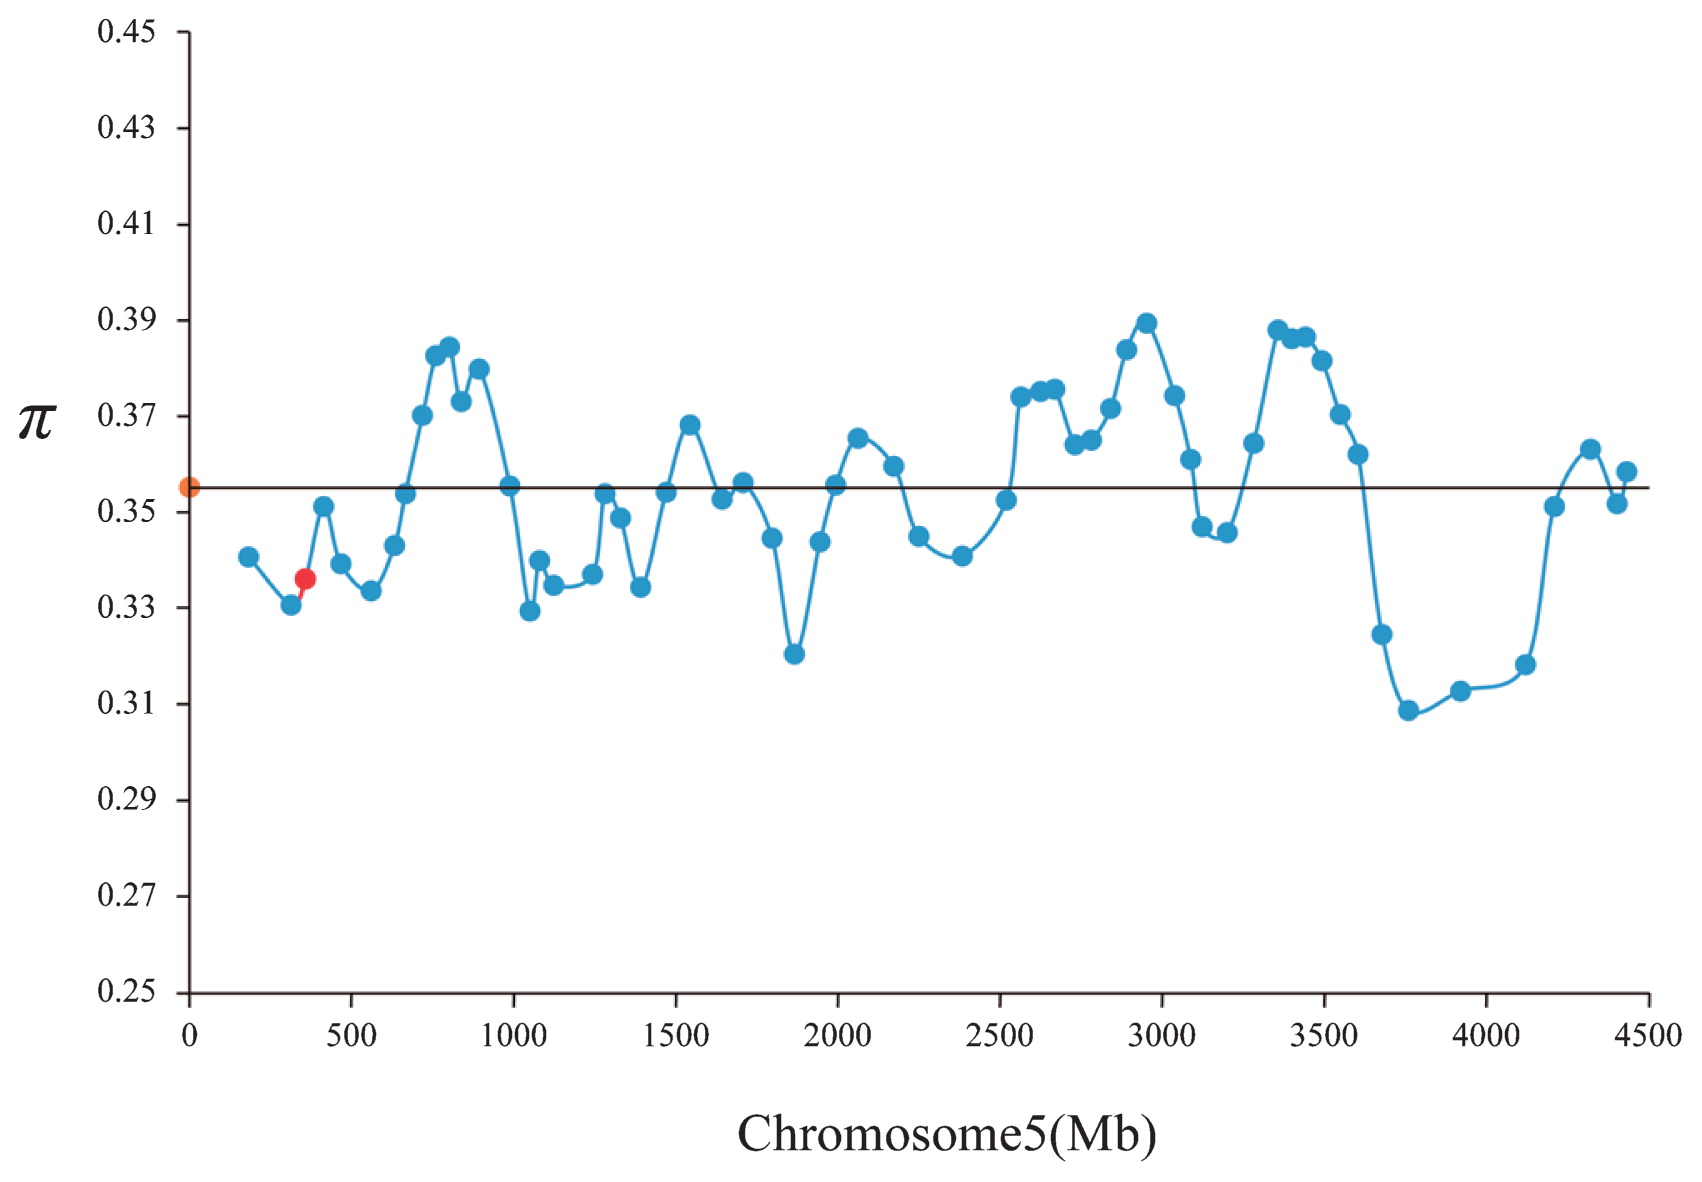
A total of 4611 SNP markers from MaizeSNP50 BeadChip (Illumina, Inc.) were used for analyzing the extent of selection on TD1 on chromosome 5. The sliding window analysis shows the nucleotide diversity with a window size of 100 sites and step size of 25 sites on chromosome 5 (Fig. 2). The average estimates π in chromosome 5 is 0.355, while that for the window harboring TD1 was relative lower at 0.336.
Association analysis of TD1 with KN, KNPR, and KRN
In the TD1 promoter region, two SNPs and seven InDels were significantly associated only with variation in KRN (p < 0.05). All of these alleles were detected in both EB1 and EB2. In the TD1 genic region, nine, eight, and three polymorphic sites were significantly associated with KN, KNPR, and KRN (p < 0.05), respectively. Specifically, eight SNPs and one InDel were identified as significantly associated with variation in KN (p < 0.05). Three of the eight SNPs were synonymous and the remaining five were non-synonymous, with amino acid alterations from leucine to isoleucine (SNP_1665), valine to alanine (A) (SNP_1753), serine to glycine (SNP_1896), threonine to A (SNP_2886), and glutamic acid to asparagine (SNP_3040). Similarly, seven SNPs and one InDel were significantly associated with variation in KNPR. Four of the seven SNPs were synonymous and the other three were non-synonymous, with amino acid alterations from leucine to isoleucine (SNP_1665), valine to A (SNP_1753), and serine to glycine (SNP_1896). Interestingly, SNP_1217, SNP_1472, SNP_1665, SNP_1753, SNP_1835, SNP_1896, and the only InDel (InDel_8) were associated with variation in both KN and KNPR in both EA1 and EA2. Three SNPs located in the TD1 coding region were also significantly associated with variation in KRN. SNP_2418 was the only non-synonymous SNP with an amino acid alteration from cysteine to arginine. Associations with all of these significant polymorphic sites with KRN were detected in both EB1 and EB2 (Supplemental Table 2).
The variant most significantly associated with KN was SNP_3040 in EA2 (p = 0.0067). Association of this SNP with KN could also be detected in EA1 (p = 0.0265). In addition, SNP_1665 and SNP_1753, which are in complete LD in exon_1, were identified as the most marginally significantly associated with KNPR in EA1 (p = 0.0181). This association could also be detected in EA2 (P = 0.0490). These two SNPs were also associated with KN in EA1 (p = 0.0144) and EA2 (p = 0.0142). Further, SNP_1964 was also significantly associated with KRN in EB2 (p = 0.0036). SNP_1964 was also significantly associated with KRN in EB1 (p = 0.0408) (Fig. 3A). These significantly associated SNPs could also explain the highest proportion of phenotypic variance in KN (6.82%), KNPR (4.89%), and KRN (5.84%).
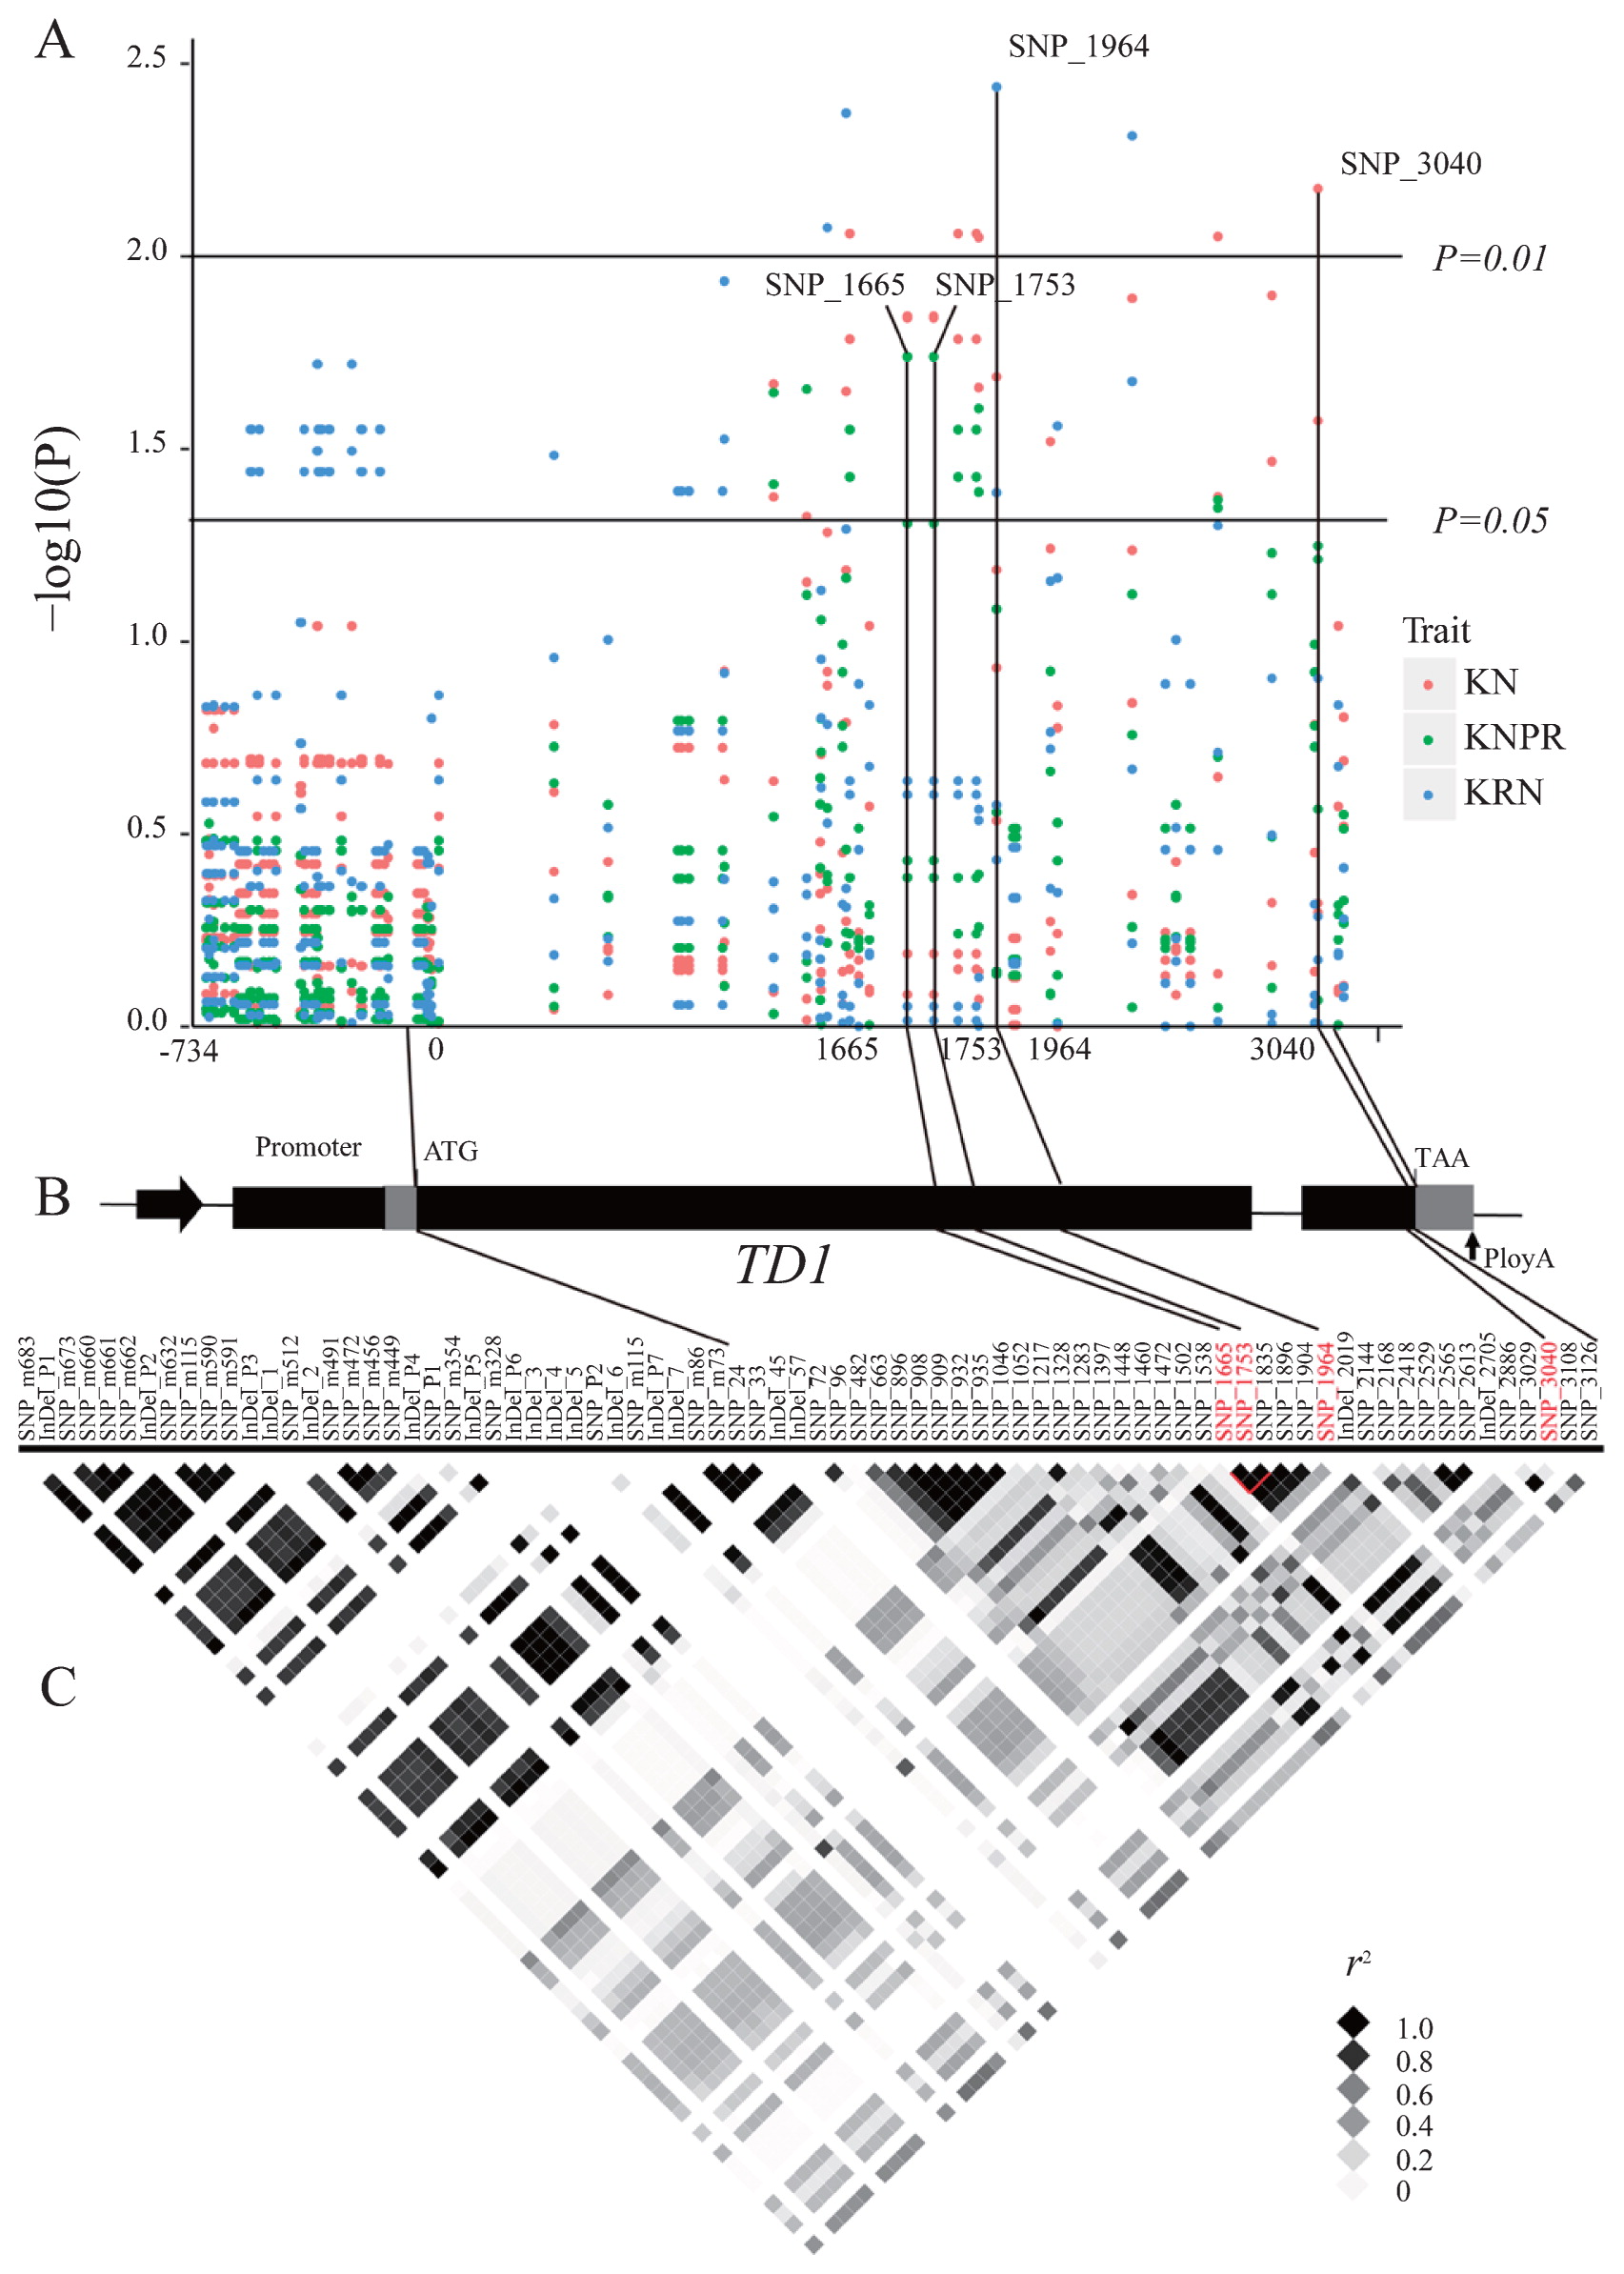
A plot of r2 against physical distance for polymorphic pairs of genes indicated that LD was much higher in the promoter regions and in exon_1 compared with other regions of TD1. SNP_P1, InDel_1, InDel_2, InDel_4, InDel_5, InDel_6, and InDel_7 in the promoter region are in complete LD (r2 = 1). In addition, in exon_1, SNP_1472, SNP_1835, and SNP_1896 are in complete LD with each other, and SNP_1665 is in complete LD with SNP_1753 (r2 = 1) (Fig. 3C).
Favorable TD1 haplotypes
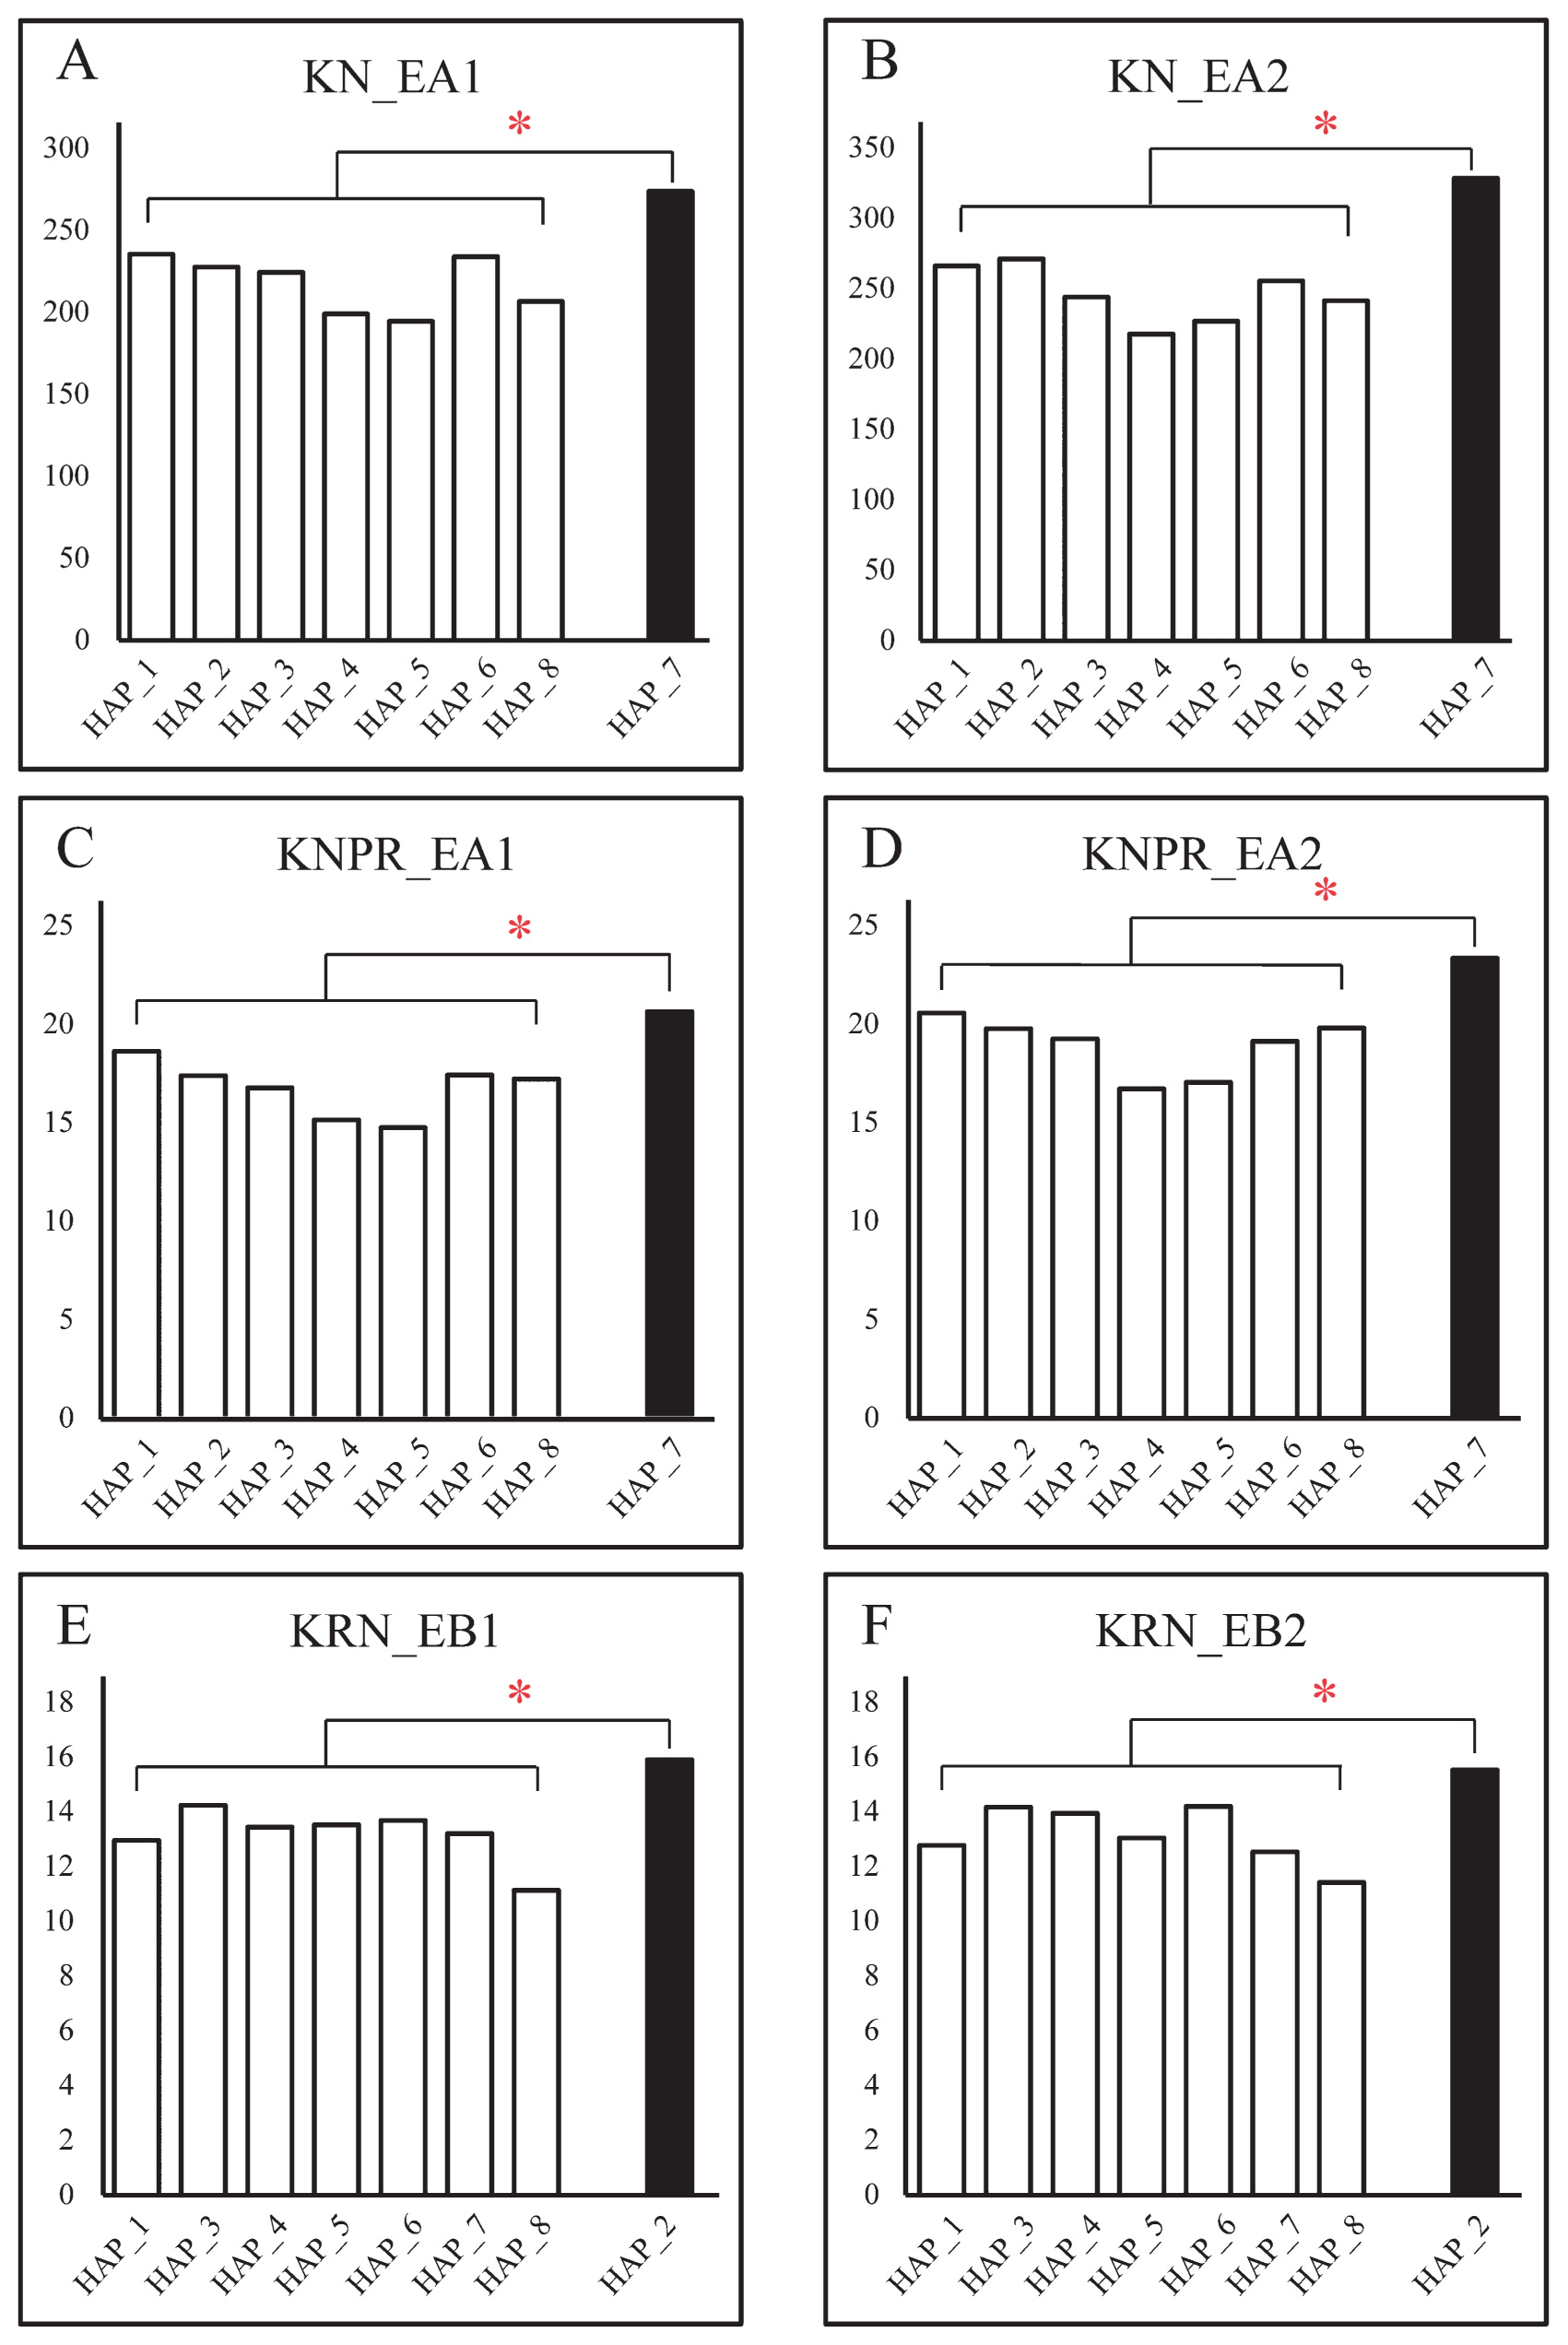
Our results indicated that the KN and KNPR values associated with Hap_7 were significantly higher than those of other haplotypes that include five other inbred lines in EA1 and EA2 (p < 0.05) (Fig. 4A–4D). In addition, lines in Hap_2 had relatively higher KRN values compared with lines carrying other haplotypes in EB1 and EB2 (p < 0.05) (Fig. 4E, 4F). Apparently, all of the favorable alleles for KN, KNPR, and KRN are presented in Hap_7 and Hap_2, with Hap_7 as the elite haplotype for KN and KNPR and Hap_2 as the elite haplotype for KRN.
The 165 inbred lines from seven heterotic groups were subdivided into 23 haplotypes. According to the distribution of haplotypes among heterotic groups, lines from LAN comprised the largest percentage of Hap_1, and lines from SPT comprised a significantly higher proportion of Hap_5 than did other lines. In addition, lines carrying Hap_2 were predominantly from the heterotic group LRC, and then from heterotic group SPT. No significant differences in distribution among heterotic groups were found for Hap_7 (Supplemental Fig. 3).
Discussion
Genetic diversity within the TD1 locus in the association panel
As both phenotypically and genetically diverse crop, maize has approximately two to five times higher nucleotide diversity than other domesticated grass crops (Whitt et al. 2002). Such rich genetic diversity has great benefits for crop improvement (Yan et al. 2011). In the present study, the genomic sequences of the TD1 gene and promoter regions from a diverse panel of 165 inbred lines were sequenced. In total, 79 polymorphic sites were identified in the TD1 gene and promoter regions. The highly diverse maize genome exhibits about one SNP per 28 bp (Tenaillon et al. 2001). In our study, we identified one SNP approximately every 67 bp on average, which indicated that fewer polymorphic sites were detected in our study. Differing population sizes in each study could be a reason for the differences in SNP density.
Nucleotide diversity, π, is estimated as the mean number of nucleotide differences per site between sequences. Our research revealed that π values were highest in the TD1 promoter regions. In addition, π value estimates for the exons were higher than those for the intron, indicating that the TD1 promoter and exonic regions had high levels of nucleotide diversity in this panel. High nucleotide diversity in the coding region could lead to phenotypic variation due to changes in protein sequences caused by non-synonymous mutations.
Extensive research indicates that the large genetic diversity in modern maize is consistent with a lack of selection (Jiao et al. 2012, Whitt et al. 2002). In our study, sliding window analysis of nucleotide diversity on chromosome 5 was carried out to discover the extent of selection on TD1 during breeding programs. The results indicated that the estimates π value of the window harboring TD1 was relative lower than that of the average of chromosome 5. Weng et al. (2013) reported that the π value of the genetic region harboring ZmIPT2 was lower than that of the average of chromosome 2, which indicated that ZmIPT2 was under selection during maize breeding process. Liu et al. (2015b) reported that the markedly lower nucleotide diversity of KRN4 in landrace than that in teosinte revealed the strong selection signal on KRN4. Therefore, our results indicate that the genomic region harboring TD1 has probably undergone artificial selection during maize breeding.
In our study, 15 of the 23 haplotypes included only five lines, for multiple possible reasons. Firstly, minor SNPs or InDels with frequencies of less than 5% were filtered out for the present study, while other studies might retain SNPs and InDels that occur at frequencies of less than 5% for haplotype analysis. Moreover, the population of 165 inbred lines used in the present study was relatively smaller than those used in other studies. Using a larger number of inbred lines in our study could increase the number of haplotypes carried by only one or two inbred lines, as occurred in a candidate gene association analysis of rice glutelin content and the GluA and GluB1 genes (Zhang et al. 2017).
Natural variation in TD1 might affect ear-related traits
TD1 plays an essential role in the CLV pathway, which is involved in the regulation of meristem size during maize inflorescence development. Nine, eight, and three polymorphic sites were significantly associated with variation in KN, KNPR, and KRN (p < 0.05), respectively. The InDel_8 polymorphism in the non-coding region of TD1 was significantly associated with both KN and KNPR (Supplemental Table 2). Many studies have revealed that polymorphisms in non-coding regions can play roles in phenotypic variation. For example, Negrão et al. (2013) showed that protein structure and function can be affected by mutations in the non-coding regions of a gene in rice. Furthermore, a significant association between non-coding variants in the wheat gene TaSnRK2.3-1A and plant height, length of peduncle, penultimate node, and 1000-grain weight was detected in different environments (Miao et al. 2017).
Here, the most significant associations were identified between KN, KNPR, and KRN and SNP_3040, SNP_1665 and linked SNP_1753, and SNP_1896, respectively. Furthermore, SNP_3040, SNP_1665 and linked SNP_1753, and SNP_1896 also accounted for the most phenotypic variance of 6.82% (KN), 4.89% (KNPR), and 5.84% (KRN), respectively (Supplemental Table 2). Another study has also detected similar allelic impact on ear-related traits. For example, SNP28 in ZmIPT2 explained 4.76% of the phenotypic variation for KW (Weng et al. 2013). The low proportion of phenotypic variance accounted for could be explained by the fact that ear-related traits are complex quantitative traits that are controlled by multiple genes with minor effects. Therefore, the optimal way to improve grain traits would be to identify and pyramid as many favorable genes for these traits as possible.
In our study, there were four synonymous and three non-synonymous SNPs for KNPR, and two synonymous and one non-synonymous SNPs for KRN (Supplemental Table 2). Synonymous mutations often have little to no effect on gene function. However, whether any one of these synonymous codons was preferred during translation, which could affect the structure and gene function of the encoded proteins, remains unknown and should be examined during further research. Non-synonymous mutations that affect amino acid sequences and thereby protein sequences are more likely to affect gene function and related traits. The two major domains in the TD1 gene are the LRR-RLK domain and the kinase domain (Fig. 1) (Bommert et al. 2005). Interestingly, all of the non-synonymous mutations (SNP_1665, SNP_1753, and SNP_1896) associated with KNPR were located in the LRR-RLK domain except for SNP_1896, which is located in a region containing gaps in the alignment of the TD1 gene. At the same time, the only non-synonymous SNP_2418 associated with KRN was detected in the kinase domain of TD1 (Fig. 1A). Therefore, we speculate that changes in the LRR-domain could have affected the KNPR trait, while the KRN trait might be affected by the mutant kinase domain. Further research needs to be done to confirm these hypotheses. Although phenotypic variation has often been influenced by variants in coding regions, phenotypes can sometimes also be greatly affected by variants in non-coding regions.
The utilization of favorable haplotypes in maize breeding programs
Our results indicate that Hap_7 is the favorable haplotype in the present study for improving KN and KNPR, and that Hap_2 is the favorable haplotype for improving KRN (Fig. 4). KNPR and KRN are negatively correlated with each other, and as would be expected, all of the non-synonymous SNPs in Hap_7 and Hap_2 were opposite (Fig. 1B). Values of KN and KNPR in Hap_7 were significantly higher in EA1 and EA2, as values of KRN in Hap_2 were higher in EB1 and EB2 (Fig. 4). The alleles significantly associated with KN and KNPR could only be detected in EA1 and EA2, and the alleles significantly associated with KRN could only be detected in EB1 and EB2. Although the favorable haplotypes were detected in only one location for each trait, the results in two different years are consistent. Kernel traits are quantitative traits which are normally controlled by the multiple genes and are easily affected by environment. In our study, the environments we chose were Sanya (18°15′N, 109°30′E) in a tropical zone and Shunyi (39°48′N, 116°28′E) in temperate zone. The factors in these two zones such as attitude, photoperiod, and temperature are quite different, which may have affected the association results. Therefore, it is reasonable that some elite alleles were detected only in one location. In addition, our results can be used in breeding programs for specific purposes in specific environments. For example, we can use site SNP_1665 and SNP_1753 for KNPR in genetic improving research in tropical zones and Site SNP_1964 or SNP_2418 for KRN in temperate zones.
Significant variation due to location affected variation in the phenotypic data, showing that variation due to the environment can dramatically affect phenotypes.
All 165 inbred lines used in this research were derived from seven heterotic groups, including PB, LAN, SPT, PA, LRC, BSSS, and other populations. In the present study, we determined the distribution of each TD1 haplotype within these germplasm groups (Supplemental Fig. 3). Lines from the LRC group including ‘Dan340’ and its derived lines ‘Si273’ and ‘Tie9010’ account for a large proportion of lines carrying Hap_2. Interestingly, the lines from LAN and from SPT represent a majority of the lines carrying Hap_1 and Hap_5. Lines carrying Hap_5 were found to have relatively low KNPR compared with other haplotypes (Fig. 4C, 4D). This indicates that the lines that belong to the SPT heterotic group might contribute to a decrease in KNPR values.
Functional markers are based on sites representing nucleotide diversity in target genes and have been widely used due to their complete linkage with target genes (Andersen and Lübberstedt 2003). MAS has proven to be an efficient functional marker-based tool for improving specific agronomic traits in modern maize breeding programs (Collard et al. 2005). For example, Huang et al. (1997) successfully used MAS to stack four bacterial blight resistance genes (Xa4, Xa5, Xa13, and Xa21) into the rice strain IRBB60, resulting in higher and broader blight resistance than in the original strain. Additionally, using the head smut-resistant maize inbred ‘Ji1037’ as a donor parent, the susceptible inbred lines ‘Ji853’ and ‘Chang7-2’ were improved by MAS to improve head smut resistance by 11.10 to 32.10% (Zhao et al. 2012). Here, the non-synonymous SNP_1665, SNP_1753, SNP_1896, and SNP_2148 in exon_1 of the TD1 gene could be developed as functional markers related to KNPR and KRN. These two traits could be improved in elite maize inbred lines such as ‘Qi319’, ‘Huangzao4’, and ‘Mo17’ using functional markers developed from the favorable alleles identified in this research. It is essential to understand the linkage of these markers to KNPR or KRN in more detail because improvement of KNPR or KRN would be far more difficult and time-consuming by standard maize breeding procedures than by MAS. Therefore, the results presented here will make a significant contribution to the improvement of ear-related traits in maize. However, further phenotypic characterization of subsequent generations and analysis of gene expression or enzyme activity of target genes should be performed to more completely describe the allelic effects and mechanisms that determine maize ear-related traits. Thus, future studies should analyze other genes involved in the maize ear development pathway to elucidate the gene network(s) modulating ear-related traits so that favorable alleles of these genes can be integrated into breeding programs to improve maize grain yield.
Author Contribution Statement
Z.H. Wang and X.H. Li conceived the original idea and supervised the project. The experiments of the genotypic data collection, such as DNA extraction, PCR or sequencing, were carried out in Z.H. Wang’s lab. All the reagents and instruments were provided by Z.H. Wang’s group. The phenotypic data of KRN, KNPR and KN from EA1, EA2, EB1 and EB2 were providedby X.H. Li’s group. C. Liu carried out experiments and wrote the manuscript with support from X.C. Zhang, Z.Q. Zhou and J.F. Weng; C. Liu and Y. Zhou the experimental results; X.C. Zhang and Z.Q. Zhou collected the phenotypic data. J.Y. Zhang assisted with sequencing data assembling. All authors discussed the results and contributed to the final manuscript.
Acknowledgments
This work was supported by the Key Project of Research and Development Plan of the Ministry of Science and Technology of China (2016YFD0100300) and the Nursing Program for Young Scholars with Creative Talents in Heilongjiang Province (UNPYSCT-2017011).
Literature Cited
- Andersen, J.R. and T. Lübberstedt (2003) Functional markers in plants. Trends Plant Sci. 8: 554–560.
- Barrett, J.C., B. Fry, J. Maller and M.J. Daly (2005) Haploview: analysis and visualization of LD and haplotype maps. Bioinformatics 21: 263–265.
- Bommert, P., C. Lunde, J. Nardmann, E. Vollbrecht, M. Running, D. Jackson, S. Hake and W. Werr (2005) Thick tassel dwarf 1 encodes a putative maize ortholog of the Arabidopsis CLAVATA1 leucine-rich repeat receptor-like kinase. Development 132: 1235–1245.
- Bommert, P., N.S. Nagasawa and D. Jackson (2013) Quantitative variation in maize kernel row number is controlled by the FASCIATED EAR2 locus. Nat. Genet. 45: 334–337.
- Brown, P.J., N. Upadyayula, G.S. Mahone, F. Tian, P.J. Bradbury, S. Myles, J.B. Holland, S. Flint-Garcia, M.D. McMullen, E.S. Buckler et al. (2011) Distinct genetic architectures for male and female inflorescence traits of maize. PLoS Genet. 7: e1002383.
- Clark, S.E., R.W. Williams and E.M. Meyerowitz (1997) The CLAVATA1 gene encodes a putative receptor kinase that controls shoot and floral meristem size in Arabidopsis. Cell 89: 575–585.
- Collard, B.C.Y., M.Z.Z. Jahufer, J.B. Brouwer and E.C.K. Pang (2005) An introduction to markers, quantitative trait loci (QTL) mapping and marker-assisted selection for crop improvement: the basic concepts. Euphytica 142: 169–196.
- Flint-Garcia, S.A., J.M. Thornsberry and E.S. Buckler IV (2003) Structure of linkage disequilibrium in plants. Annu. Rev. Plant Biol. 54: 357–374.
- Flint-Garcia, S.A., A.C. Thuillet, J. Yu, G. Pressoir, S.M. Romero, S.E. Mitchell, J. Doebley, S. Kresovich, M.M. Goodman and E.S. Buckler (2010) Maize association population: a high-resolution platform for quantitative trait locus dissection. Plant J. 44: 1054–1064.
- Huang, N., E.R. Angeles, J. Domingo, G. Magpantay, S. Singh, G. Zhang, N. Kumaravadivel, J. Bennett and G.S. Khush (1997) Pyramiding of bacterial blight resistance genes in rice: marker-assisted selection using RFLP and PCR. Theor. Appl. Genet. 95: 313–320.
- Jeong, S., A.E. Trotochaud and S.E. Clark (1999) The Arabidopsis CLAVATA2 gene encodes a receptor-like protein required for the stability of the CLAVATA1 receptor-like kinase. Plant Cell 11: 1925–1933.
- Jiao, Y., H. Zhao, L. Ren, W. Song, B. Zeng, J. Guo, B. Wang, Z. Liu, J. Chen, W. Li et al. (2012) Genome-wide genetic changes during modern breeding of maize. Nat. Genet. 44: 812–815.
- Knapp, S.J., W.W. Stroup and W.M. Ross (1985) Exact confidence intervals for heritability on a progeny mean basis. Crop Sci. 25: 192–194.
- Larkin, M.A., G. Blackshields, N.P. Brown, R. Chenna, P.A. McGettigan, H. McWilliam, F. Valentin, I.M. Wallace, A. Wilm, R. Lopez et al. (2007) Clustal W and Clustal X version 2.0. Bioinformatics 23: 2947–2948.
- Li, M., W. Zhong, F. Yang and Z. Zhang (2018) Genetic and molecular mechanisms of quantitative trait loci controlling maize inflorescence architecture. Plant Cell Physiol. 59: 448–457.
- Librado, P. and J. Rozas (2009) DNASP v5: a software for comprehensive analysis of DNA polymorphism data. Bioinformatics 25: 1451–1452.
- Liu, C.L., Z.F. Hao, D.G. Zhang, C.X. Xie, M.S. Li, X.C. Zhang, H.J. Yong, S.H. Zhang, J.F. Weng and X.H. Li (2015a) Genetic properties of 240 maize inbred lines and identity-by-descent segments revealed by high-density SNP markers. Mol. Breed. 35: 146–146.
- Liu, L., Y. Du, X. Shen, M. Li, W. Sun, J. Huang, Z. Liu, Y. Tao, Y. Zheng, J. Yan et al. (2015b) KRN4 controls quantitative variation in maize kernel row number. PLoS Genet. 11: e1005670.
- Lunde, C. and S. Hake (2009) The interaction of knotted1 and thick tassel dwarf1 in vegetative and reproductive meristems of maize. Genetics 181: 1693–1697.
- Miao, L., X. Mao, J. Wang, Z. Liu, B. Zhang, W. Li, X. Chang, M. Reynolds, Z. Wang and R. Jing (2017) Elite haplotypes of a protein kinase gene TaSnRK2.3 associated with important agronomic traits in common wheat. Front Plant Sci. 8: 368.
- Murray, M.G. and W.F. Thompson (1980) Rapid isolation of high molecular weight plant DNA. Nucleic Acids Res. 8: 4321–4325.
- Negrão, S., M.C. Almadanim, I.S. Pires, I.A. Abreu, J. Maroco, B. Courtois, G.B. Gregorio, K.L. McNally and M.M. Oliveira (2013) New allelic variants found in key rice salt-tolerance genes: an association study. Plant Biotechnol. J. 11: 87–100.
- Nei, M. and W.H. Li (1979) Mathematical model for studying genetic variation in terms of restriction endonucleases. Proc. Natl. Acad. Sci. USA 76: 5269–5273.
- Pautler, M., W. Tanaka, H.Y. Hirano and D. Jackson (2013) Grass meristems I: Shoot apical meristem maintenance, axillary meristem determinacy and the floral transition. Plant Cell Physiol. 54: 302–312.
- Pritchard, J.K., M. Stephens and P. Donnelly (2000a) Inference of population structure using multilocus genotype data. Genetics 155: 945–959.
- Pritchard, J.K., M. Stephens, N.A. Rosenberg and P. Donnelly (2000b) Association mapping in structured populations. Am. J. Hum. Genet. 67: 170–181.
- Rozas, J. (2009) DNA sequence polymorphism analysis using DnaSP. Methods Mol. Biol. 537: 337–350.
- Schoof, H., M. Lenhard, A. Haecker, K.F.X. Mayer, G. Jürgens and T. Laux (2000) The stem cell population of Arabidopsis shoot meristems is maintained by a regulatory loop between the CLAVATA and WUSCHEL genes. Cell 100: 635–644.
- Su, Z., X. Li, Z. Hao, C. Xie, M. Li, J. Weng, D. Zhang, X. Liang, Z. Wang, J. Gao et al. (2011) Association analysis of the nced and rab28 genes with phenotypic traits under water stress in maize. Plant Mol. Biol. Rep. 29: 714–722.
- Tanaka, W., M. Pautler, D. Jackson and H.Y. Hirano (2013) Grass meristems II: Inflorescence architecture, flower development and meristem fate. Plant Cell Physiol. 54: 313–324.
- Tenaillon, M.I., M.C. Sawkins, A.D. Long, R.L. Gaut, J.F. Doebley and B.S. Gaut (2001) Patterns of DNA sequence polymorphism along chromosome 1 of maize (Zea mays ssp. mays L.). Proc. Natl. Acad. Sci. USA 98: 9161–9166.
- Thornsberry, J.M., M.M. Goodman, J. Doebley, S. Kresovich, D. Nielsen and E.S. Buckler IV (2001) Dwarf8 polymorphisms associate with variation in flowering time. Nat. Genet. 28: 286–289.
- Weng, J., B. Li, C. Liu, X. Yang, H. Wang, Z. Hao, M. Li, D. Zhang, X. Ci, X. Li et al. (2013) A non-synonymous SNP within the isopentenyl transferase 2 locus is associated with kernel weight in Chinese maize inbreds (Zea mays L.). BMC Plant Biol. 13: 98.
- Whitt, S.R., L.M. Wilson, M.I. Tenaillon, B.S. Gaut and E.S. Buckler IV (2002) Genetic diversity and selection in the maize starch pathway. Proc. Natl. Acad. Sci. USA 99: 12959–12962.
- Yan, J., M. Warburton and J. Crouch (2011) Association mapping for enhancing maize (Zea mays L.) genetic improvement. Crop Sci. 51: 433–449.
- Yu, J., G. Pressoir, W.H. Briggs, B.I. Vroh, M. Yamasaki, J.F. Doebley, M.D. McMullen, B.S. Gaut, D.M. Nielsen, J.B. Holland et al. (2006) A unified mixed-model method for association mapping that accounts for multiple levels of relatedness. Nat. Genet. 38: 203–208.
- Zhang, W., J. Sun, G. Zhao, J. Wang, H. Liu, H. Zheng, H. Zhao and D. Zou (2017) Association analysis of the glutelin synthesis genes GluA and GluB1 in a Japonica rice collection. Mol. Breed. 37: 129.
- Zhao, X., G. Tan, Y. Xing, L. Wei, Q. Chao, W. Zuo, T. Lübberstedt and M. Xu (2012) Marker-assisted introgression of qHSR1 to improve maize resistance to head smut. Mol. Breed. 30: 1077–1088.