Abstract
Leaf chemistry traits are some of the key factors influencing tobacco quality, which can be significantly reduced by lower chemical components in cured leaf. To improve tobacco quality through breeding, genetic diversity analysis, population structure analysis, and genome-wide association studies were performed in a panel of 347 tobacco germplasms and the markers associated with five leaf chemistry traits, including total sugar (TS), reducing sugar (RS), total nitrogen (TN), nicotine (NIC), and total potassium (TP) contents were identified. Four groups were classified at a genetic distance of 0.316 by genetic diversity analysis based on coefficient parameter NEI72 using a program NTSYS-pc2.10e, whereas four well-differentiated subpopulations were postulated in the 347 tobacco accessions. A total of 47 target trait-associated SNPs was detected in at least three environments as well as the best linear unbiased predictions (BLUPs) across all environments, among which two, two, four, six, and one highly suggestive associated SNPs were repeatedly detected in all environments and BLUPs for TS, RS, TN, NIC, and TP, respectively. On the basis of the phenotypic effects of the alleles corresponding to suggestive associated SNPs, five tobacco accessions harboring favorable alleles with elite phenotypic performance in leaf chemistry traits were identified. The results could facilitate quality tobacco breeding for higher leaf chemistry trait contents through molecular marker-assisted approaches.
Introduction
Tobacco is an allopolyploid species (2n = 4x = 48) that arose from a tetraploidization event of its basic chromosome number (n = 12), which is similar to numerous other solanaceous species such as tomato, potato, pepper, and eggplant (Clarkson et al. 2005, Goodspeed 1954, Sierro et al. 2018). It is also one of the most important non-food crops that are extensively cultivated globally. The flue-cured tobacco, also known as fire-tube flue-cured tobacco, is particularly a major cash crop and one of the bulk export agricultural products in China (Wang and Zhou 1995). Similar to other crops, the breeding of tobacco currently faces a major problem, where high-intensity selection pressure in traditional breeding practices leads to the gradual narrowing of the parental genetic basis (Bowman and Sisson 2000). The inadequacy of parent resources and the close kinship among varieties has resulted in a narrow genetic basis in tobacco cultivars, with less invasion of alien germplasm (Chang et al. 2013). Despite the latest progress in tobacco draft genomes (Edwards et al. 2017, Sierro et al. 2013, 2014), the lack of detailed information on tobacco chromosomes and genes limits the efficient exploitation of tobacco germplasms (Del Piano et al. 2000, Moon et al. 2008, 2009a, 2009b, Sarala and Rao 2008, Tong et al. 2016). Therefore, improving DNA markers and obtaining QTL information would be beneficial for genomics-assisted breeding of tobacco. The study of genetic diversity in existing tobacco germplasms could effectively minimize the combination of plants with similar genetic backgrounds and breeding workload, with considerable implications for hybrid combinations of the parents (Hancock and Lewis 2017). In addition, developing molecular markers associated with leaf chemistry traits of tobacco and mining genes with elite allelic variations could lay an important foundation for genetic studies on complex quantitative traits and molecular marker-assisted breeding (Fan et al. 2015).
Tobacco leaf chemistry traits are fundamental quality attributes including total sugar (TS), reducing sugar (RS), total nitrogen (TN), nicotine (NIC), and total potassium (TP) contents. However, almost all the major leaf chemistry traits above in tobacco are quantitative traits controlled by polygenes. Owing to their complex genetic basis and susceptibility to environmental changes, traditional breeding methods are ineffective. Association analysis, also known as linkage disequilibrium mapping or association mapping, uses the natural population as the breeding material and is based on linkage disequilibrium, which detects the frequency of significant association between the genetic variation of markers or candidate genes in linkage disequilibrium and the target traits in a population (Bradbury et al. 2007, Pritchard et al. 2000a). Compared with quantitative trait locus (QTL) mapping, association analysis has two prominent advantages: 1) there is no need to construct population and genetic maps, considerably reducing the workload, and 2) it uncovers (explores) elite genes from a certain scale (quantity) of germplasm resources in a single instance, providing evidence for genetic breeding. Since the first application of association analysis in plants by Thornsberry et al. (2001), it has been applied extensively as an effective method for quantitative trait analysis in genetic studies of crops, such as barley (Gyawali et al. 2018, Singh et al. 2018), maize (Zhou et al. 2018), wheat (Li et al. 2018b, Shi et al. 2018), and peanuts (Li et al. 2018a), with satisfactory results. Zhang et al. (2012) conducted an association analysis on 13 agronomic traits in 258 flue-cured tobaccos using the two optimal models, general linear model GLM_Q (Q: the population structure values) and mixed linear model MLM_Q + K (K: the kinship matrix values), detecting 18 sequence-related amplified polymorphism markers significantly associated with six agronomic traits. In addition, Yu et al. (2014) found that the polymorphic loci of one simple sequence repeat (SSR) marker and six microsatellite-anchored fragment length polymorphism markers were significantly associated with the levels of tobacco-specific nitrosamines based on association analysis. Ren et al. (2014) found 24 SSR loci associated with aroma substances in tobacco, whereas Basirnia et al. (2014) identified only one SSR locus from linkage group 13 that was significantly associated with low chloride accumulation rate in 70 oriental-type tobaccos using the MLM_Q + K model. Recently, Fan et al. (2015) performed a marker–trait association analysis using the MLM method and obtained 11 SSR markers associated with potassium content in tobacco; five among the 11 SSR markers were selected to validate the stability of the associated markers by scanning 130 other tobacco germplasms. Single nucleotide polymorphisms (SNPs), due to their abundance at genome-wide level, biallelic and reproducible nature, are considered to be the most desirable, precise and efficient tools for assessing the genetic characteristics of populations or germplasm, mapping quantitative trait loci (QTL), and facilitating the selection of breeding materials that bear desired genes/alleles or haplotypes in both plant genetics and breeding programs (Mora et al. 2016, Pace et al. 2015). However, to date, no study has reported a simultaneous association analysis of leaf chemistry traits in natural populations with a large amount of tobacco germplasms based on genome-wide SNP markers.
In the present study, the genetic diversity and population structure in a panel of 347 tobacco germplasm accessions was analyzed using 50K Axiom_NtY87SNP Array, which contains 51,718 polymorphic SNPs with unique positions evenly distributed on 24 chromosomes. On the basis of the above analysis, a GWAS of the five leaf chemistry traits in four environments (reveal environment specific QTLs, i.e. environment-dependent QTLs) and best linear unbiased predictions (BLUPs) across all environments (reveal QTLs for average environment, i.e. environment-independent QTLs) were conducted to identify loci significantly associated with the leaf chemistry traits and tobacco accessions with elite phenotypes harboring favorable alleles for genetic improvement in tobacco quality breeding.
Materials and Methods
Plant materials
A set of 347 tobacco germplasm accessions, which composed of 305 Nicotiana tabacum L. accessions, 5 Nicotiana rustica L. accessions, and 37 wild tobacco accessions, were provided by the Yunnan Academy of Tobacco Agricultural Sciences. Among them, 157 accessions including landraces and breeding varieties were Chinese tobacco germplasms (domestic resources), which covered the five major tobacco-growing areas in China. The remaining 190 accessions were foreign resources (varieties), including 136 from America, 17 from Asia, 16 from Africa, 15 from Australia, and 6 from Europe. Details of all accessions are listed in Supplemental Table 1.
Phenotypic data
Each of 347 tobacco genotypes was grown in the 2016 and 2017 growing seasons with two replicated plots each year at two locations (Yuxi [YX: N32°21ʹ, E99°32ʹ] and Wenshan [WS: N20°40ʹ, E111°12ʹ], Yunnan Province), where 30 plants of each genotype were included in each plot. Therefore, in a randomized complete block design, each of two blocks consisted of 347 plots which were randomly allocated within a block and a total of 60 plants of each genotype were grown each year at each location. The environments were represented as 16YH, 16WS, 17YH, and 17WS for YH in 2016, WS in 2016, WS in 2017, and YH in 2017, respectively. All plants were under standard irrigation and fertilization management for high-quality tobacco production throughout the whole cultivation period. To survey leaf chemistry traits, the middle leaves of 15 plant samples (mixed leaves of C1F, C2F, and C3F grades which represent 1st, 2nd and 3rd grades of cured tobacco leaves respectively) were randomly selected from each plot to determine TS, RS, TN, NIC, and TP contents in tobacco curing leaves. The average of the measurements from two plots was regarded as a phenotype of each genotype and such phenotype data were collected in two years (2016 and 2017) at two locations (YX and WS) for 347 genotypes. With minor modifications, % nicotine (NIC) was determined by the method of Griffith (1957), % total sugar (TS) and % reducing sugars (RS) were determined by the procedure described by Harvey et al. (1969), and total N (TN), and total potassium (TP) were analyzed according to Julio et al. (2006), respectively. Analysis of variance (ANOVA) was performed using PROC GLM, and phenotypic correlation coefficients were calculated with PROC CORR in SAS v.8.03 (SAS Institute Inc., Cary, NC, USA). To evaluate the genotypic value of each accession excluding the effects of the environments (16YH, 16WS, 17YH and 17WS), the best linear unbiased predictors (BLUPs) for the five traits were estimated using the R package rrBLUP version 4.4 (Endelman 2011). A following linear mixed model was used to obtain BLUPs of the accessions,
y = Xb + Zu + e,
where y is a vector (n × 1) of phenotypic observations with n being the observation number, b is a vector (4 × 1) of fixed environmental effects, u is a vector (m × 1) of the BLUPs of all accessions with m being the number of accessions (m = 347), X (n × 4) and Z (n × m) are design matrices respectively relating b and u with y and e is a vector of the residuals. It was assumed that u followed a normal distribution with a mean vector 0 and a variance-covariance matrix Imσu2 and e followed a normal distribution with a mean vector 0 and a variance-covariance matrix Inσe2, with Im and In being identity matrices with dimensions m and n, respectively, and σu2 and σe2 indicating genotypic and residual variances, respectively. The values of BLUPs and each single environment were used for GWAS. Broad-sense heritability (H2) for the five leaf chemistry traits were estimated according to Lin and Allaire (1977).
Genotypic data
High-quality total genomic DNA (20 μL of 10 ng μL–1) extracted from fresh leaves of 347 tobacco samples was randomly fragmented (25–125 bp), and fragmented DNA was purified before hybridizing with 50K Axiom_NtY87SNP Array, which contains 51,718 polymorphic SNPs with unique positions and evenly distributed markers on 24 chromosomes. The samples were then hybridized on chip followed by single-base extension through DNA ligation and signal amplification according to the Affymetrix Axiom® 2.0 Assay Manual Target Prep Protocol (Life Technologies, Thermo Fisher Scientific Corp., USA). To identify multicolor ligation events at the array surface, which points to a polymorphic nucleotide, GeneTitan Multi-Channel instrument (Life Technologies, Thermo Fisher Scientific Corp., USA) was used to stain and scan the samples to generate the data.
Alleles for high-quality SNP results were detected using Axiom Analysis Suite v.4.0 using the Best Practices, Sample QC, Genotyping, and Summary Only workflows. Samples with DQC >0.82 and QC call rate >97% were considered for further analysis. Subsequently, SNP QC was performed under default parameters for polyploid species type (i.e., cr-cutoff ≥97; fld-cutoff ≥3.6; het-so-cutoff ≥0.1; het-so-otv-cutoff ≥0.3; hom-ro-1-cutoff ≥0.6; and hom-ro-2-cutoff ≥0.3). In addition, Quality control (QC) was assessed using TASSELv.5.0. SNPs with minor allele frequency (MAF) lower than 5%, significantly deviating from Hardy–Weinberg Equilibrium (HWE) (p < 1e-5), and a SNP call rate of lower than 95% were excluded. The above criteria facilitated the elimination of SNPs with low call rates and the maintenance of only the high-quality SNPs for further analyses.
Data analysis
Population genetic structure analysis was performed using Structure 2.3.4 (Falush et al. 2003, Pritchard et al. 2000a) based on an admixture model, and the optimal population number K was estimated in the 2–10 range. The length of the burn-in period at the start of Markov chain Monte Carlo (MCMC) was set to 10,000, and the MCMC length after the burn-in period was set to 100,000 (Pritchard et al. 2000b). To determine the suitable number of clusters (K; number of subpopulations) in the STRUCTURE analysis, which was based on the criteria described by Evanno et al. (2005), we plotted the number of clusters (K) against logarithm probability relative to standard deviation (ΔK). The genetic distance (GD) between materials was calculated using the similarity program in NTSYS-pc2.10e (Rohlf 2000), with the coefficient parameter set to NEI72. Cluster analysis and dendrogram drawing were performed using the unweighted pair-group method with arithmetic mean (UPGMA) procedure in MEGA 5.1 (Tamura et al. 2011).
To reduce the risk of false-positive marker–trait associations, the MLM in TASSEL v.5.0 (Bradbury et al. 2007, Zhang et al. 2009, 2010) was used to analyze marker–trait association. For MLM_Q + K model analysis, the population structure (Q) and the kinship matrix (K) values were applied as covariates. Finally, 3,301 high-quality SNPs were selected for GWAS and the threshold of P-value for the significance of “suggestive association” that allows one time false positive effect in GWAS test was calculated based on “1/n” method with n being the number of SNPs as noted by many previous studies (Cai et al. 2017, Duggal et al. 2008, Fu et al. 2019, Li et al. 2013, Shi et al. 2018, Sun et al. 2017, Yang et al. 2014). Thus, the SNPs with -log10P ≥3.51 (P = 1/3,301) were regarded as suggestive trait-associated SNPs.
Results
Phenotypic trait variation
The mean values, standard deviations, ranges, and broad-sense heritability (H2) of the five traits related to leaf chemistry for 347 tobacco germplasm accessions are summarized in Table 1. The phenotypic values of these five traits exhibited large variation among the association panels under four environments and BLUPs across all environments, with coefficients of variation ranging from 9.07% for NIC in BLUPs to 53.11% for TP in 17WS. Broad-sense heritability (H2) for the five traits were all lower than 50%, ranging from 37.92% to 45.69%, except in NIC (Table 1), which indicated that the traits were extremely susceptible to the environment and polygenically controlled. Pearson correlation coefficients among the five traits were calculated on the basis of BLUP data from 347 accessions (Table 2). With the exception of NIC and TP, which were not significantly correlated, both positive and negative correlations were detected among the other traits. The highest positive correlation coefficients (up to 0.93) were observed between TS and RS, indicating a strong stable genetic association between TS and RS. However, a strong significant negative correlation (r = –0.81) was observed between TS and TN (Table 2).
Table 1.
Statistics for five leaf chemistry traits in the panel across four environments and BLUPs
| Trait |
Env |
Mean |
SD |
Min |
Max |
CV (%) |
H2 (%) |
| TS |
16YX |
32.15 |
3.34 |
11.77 |
41.32 |
31.49 |
43.15 |
| 16WS |
30.32 |
3.01 |
10.15 |
39.25 |
26.37 |
| 17YX |
29.82 |
2.85 |
11.31 |
39.03 |
25.96 |
| 17WS |
30.09 |
4.07 |
11.57 |
40.38 |
43.16 |
| BLUPs |
30.61 |
2.12 |
11.58 |
40.06 |
22.83 |
| RS |
16YX |
25.16 |
2.13 |
11.73 |
40.58 |
23.36 |
43.11 |
| 16WS |
25.27 |
2.06 |
12.53 |
36.86 |
17.32 |
| 17YX |
24.87 |
3.29 |
11.82 |
38.87 |
35.39 |
| 17WS |
26.03 |
3.61 |
12.04 |
37.96 |
40.19 |
| BLUPs |
25.33 |
2.23 |
12.18 |
38.98 |
24.06 |
| TN |
16YX |
1.97 |
0.22 |
0.94 |
3.68 |
15.71 |
37.92 |
| 16WS |
2.08 |
0.27 |
1.03 |
3.36 |
19.06 |
| 17YX |
2.07 |
0.23 |
1.09 |
3.21 |
16.14 |
| 17WS |
2.13 |
0.25 |
1.11 |
3.53 |
17.38 |
| BLUPs |
2.06 |
0.17 |
1.26 |
3.05 |
11.02 |
| NIC |
16YX |
3.08 |
0.31 |
1.16 |
7.16 |
13.57 |
50.71 |
| 16WS |
3.21 |
0.35 |
1.32 |
7.03 |
15.76 |
| 17YX |
3.01 |
0.29 |
1.43 |
7.35 |
11.79 |
| 17WS |
2.96 |
0.37 |
1.21 |
6.97 |
21.04 |
| BLUPs |
3.07 |
0.18 |
1.61 |
7.08 |
9.07 |
| TP |
16YX |
1.21 |
0.21 |
0.61 |
3.02 |
28.58 |
42.69 |
| 16WS |
1.17 |
0.25 |
0.58 |
3.01 |
33.07 |
| 17YX |
1.31 |
0.23 |
0.63 |
3.05 |
21.07 |
| 17WS |
1.31 |
0.49 |
0.62 |
3.07 |
53.11 |
| BLUPs |
1.25 |
0.19 |
0.68 |
3.03 |
21.79 |
Env: environment, SD: standard deviation, CV: coefficient of variation, H2 (%): board sense heritability, BLUPs: best linear unbiased predictions, TS: total sugar, RS: reducing sugar, TN: total nitrogen, NIC: Nicotine, TP: total potassium.
Note: the BLUPs values was not used for the calculation of the broad-sense heritability.
Table 2.
Pearson’s correlation coefficients between traits in the BLUPs
|
RS |
TN |
NIC |
TP |
| TS |
0.937** |
–0.809** |
–0.661** |
–0.356* |
| RS |
|
–0.782** |
–0.598** |
–0.291* |
| TN |
|
|
0.875** |
0.265* |
| NIC |
|
|
|
0.069 |
*,** Significant at P < 0.05 and P < 0.01, respectively.
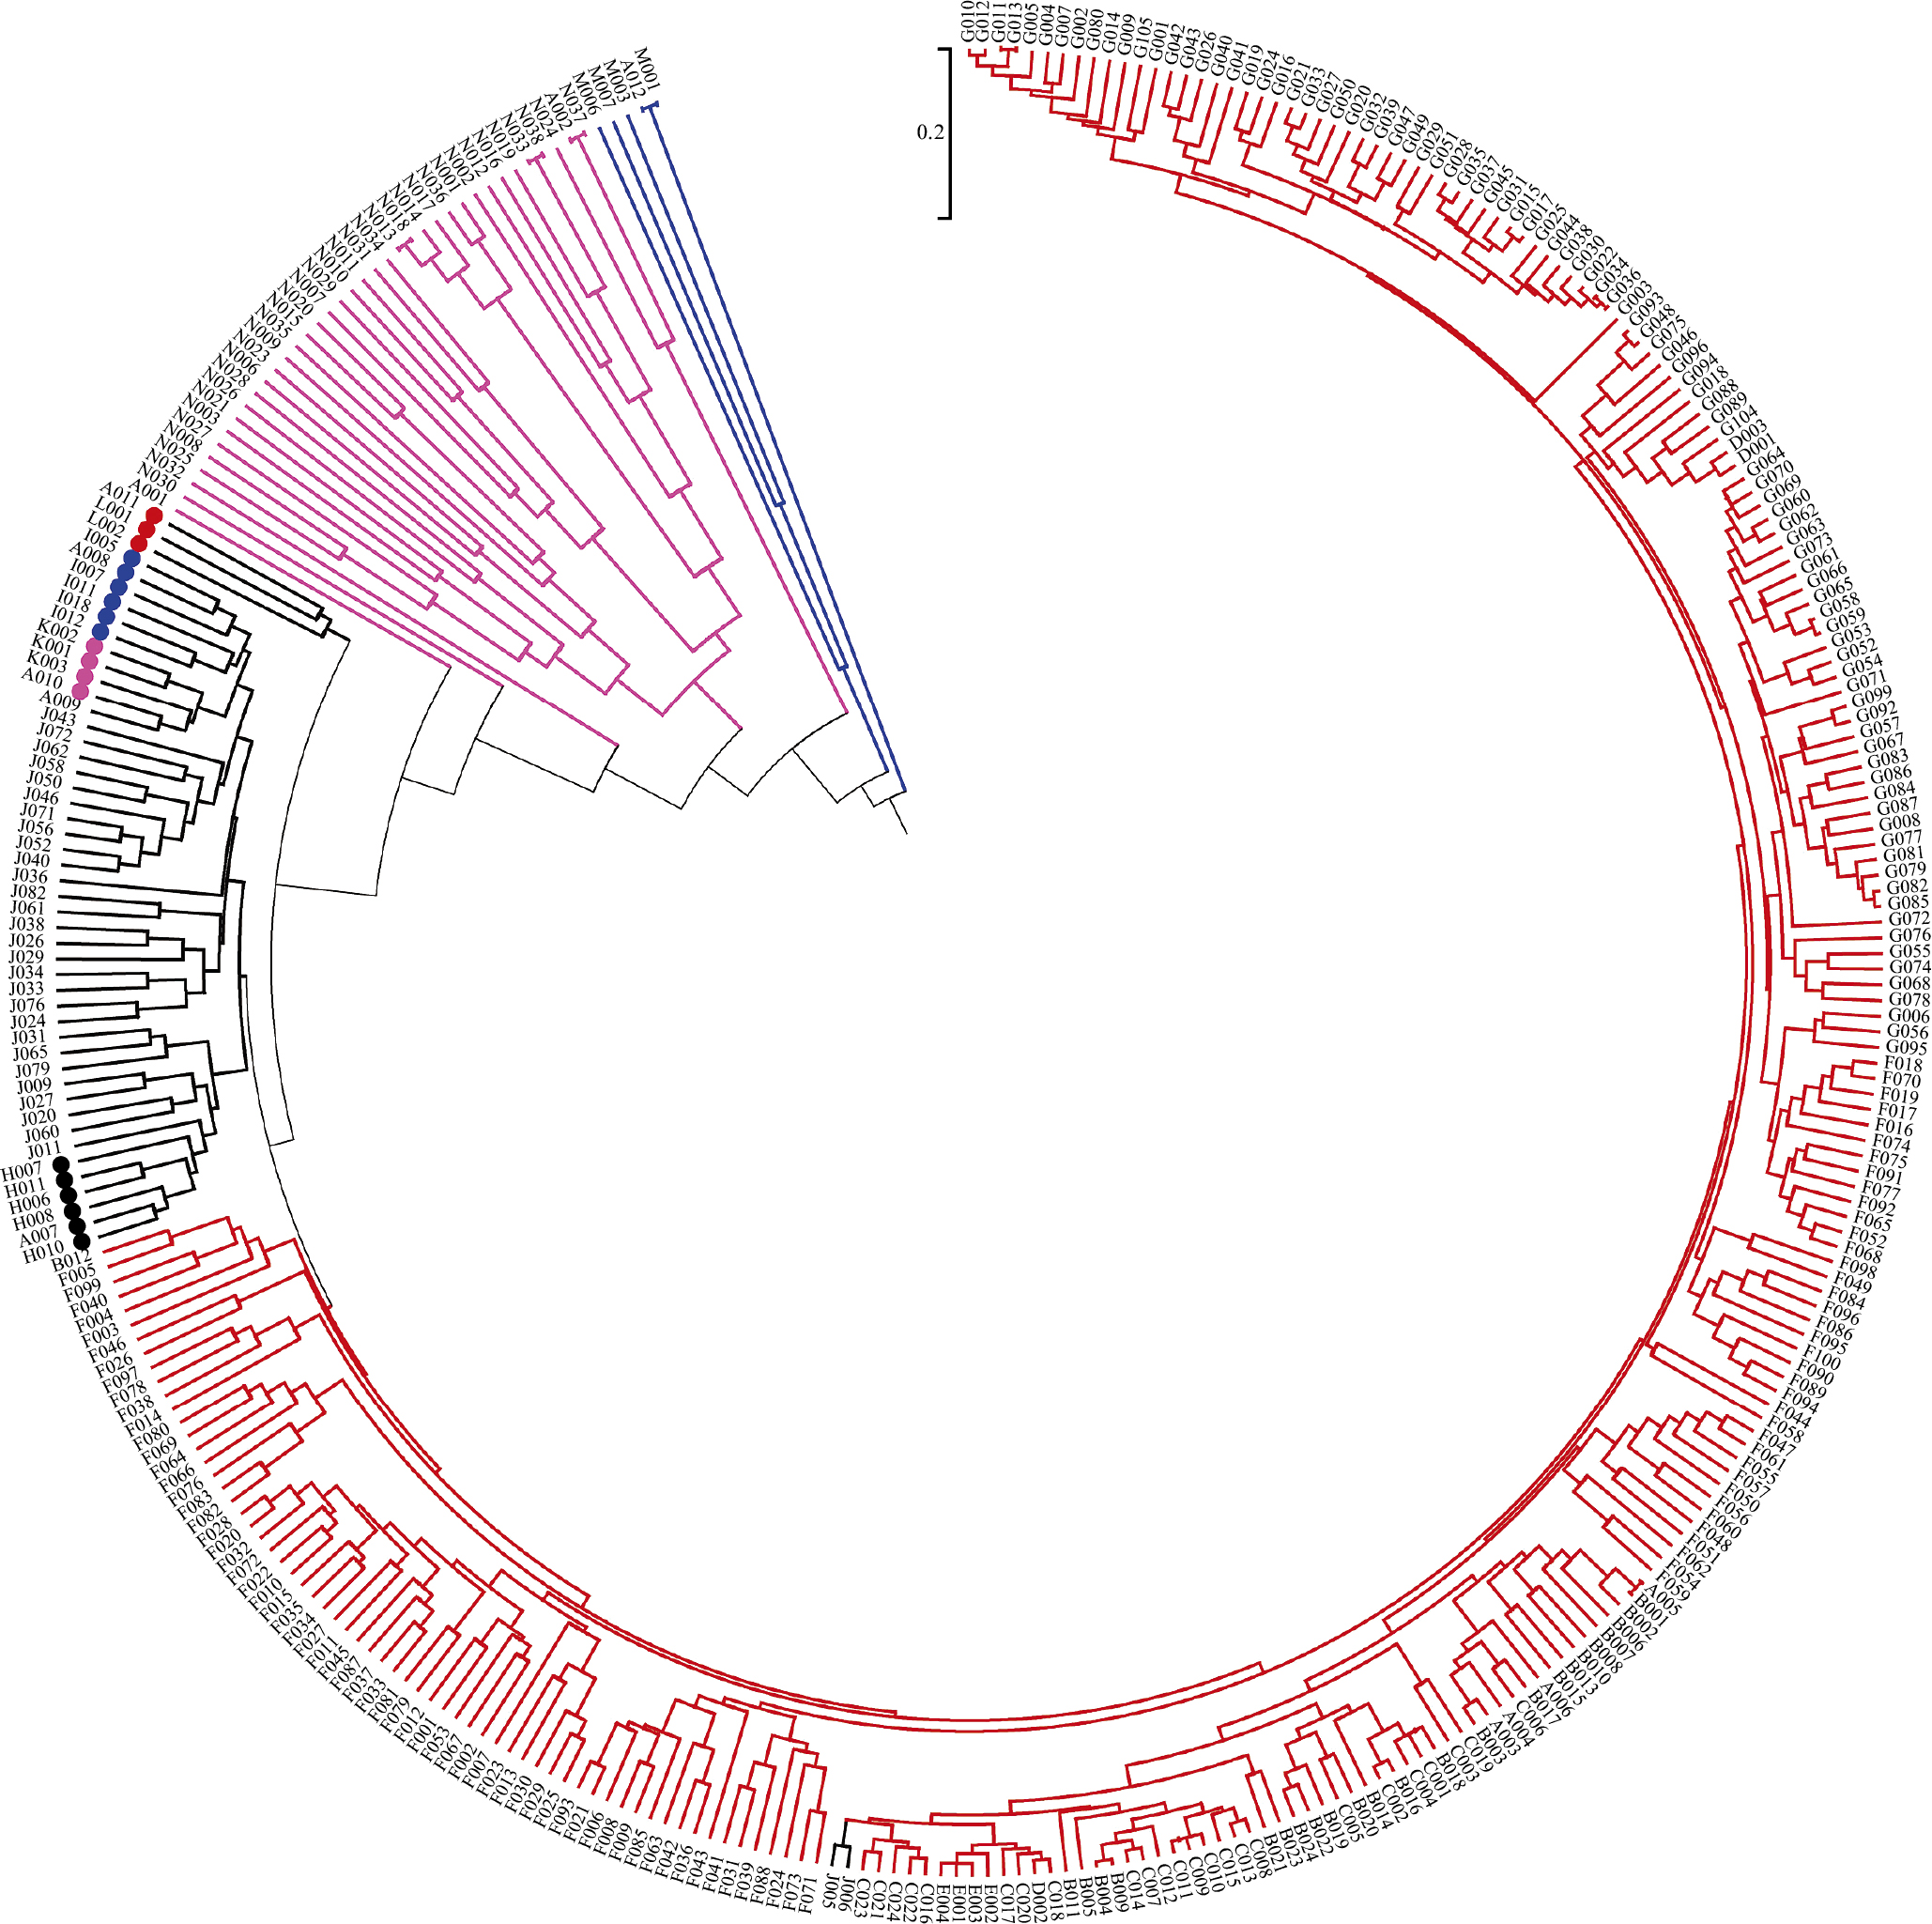
A total of 3,301 SNP markers were selected from 51,718 SNPs distributed randomly on all 24 chromosomes for genetic diversity and population structure analysis. The genetic diversity analysis based on coefficient parameter NEI72 using NTSYS-pc2.10e (Rohlf 2000) revealed that the GD in 347 tobacco resources (varieties) varied from 0.001 to 0.803, with a mean of 0.402 (Supplemental Table 2). Nicotiana tomentosiformis (A002) and Nicotiana otophora (N037); white flower Yunyan 87 (A005) and red flower Yunyan 87(B001); Binchuanlanhuayan (A012) and Bingzhongluolanhua (M001); Coker 139 (G011) and Coker 187-Hicks (G013); Kutsaga 51E (G034) and Kutsage 110 (G036); and Nicotiana nesophila (N013) and Nicotiana stocktonii (N018), Nicotiana kawakamii (N033), and Nicotiana velutina (N038) showed the lowest GD (GD ≈ 0, 0.001–0.003), indicating that the two accessions had the closest kinship. On the other hand, Binchuanlanhuayan (A012), Bingzhongluolanhua (M001) and white flower Yunyan 87 (A005), red flower Yunyan 87(B001), Kutsaga 51E (G034), Kutsage 110 (G036) had the largest GD (0.803), which indicates the furthest kinship between these pairs of accessions. Cluster analysis (Fig. 1) based on UPGMA algorithm with the coefficient parameter set to NEI72, subdivided all of the 347 genotypes into four major groups, which matched with four classical classifications/types at GD = 0.316 (i.e. flue-cured tobacco, sun/air-cured tobacco (including burley-, oriental-, cigar-, maryland-, and sun-cured types), wild tobacco and rustica tobacco). In addition, all the 255 flue-cured tobaccos, including 121 domestic and 134 foreign accessions, were clustered into group I (Red). Fifty air/sun-cured tobaccos, including 3 maryland tobaccos, 6 oriental tobaccos, 4 cigar tobaccos, 6 burley tobaccos, and 31 sun-cured tobaccos were clustered into group II (Black). The 37 wild tobacco accessions were clustered into group III (Pink). The remaining five Nicotiana rustica L. accessions were clustered into group IV (Blue).
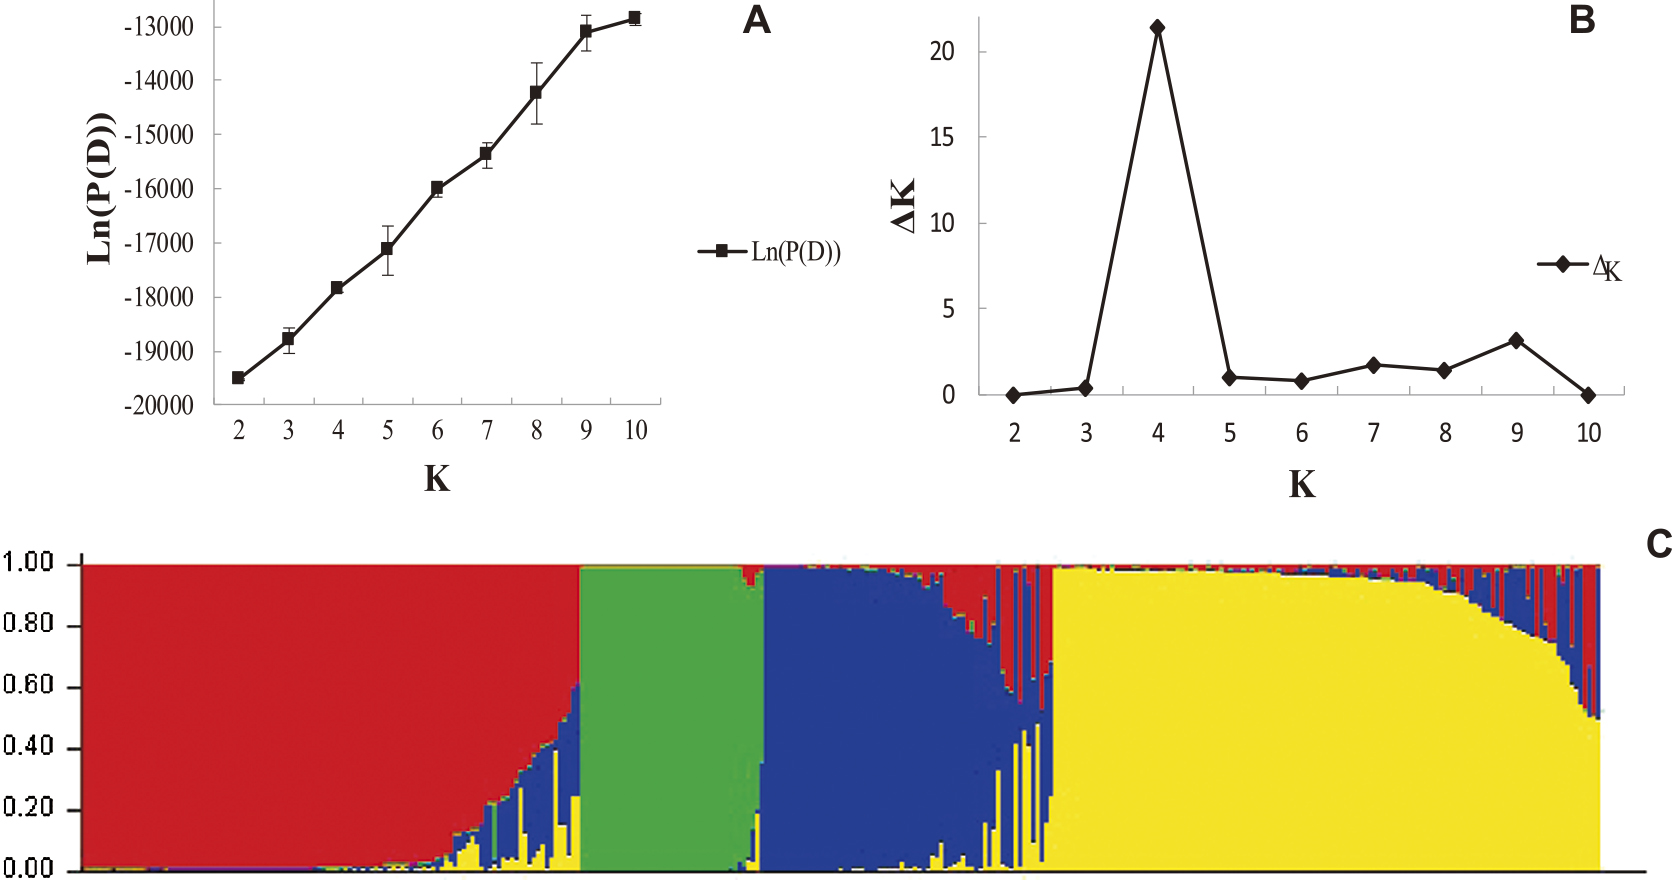
On the basis of an analysis using Structure v.2.3.4, we observed that the Ln(P(D)) (i.e. Ln(P(D)) = Mean LnP(K)) value continuously increased with increase in the assumed subpopulation number K (Fig. 2A). Subsequently, the number of subpopulation (K) was plotted against the ΔK calculated from Structure, and the peak of the broken line graph was observed at K = 4 (Fig. 2B, Supplemental Table 3), indicating that the population was basically divided into four subpopulations (Fig. 2C). Meanwhile, the corresponding Q-matrix calculated by the Structure software (Supplemental Table 4) of each tobacco germplasm accession was analyzed, and the results showed that 270 accessions (77.81%) had Q > 0.90 in a particular subpopulation, which indicates that the tobacco germplasms had relatively simple genetic components and were clearly divided into four subpopulations. Only six accessions (F071: Xiangyin No.1, F073: Xiaobaijin, F087: Zhongyan No.14, F095: 9147, G003: Big Pryor, and G008: Cash) had Q < 0.50 in all the subpopulations and were, therefore, unclassified. The four subpopulations were respectively composed of 114, 42, 66, and 125 accessions.
To minimize false-positive rates, MLM with the structure data (Q) and the relative kinship effects (K) as a covariate was used for association analysis between the five leaf chemistry traits and 3,301 SNP markers in the present study. When applying the strict criteria to the threshold of P-value in GWAS such as 5% significance level with Bonferroni correction (0.05/3301 = 1.51E-05) or 5% level of false discovery rate (FDR), no SNPs fulfill the criteria. Therefore, we adopted the suggestive significance level (1/3301) for the threshold of P-value in this study to screen the useful SNPs associated with the traits of interest. Finally, a total of 47 suggestive SNP–trait associations (P < 1/3,301; 3.03E-4), with 10, 8, 9, 16, and 4 for TS, RS, TN, NIC, and TP, respectively (Table 3, Fig. 3), were detected by MLM_Q + K modeling in at least three environments with phenotypic explanation rates (R2) ranging from 6.03% to 10.56% (Table 3). Among the markers, 15 SNPs with P value ranging from 1.02E-05 to 3.15E-04 were suggestive for all environments. In addition, the frequencies of favorable alleles at the 15 associated loci ranged from 6.63% to 95.39% (Table 4).
Table 3.
SNP markers significantly associated with the five leaf chemistry traits in at least three environments
| Trait |
SNPs |
Chr. |
Position (bp) |
Alleles |
P value |
|
R2 (%) |
| 16YH |
16WS |
17YH |
17WS |
BLUPs |
16YH |
16WS |
17YH |
17WS |
BLUPs |
| TS |
AX-117652681 |
1 |
45886961 |
G/T |
2.52E-04 |
|
2.70E-04 |
2.66E-04 |
|
|
6.71 |
|
6.51 |
6.45 |
|
|
AX-117737992 |
1 |
140322845 |
C/T |
2.03E-04 |
2.40E-04 |
2.05E-04 |
|
|
7.32 |
7.21 |
7.24 |
|
|
|
AX-117738058 |
1 |
140809944 |
G/T |
3.06E-04 |
3.27E-04 |
|
2.87E-04 |
|
6.89 |
6.49 |
|
6.91 |
|
|
AX-117624174 |
5 |
54179653 |
A/G |
3.02E-04 |
3.05E-04 |
3.07E-04 |
|
|
6.7 |
6.61 |
6.59 |
|
|
|
AX-117662582 |
7 |
17189474 |
C/T |
2.33E-04 |
3.06E-04 |
3.01E-04 |
|
|
7.01 |
6.3 |
6.22 |
|
|
|
AX-117626606 |
7 |
17765614 |
C/T |
2.74E-04 |
2.89E-04 |
|
2.77E-04 |
|
6.52 |
6.29 |
|
6.48 |
|
|
AX-117784325 |
16 |
2390565 |
C/T |
2.21E-04 |
2.89E-04 |
2.55E-04 |
2.32E-05 |
2.19E-04 |
6.47 |
6.07 |
6.17 |
6.13 |
6.77 |
|
AX-105998244 |
18 |
10951783 |
A/C |
|
3.01E-04 |
3.15E-04 |
3.11E-04 |
|
|
7.79 |
7.69 |
7.76 |
|
|
AX-117565461 |
18 |
28740733 |
A/G |
2.45E-04 |
|
2.89E-05 |
2.80E-04 |
2.95E-05 |
9.58 |
|
9.12 |
9.2 |
9.01 |
|
AX-117663869 |
23 |
12085222 |
A/G |
1.53E-04 |
1.56E-04 |
1.32E-05 |
1.02E-05 |
1.72E-05 |
10.17 |
9.93 |
10.23 |
10.31 |
9.87 |
| RS |
AX-117544547 |
1 |
43909740 |
A/G |
3.08E-04 |
|
3.03E-04 |
2.84E-04 |
|
6.07 |
|
6.21 |
6.63 |
|
|
AX-117652681 |
1 |
45886961 |
G/T |
2.16E-04 |
1.26E-04 |
2.22E-04 |
|
|
8.18 |
8.26 |
8.04 |
|
|
|
AX-117738058 |
1 |
140809944 |
G/T |
2.81E-04 |
2.88E-04 |
|
2.98E-04 |
|
6.63 |
6.34 |
|
6.28 |
|
|
AX-117565461 |
18 |
28740733 |
A/G |
3.07E-04 |
3.01E-04 |
|
3.05E-04 |
|
7.48 |
7.34 |
|
7.36 |
|
|
AX-117804130 |
18 |
31955001 |
C/T |
3.22E-04 |
|
2.86E-04 |
2.77E-04 |
|
6.08 |
|
6.36 |
6.43 |
|
|
AX-117663869 |
23 |
12085222 |
A/G |
1.12E-04 |
1.68E-04 |
1.95E-05 |
1.43E-04 |
1.05E-05 |
9.01 |
8.79 |
10.55 |
9.07 |
10.56 |
|
AX-117788841 |
24 |
61818930 |
C/T |
3.02E-04 |
2.93E-04 |
2.25E-04 |
|
1.43E-04 |
6.68 |
7 |
7.34 |
|
7.75 |
|
AX-117602774 |
24 |
62718897 |
C/T |
3.03E-04 |
2.87E-04 |
2.83E-04 |
2.56E-04 |
2.57E-04 |
6.67 |
6.95 |
6.98 |
7.25 |
7.26 |
| TN |
AX-117737256 |
1 |
180696766 |
A/G |
2.09E-04 |
2.19E-04 |
1.47E-04 |
2.45E-04 |
1.07E-04 |
7.93 |
7.81 |
8.29 |
7.61 |
8.79 |
|
AX-117745131 |
1 |
207246192 |
C/T |
|
2.12E-04 |
|
1.51E-04 |
1.63E-05 |
|
7.83 |
|
7.98 |
8.08 |
|
AX-117745276 |
1 |
209046941 |
A/C |
3.00E-04 |
|
3.00E-04 |
3.15E-04 |
3.02E-04 |
6.21 |
|
6.19 |
6.13 |
6.11 |
|
AX-117493115 |
3 |
99747785 |
C/T |
3.01E-04 |
|
3.04E-04 |
3.10E-04 |
|
6.12 |
|
6.09 |
6.03 |
|
|
AX-105998127 |
23 |
61545972 |
A/C |
3.03E-04 |
|
2.86E-04 |
2.57E-04 |
|
6.83 |
|
7.06 |
7.32 |
|
|
AX-117701232 |
23 |
62466695 |
C/T |
|
2.11E-04 |
|
2.12E-04 |
2.35E-04 |
|
7.56 |
|
7.56 |
7.37 |
|
AX-117788809 |
24 |
60981914 |
C/T |
1.90E-04 |
1.71E-04 |
2.26E-04 |
2.16E-04 |
2.05E-04 |
7.21 |
7.27 |
7.08 |
7.11 |
7.16 |
|
AX-117788819 |
24 |
61547222 |
A/G |
2.13E-04 |
1.75E-04 |
2.82E-04 |
2.98E-04 |
2.06E-04 |
7.12 |
7.21 |
7.04 |
6.98 |
7.14 |
|
AX-117788841 |
24 |
61818930 |
C/T |
2.16E-04 |
2.25E-04 |
2.13E-04 |
2.03E-04 |
2.00E-04 |
7.1 |
7.08 |
7.11 |
7.15 |
7.18 |
| NIC |
AX-117783954 |
2 |
63080867 |
A/G |
1.50E-04 |
|
|
1.75E-04 |
2.59E-05 |
7.42 |
|
|
7.76 |
8.78 |
|
AX-117783951 |
2 |
63102852 |
A/C |
1.50E-04 |
1.13E-04 |
|
1.38E-04 |
2.89E-05 |
7.54 |
7.63 |
|
7.84 |
8.81 |
|
AX-117783934 |
2 |
63321581 |
A/G |
1.54E-04 |
1.16E-04 |
7.38E-05 |
1.67E-04 |
3.54E-05 |
7.37 |
7.61 |
8.03 |
7.8 |
8.68 |
|
AX-117783925 |
2 |
63518473 |
C/T |
|
1.21E-04 |
7.77E-05 |
1.88E-04 |
3.74E-05 |
|
7.91 |
8.01 |
7.71 |
8.64 |
|
AX-117783886 |
2 |
64203159 |
C/T |
1.71E-04 |
1.26E-04 |
|
1.30E-04 |
4.89E-05 |
7.26 |
7.76 |
|
7.85 |
8.42 |
|
AX-117783878 |
2 |
64316069 |
C/T |
1.75E-04 |
1.27E-04 |
8.97E-05 |
7.52E-05 |
5.32E-05 |
7.21 |
7.7 |
7.97 |
8.16 |
8.27 |
|
AX-117493118 |
3 |
99599478 |
C/T |
|
2.16E-04 |
2.36E-04 |
2.58E-04 |
|
|
7.11 |
7.01 |
6.87 |
|
|
AX-117493115 |
3 |
99747785 |
C/T |
2.44E-04 |
|
2.26E-04 |
2.96E-04 |
1.54E-04 |
7.01 |
|
7.04 |
6.86 |
7.35 |
|
AX-117669987 |
12 |
56592280 |
C/T |
2.50E-05 |
2.55E-05 |
3.55E-05 |
2.59E-05 |
2.45E-05 |
10.23 |
10.23 |
10.11 |
10.08 |
10.26 |
|
AX-117581218 |
15 |
23369014 |
C/T |
2.68E-04 |
2.65E-04 |
|
2.96E-04 |
2.27E-04 |
6.83 |
6.9 |
|
6.68 |
7.18 |
|
AX-117581207 |
15 |
23519083 |
C/T |
2.70E-04 |
|
2.65E-04 |
2.96E-04 |
2.29E-04 |
6.83 |
|
6.95 |
6.69 |
7.15 |
|
AX-105998127 |
23 |
61545972 |
A/C |
1.84E-04 |
1.80E-04 |
1.70E-04 |
|
7.84E-05 |
7.34 |
7.36 |
7.65 |
|
8.47 |
|
AX-117788809 |
24 |
60981914 |
C/T |
5.83E-05 |
3.71E-05 |
1.13E-04 |
5.35E-05 |
2.13E-05 |
8.17 |
8.78 |
8.04 |
8.63 |
9.41 |
|
AX-117500830 |
24 |
61306427 |
A/G |
6.99E-05 |
3.91E-05 |
1.21E-04 |
|
2.15E-05 |
8.13 |
8.76 |
7.95 |
|
9.37 |
|
AX-117788819 |
24 |
61547222 |
A/G |
7.08E-05 |
4.65E-05 |
1.54E-04 |
5.35E-05 |
3.19E-05 |
8.14 |
8.69 |
7.82 |
8.7 |
9.03 |
|
AX-117788841 |
24 |
61818930 |
C/T |
1.02E-04 |
5.18E-05 |
1.66E-04 |
5.50E-05 |
3.34E-05 |
8.03 |
8.63 |
7.8 |
8.58 |
8.91 |
| TP |
AX-105995320 |
1 |
215934239 |
C/T |
3.35E-04 |
3.13E-04 |
|
3.07E-04 |
|
7.3 |
7.63 |
|
7.4 |
|
|
AX-117783616 |
6 |
40862591 |
A/C |
3.03E-04 |
2.85E-04 |
2.84E-04 |
2.98E-04 |
3.09E-04 |
7.05 |
7.31 |
7.3 |
7.68 |
7.39 |
|
AX-117804730 |
16 |
18970594 |
A/G |
3.03E-04 |
|
2.52E-04 |
2.88E-04 |
3.09E-04 |
7.1 |
|
7.87 |
7.81 |
7.36 |
|
AX-106018843 |
24 |
5280311 |
A/G |
3.11E-04 |
2.85E-04 |
2.99E-04 |
|
|
7.32 |
7.46 |
7.33 |
|
|

Table 4.
The phenotypic effect values of favorable alleles identified by GWAS in all environments and potential elite accessions for measured traits
| Trait |
SNP |
Allele |
Freq.
(%) |
Environment |
Mean |
Accessions |
| 16YH |
16WS |
17YH |
17WS |
BLUPs |
| TS |
AX-117784325 |
CC |
10.39 |
31.45a |
29.21a |
29.02a |
29.14a |
29.51a |
29.67a |
Var No. 1668
(G049) |
Yunyan 116
(F086) |
NC 95
(C016) |
|
|
TT |
|
37.26b |
35.43b |
34.93b |
35.20b |
35.72b |
35.71b |
|
AX-117663869 |
AA |
18.86 |
42.96A |
39.03A |
38.91A |
39.09A |
40.02A |
40.00A |
Var No. 1668
(G049) |
Zhongyan 14
(F087) |
Yunyan 116
(F086) |
|
|
GG |
|
27.21B |
27.12B |
26.36B |
27.11B |
27.34B |
27.03B |
| RS |
AX-117663869 |
AA |
18.86 |
30.19A |
30.30A |
29.90A |
31.06A |
30.36A |
30.36A |
Var No. 1668
(G049) |
Virginia 182
(G081) |
Zhongyan 14
(F087) |
|
|
GG |
|
23.16B |
23.25B |
22.63B |
23.18B |
23.45B |
23.13B |
|
AX-117602774 |
CC |
85.01 |
27.03 |
27.16 |
26.78 |
28.05 |
27.36 |
27.28 |
Zhongyan 14
(F087) |
Yellow Special-a
(G089) |
Var No. 1668
(G049) |
|
|
TT |
|
24.87 |
25.06 |
24.95 |
26.14 |
25.07 |
25.22 |
| TN |
AX-117737256 |
AA |
90.63 |
2.71A |
2.82A |
2.81A |
2.90A |
2.86A |
2.82A |
Burley 37
(H010) |
SoTa 2
(H006) |
White Burley 2
(A007) |
|
|
GG |
|
1.85B |
1.91B |
1.86B |
1.93B |
1.89B |
1.89B |
|
AX-117788809 |
CC |
60.23 |
2.43A |
2.38A |
2.40A |
2.53A |
2.51A |
2.45A |
BYS
(H011) |
Burley 37
(H010) |
White Burley 2
(A007) |
|
|
TT |
|
1.94B |
2.03B |
2.05B |
2.10B |
2.00B |
2.02B |
|
AX-117788819 |
AA |
4.61 |
2.60A |
2.71A |
2.70A |
2.76A |
2.69A |
2.69A |
White Burley 2
(A007) |
Burley 37
(H010) |
Burley 21
(H008) |
|
|
GG |
|
1.89B |
2.00B |
1.99B |
2.05B |
1.98B |
1.98B |
|
AX-117788841 |
CC |
10.68 |
2.67A |
2.78A |
2.77A |
2.83A |
2.76A |
2.76A |
Burley 37
(H010) |
BYS
(H011) |
SoTa 2
(H006) |
|
|
TT |
|
1.98B |
2.08B |
2.09B |
2.14B |
2.05B |
2.07B |
| NIC |
AX-117783934 |
AA |
19.88 |
3.91a |
4.04a |
3.84a |
3.79a |
3.90a |
3.90a |
Huininghuang
(G093) |
Fenghuangxiangyan
(J024) |
Axiyan
(J020) |
|
|
GG |
|
3.09b |
3.23b |
3.03b |
3.00b |
3.05b |
3.08b |
|
AX-117783878 |
CC |
9.68 |
2.87A |
3.00A |
2.75A |
2.75A |
2.85A |
2.84A |
Huininghuang
(G093) |
Burley 37
(H010) |
Fenghuangxiangyan
(J024) |
|
|
TT |
|
4.03B |
4.16B |
3.96B |
3.91B |
4.02B |
4.02B |
|
AX-117669987 |
CC |
23.28 |
4.09A |
4.22A |
4.02A |
3.97A |
4.08A |
4.08A |
SoTa 2
(H006) |
Huininghuang
(G093) |
Burley 37
(H010) |
|
|
TT |
|
2.78B |
2.90B |
2.72B |
2.67B |
2.89B |
2.79B |
|
AX-117788809 |
CC |
30.23 |
3.4 |
3.53 |
3.33 |
3.28 |
3.39 |
3.39 |
Axiyan
(J020) |
SoTa 2
(H006) |
Burley 37
(H010) |
|
|
TT |
|
3.03 |
3.16 |
2.96 |
2.91 |
3.02 |
3.02 |
|
AX-117788819 |
AA |
4.61 |
3.71A |
3.84A |
3.64A |
3.59A |
3.70A |
3.70A |
Huininghuang
(G093) |
Burley 37
(H010) |
SoTa 2
(H006) |
|
|
GG |
|
2.99B |
3.12B |
2.92B |
2.86B |
2.96B |
2.97B |
|
AX-117788841 |
CC |
10.68 |
3.88A |
4.01A |
3.81A |
3.76A |
3.87A |
3.87A |
Huininghuang
(G093) |
Axiyan
(J020) |
Fenghuangxiangyan
(J024) |
|
|
TT |
|
2.80B |
2.93B |
2.73B |
2.68B |
2.78B |
2.78B |
| TP |
AX-117783616 |
AA |
6.63 |
1.01A |
0.96A |
1.08A |
0.98A |
1.08A |
1.02A |
Axiyan
(J020) |
C 39-193
(G019) |
Tennessee90
(H007) |
|
|
CC |
|
1.73B |
1.69B |
1.83B |
1.85B |
1.79B |
1.78B |
Freq. (%): the frequencies of favorable alleles; A (a) and B (b) indicate significant difference between alleles on one locus at P < 0.01 (0.05) by ANOVA; accessions: the top three accessions with elite phenotypic performance of the five leaf chemistry traits in tobacco; mean: the mean value of the allele.
For TS, a total of 10 suggestive SNP–trait associations were detected and distributed in six chromosomes. The phenotypic variation percentage (R2) explained by each SNP varied between 6.07% and 10.31% across more than three environments, with AX-117663869 and AX-117784325 having the maximum and the minimum R2 values, respectively (Table 3). In addition, the two SNPs located on Chr.16 (AX-117784325) and Chr.23 (AX-117663869) were detected in all environments (Table 3). For RS, eight suggestive associations were detected and two of them were detected under all environments, accounting for 25.0% of all SNP–trait associations, whereas the other six SNPs were only detected in at least three different environments (Table 3). The most reliable association was observed in AX-117663869, explaining 10.56% of the phenotypic variation in BLUPs. Notably, this SNP was associated with TS as well as RS on chromosome 23, and the TS predicted from the SNP exhibited significant correlation with the RS, moreover, the both content levels increased with the number of favorable alleles (Tables 2, 4).
For NIC, 16 SNP–trait associations were identified, representing the largest number for all measured traits, and six of these SNPs were detected in all environments. The most reliable associated SNP was AX-117669987 on chromosome 12 and explained 10.26% of the total phenotypic variation under BLUPs. For TN, nine SNPs were detected, which explained between 6.03% and 8.79% of the phenotypic variation across more than three different environments. Similarly, an SNP cluster with three associated SNPs (AX-117788809, AX-117788819, and AX-117788841) was located within the same genomic region of chromosome 24 and was suggestively co-associated with TN and NIC in all environments (Table 3). For TP, only four SNP–trait associations were detected and all SNPs showed weak associations, particularly AX-105995320 (Chr.1), due to a high P value (>0.0003) or low -log10 (p-value) (<3.5) in at least three environments.
Favorable alleles and elite accessions
To identify the favorable alleles of the SNPs detected in all environments, the mean values of the alleles were measured on the basis of the phenotypic values of the five leaf chemistry traits in four environments and BLUPs (Table 4). Three (AX-117663869, AX-117788819, and AX-117788841) out of 15 stable SNP-trait associations were detected in multiple traits, and the frequencies of favorable alleles among the three SNPs were 18.86%, 4.61%, and 10.68%, respectively. The favorable allele at SNP locus AX-117663869 (AA) under all environments improved the TS and RS by mean values of 12.97 and 17.23, respectively. In addition, the SNP markers AX-117788819 and AX-117788841, with the favorable allele AA and CC, increased the TN and NIC in all environments by mean values of 0.71, 0.69, and 0.73, 1.09, respectively. Among the stable favorable alleles for all the measured traits, the effects of the SNP markers AX-117602774 and AX-117788809 were not significantly different between two alleles in RS and NIC, based on ANOVA analysis (Table 4). For each locus, the top three elite accessions containing the favorable alleles were listed (Table 4). Burley 37, SoTa 2, and Huininghuang, which had more than five favorable alleles of the measured traits, were popular accessions. In addition, some elite accessions harbored favorable alleles of more than one trait, e.g., Var No.1668 and Zhongyan 14, Burley 37 and SoTa 2, and Axiyan, which contained favorable alleles of TS and RS, TN and NIC, and NIC and TP, respectively.
Discussion
Genetic diversity and population structure analysis
A total of 3,301 high-quality polymorphic SNP markers were used to evaluate genetic diversity in 347 tobacco germplasm accessions at the genome level. GD is a measure of the genetic divergence between species or between populations within a species. The mean GD based on coefficient parameter NEI72 was 0.402, ranging from 0.001 to 0.803, which is higher than the value reported by numerous previous studies on in N. tabacum L. germplasms (Del Piano et al. 2000, Moon et al. 2008, 2009a, 2009b), but is similar to those of 312 worldwide tobacco germplasms obtained from Philip Morris International, where an average GD value of 0.483 was obtained using 49 SSR markers (Fricano et al. 2012). The major reason for the higher GD value in the present study is that the 347 tobacco accessions included not only 37 different wild tobacco species but also two tobacco subgenuses (Nicotiana tabacum L. and Nicotiana rustica L.). Cluster analysis using UPGMA (Fig. 1) revealed that the 347 tobacco accessions were classified into four groups at the level of GD = 0.316. The finding is consistent with the general views on the existence of genetic differences among tobacco varieties (commercial classes) or different clades (Fricano et al. 2012). The results above indicate that the wild tobacco species have higher levels of polymorphisms than cultivated tobaccos. The finding also suggests that wild tobacco is significantly rich in genetic variation, potentially because genetic drift, mutations, and natural selection have caused changes in the gene frequencies among individuals. However, the mean GD value (0.237) is consistent with previous studies (Moon et al. 2008, 2009a, 2009b) when considering cultivated tobaccos, particularly the flue-cured tobaccos only. At a relatively low GD level (GD = 0.223), all the 255 flue-cured tobacco cultivars could be clustered into one group (Fig. 1), which implies a close kinship in the flue-cured tobaccos and an urgent need to facilitate the introduction and utilization of non-flue-cured tobacco, particularly the wild tobacco germplasms, to expand the genetic basis of the breeding parents.
Genetic structure analysis of genetic diversity and populations in germplasm resources is a prerequisite for association mapping (Harris and Stokesbury 2010). In the present study, 347 tobacco germplasms were divided into four groups at GD = 0.316, which composed of 255, 50, 37, and 5 accessions based on UPGMA. In addition, all the accessions were assigned into four subpopulations, each comprising 114, 42, 66, and 125 tobaccos, by the population genetic structure analysis based on mathematical models. There was a major difference between the classification results of the two analyses, mainly due to the different bases used for the classification. The cluster analysis (i.e. UPGMA) was based on the GD among the tobacco materials and reflected the degree of kinship between tobacco accessions. The classification of population genetic structure (i.e. analysis using Structure software) was consistent with the subpopulation number and complied with the Hardy–Weinberg equilibrium, based on the mathematical models and the calculated Q values corresponding to each tobacco germplasm. The division of population structure is an important factor influencing the results of an association analysis, and an unreasonable division of a population structure could cause spurious association between markers and traits (Flint-Garcia et al. 2005, Gupta et al. 2005, Pritchard et al. 2000a). Numerous studies have demonstrated that spurious SNP–trait associations could be minimized by considering the population structure (Q-matrix calculated by the Structure software) as a covariate during the marker–trait association analysis (Pritchard et al. 2000b, Zhang et al. 2010). In the present study, Structure 2.3.4 showed more detailed information about population structure than UPGMA, and that the more detailed information of Structure 2.3.4 was the main reason to use its result for GWAS. Among the 347 accessions, 321 were distinctly assigned into four subpopulations at a high threshold (Q ≥ 0.8), which indicated that all genotypes used in the current study were unrelated or very weakly related and that all the genotypes were suitable for association mapping analyses.
Association mapping of leaf chemistry traits
Exploring elite genes in crops by association analysis is a key method used in plant genomics. Compared with QTL mapping, association analysis does not specifically construct a mapping population and makes use of natural populations or germplasm resources (Zhang et al. 2010). Here, MLM_Q + K modeling was applied to prevent potentially spurious associations due to false positives. Forty-seven loci were significantly detected in at least three environments, and they explained 6.03% to 10.56% of the phenotypic variance. Among the markers, 15 SNPs suggestively associated with the five investigated traits under all the environments were detected, which could imply that the loci were highly stable and reliable SNP-association traits. Previous analyses of QTLs associated with leaf chemistry traits in tobacco have been very limited, and existing QTL analyses are still limited to those conducted on the basis of partial genetic linkage maps, biparental mapping populations, and non-SNP marker systems (Julio et al. 2006, Xiao et al. 2008, Zhou et al. 2013). To date, 75 QTLs on 12 linkage groups (LGs) for 59 traits, including agronomic traits, leaf chemical components, and smoke properties (Julio et al. 2006) have been detected, based on partial genetic linkage maps developed on the basis of AFLP, ISSR, SSAP, and SCAR markers on recombinant inbred line populations from a cross between two flue-cured tobacco inbred lines. Few QTLs were observed for leaf chemical components, i.e. three, two, and only one QTL controlling RS, NIC, and TN, respectively, have been reported in LG03, LG12, LG09, and LG17 (Julio et al. 2006). In the present study, 8, 16, and 9 SNP markers associated with RS, NIC, and TN, respectively, were detected on eight different chromosomes. Similarly, 2 QTLs have been reported to be linked to TS in linkage group LG07 and LG11, namely, qTS07 and qTS11, with R2 values of 8.13% and 7.56%, respectively, based on composite interval mapping (Xiao et al. 2008), whereas 10 associated SNP markers were detected in the present study on six chromosomes. In addition, no relevant studies have reported on the four SNP markers associated with TP, which was detected by association analysis in the present study. Moreover, based on available tobacco genome in a web resource (ftp://ftp.sgn.cornell.edu/genomes/Nicotiana_tabacum/), we attempted to perform comparisons between our suggestively associated SNP marker sequences and the linked non-SNP marker sequences (QTLs) reported and to determine whether these markers/loci were located on similar regions of the chromosomes. However, we did not discern any relationship. To date, to the best of our knowledge, this is the first report on the identification of loci for leaf chemistry traits using genome-wide SNP markers via association mapping in a large amount of tobacco germplasms. Although few association mapping analyses based on fewer number of SSR markers have been reported previously by Fricano et al. (2012) and Basirnia et al. (2014), respectively, there were no common marker-association traits between previous association analyses and the present study owing to the difference of the available genetic variation (i.e. the present study uses large genetic diversity, while the previous studies used bi-parental populations with small diversity).
Potential applications in tobacco quality breeding
Gene pyramiding has been demonstrated to be an effective approach in improving not only a crop’s agronomic traits but also complex traits such as yield components and quality-related traits (Zheng et al. 2017). Stable markers for SNP-association traits explaining higher phenotypic variation, such as AX-117663869, which was detected on chromosome 23 and explained the genotypic correlations of TS and RS, consistent with the results of a correlation analysis in the present study, could be used for the improvement of TS and RS in marker-assisted breeding (Table 4). Markers AX-117737256, AX-117669987, and AX-117783616, with high phenotypic variation explained, could be used for the improvement of TN, NIC, and TP, respectively (Table 4). The cultivars Var No. 1668 and Zhongyan 14 had higher contents of both TS and RS; therefore, they could be used as parents in the genetic improvement of related traits. Germplasms of multiple associated SNP markers with higher numbers of favorable alleles included Burley 37, SoTa 2, and Axiyan (Table 4), and they are potential elite donor parents for the improvement of TN and NIC contents in breeding programs. On the basis of the number of favorable alleles that could be pyramided into an individual plant and their expected phenotypic effects, the above five optimal parents were proposed for use in the improvement of leaf chemistry traits for high-quality tobacco.
In conclusion, GWAS was successfully employed in the identification of genetic loci for five leaf chemistry traits including TS, RS, TN, NIC, and TP in tobacco. Fifteen suggestively associated SNP markers were detected with a P < 3.03E-04 under four environments and BLUPs distributed on chromosomes 1, 2, 6, 12, 16, 23, and 24, respectively. In addition, some elite tobacco accessions harboring favorable alleles were mined. The genetic loci and elite tobacco accessions identified in the current study could facilitate marker-assisted selection in the genetic improvement of tobacco quality.
Authors Contribution Statements
Zhijun Tong, Bingguang Xiao and Yongping Li conceived and designed the study. Xuejun Chen and Fangchan Jiao provided plant material and contributed to the field experiment. Fangchan Jiao and Yihan Zhang prepared the libraries and performed the experimental operation. Zhijun Tong and Yihan Zhang carried out the experimental data analysis. Zhijun Tong, Dunhuang Fang, Bingguang Xiao and Yongping Li wrote the manuscript. Bingguang Xiao and Yongping Li supervised the study. All authors read and approved the final manuscript.
Acknowledgments
This work was financially supported by China National Tobacco Company (110201801029(JY-06), 110201603008, and 110201601027(JY-01)) and Yunnan Tobacco Company (2017YN05, 2017YN01, and 2018530000241005).
Literature Cited
- Basirnia, A., H.H. Maleki, R. Darvishzadeh and F. Ghavami (2014) Mixed linear model association mapping for low chloride accumulation rate in oriental-type tobacco (Nicotiana tabaccum L.) germplasm. J. Plant Interact. 9: 666–672.
- Bowman, D.T. and V. Sisson (2000) A historical overview of flue-cured tobacco breeding in the U.S.A. Tobacco Science 44: 59–64.
- Bradbury, P.J., Z. Zhang, D.E. Kroon, T.M. Casstevens, Y. Ramdoss and E.S. Buckler (2007) TASSEL: Software for association mapping of complex traits in diverse samples. Bioinformatics 23: 2633–2635.
- Cai, C.P., G.Z. Zhu, T.Z. Zhang and W.Z. Guo (2017) High-density 80 K SNP array is a powerful tool for genotyping G. hirsutum accessions and genome analysis. BMC Genomics 18: 654.
- Chang, A.X., X.H. Jia, Q.F. Feng, Y. Zhang, L. Cheng, A. Yang and C.G. Luo (2013) Parentage analysis of Chinese flue-cured tobacco varieties and breeding suggestion. Chinese Tobacco Science 34: 1–6.
- Clarkson, J.J., K.Y. Lim, A. Kovarik, M.W. Chase, S. Knapp and A.R. Leitch (2005) Long-term genome diploidization in allopolyploid Nicotiana section Repandae (Solanaceae). New Phytol. 168: 241–252.
- Del Piano, L., M. Abet, C. Sorrentino, F. Acanfora, E. Cozzolino and A. DiMuro (2000) Genetic variability in Nicotiana tabacum and Nicotiana species as revealed by RAPD procedure. International Contribution to Tobacco Research 19: 1–15.
- Duggal, P., E.M. Gillanders, T.N. Holmes and J.E. Bailey-Wilson (2008) Establishing an adjusted p-value threshold to control the family-wide type 1 error in genome wide association studies. BMC Genomics 9: 516.
- Edwards, K.D., N. Fernandez-Pozo, K. Drake-Stowe, M. Humphry, A.D. Evans, A. Bombarely, F. Allen, R. Hurst, B. White, S.P. Kernodle et al. (2017) A reference genome for Nicotiana tabacum enables map-based cloning of homeologous loci implicated in nitrogen utilization efficiency. BMC Genomics 18: 448.
- Endelman, J.B. (2011) Ridge regression and other kernels for genomic selection with R package rrBLUP. Plant Genome 4: 250–255.
- Evanno, G., S. Regnaut and J. Goudet (2005) Detecting the number of clusters of individuals using the software STRUCTURE: a simulation study. Mol. Ecol. 14: 2611–2620.
- Falush, D., M. Stephens and J.K. Pritchard (2003) Inference of population structure using multilocus genotype data: linked loci and correlated allele frequencies. Genetics 164: 1567–1587.
- Fan, W., X. Sun and A. Yang (2015) Exploring high-potassium favorable allele mutation of tobacco based on genome-wide association analysis. Acta Tabacaria Sinica 25: 11–19.
- Flint-Garcia, S.A., A.C. Thuillet, J. Yu, G. Pressoir, S.M. Romero, S.E. Mitchell, J. Doebley, S. Kresovich, M.M. Goodman and E.S. Buckler (2005) Maize association population: a high-resolution platform for quantitative trait locus dissection. Plant J. 44: 1054–1064.
- Fricano, A., N. Bakaher, M. Del Corvo, P. Piffanelli, P. Donini, A. Stella, N.V. Ivanov and C. Pozzi (2012) Molecular diversity, population structure, and linkage disequilibrium in a worldwide collection of tobacco (Nicotiana tabacum L.) germplasm. BMC Genet. 13: 18.
- Fu, Y.Z., C.G. Dong, J. Wang, Y.Y. Wang and C.L. Li (2019) Genome-wide association study reveals the genetic control underlying node of the first fruiting branch and its height in upland cotton (Gossypium hirsutum L.). Euphytica 215: 35.
- Goodspeed, T.H. (1954) The genus Nicotiana. Chron. Bot. 16: 102–135.
- Griffith, R.B. (1957) The rapid determination of tobacco alkaloids by steam distillation. Tob. Sci. 1: 130–137.
- Gupta, P.K., S. Rustgi and P.L. Kulwal (2005) Linkage disequilibrium and association studies in higher plants: Present status and future prospects. Plant Mol. Biol. 57: 461–485.
- Gyawali, S., S.M. Chao, S.S. Vaish, S.P. Singh, S. Rehman, S.R. Vishwakarma and R.P.S. Verma (2018) Genome wide association studies (GWAS) of spot blotch resistance at the seedling and the adult plant stages in a collection of spring barley. Mol. Breed. 38: 62.
- Hancock, W.G. and R.S. Lewis (2017) Heterosis, transmission genetics, and selection for increased growth rate in a N. tabacum × synthetic tobacco cross. Mol. Breed. 37: 53.
- Harris, B.P. and K.D.E. Stokesbury (2010) The spatial structure of local surficial sediment characteristics on Georges Bank, USA. Cont. Shelf Res. 30: 1840–1853.
- Harvey, W.R., H.M. Stajr and W.C. Smith (1969) Automated determination of reducing sugars and nicotine alkaloids on the same extract of tobacco leaf. Tob. Sci. 13: 13–15.
- Julio, E., B.D. Rothan, J.L. Verrier and F.D. de Borne (2006) Detection of QTLs linked to leaf and smoke properties in Nicotiana tabacum based on a study of 114 recombinant inbred lines. Mol. Breed. 18: 69–91.
- Li, H., Z. Peng, X. Yang, W. Wang, J. Fu, J. Wang, Y. Han, Y. Chai, T. Guo, N. Yang et al. (2013) Genome-wide association study dissects the genetic architecture of oil biosynthesis in maize kernels. Nat. Genet. 45: 43–50.
- Li, J., Y.Y. Tang, A.L. Jacobson, P.M. Dang, X. Li, M.L. Wang, A. Hagan and C.Y. Chen (2018a) Population structure and association mapping to detect QTL controlling tomato spotted wilt virus resistance in cultivated peanuts. Crop J. 6: 516–526.
- Li, J.Y., J.D. Liu, W. Wen, P.Z. Zhang, Y.X. Wan, X.C. Xia, Y. Zhang and Z.H. He (2018b) Genome-wide association mapping of vitamins B1 and B2 in common wheat. Crop J. 6: 263–270.
- Lin, C.Y. and F.R. Allaire (1977) Heritability of a linear combination of traits. Theor. Appl. Genet. 51: 1–3.
- Moon, H.S., J.S. Nicholson and R.S. Lewis (2008) Use of transferable Nicotiana tabacum L. microsatellite markers for investigating genetic diversity in the genus Nicotiana. Genome 51: 547–559.
- Moon, H.S., J.S. Nicholson, A. Heineman, K. Lion, R. van der Hoeven, A.J. Hayes and R.S. Lewis (2009a) Changes in genetic diversity of U.S. flue-cured tobacco germplasm over seven decades of cultivar development. Crop Sci. 49: 498–508.
- Moon, H.S., J.M. Nifong, J.S. Nicholson, A. Heinemann, K. Lion, R. van der Hoeven, A.J. Hayes and R.S. Lewis (2009b) Microsatellite-based analysis of tobacco (Nicotiana tabacum L.) genetic resources. Crop Sci. 49: 2149–2159.
- Mora, F., Y.A. Quitral, I. Matus, J. Russell, R. Waugh and A. del Pozo (2016) SNP-based QTL mapping of 15 complex traits in Barley under rain-fed and well-watered conditions by a mixed modeling approach. Front. Plant Sci. 7: 909.
- Pace, J., C. Gardner, C. Romay, B. Ganapathysubramanian and T. Lubberstedt (2015) Genome-wide association analysis of seedling root development in maize (Zea mays L.). BMC Genomics 16: 47.
- Pritchard, J.K., M. Stephens, N.A. Rosenberg and P. Donnelly (2000a) Association mapping in structured populations. Am. J. Hum. Genet. 67: 170–181.
- Pritchard, J.K., M. Stephens and P. Donnelly (2000b) Inference of population structure using multilocus genotype data. Genetics 155: 945–959.
- Ren, M., C. Zhang and C. Jiang (2014) Association analysis of tobacco aroma constituents based on high density SSR linkage group. Acta Tabacaria Sinica 20: 88–93.
- Rohlf, F.J. (2000) Numerical Taxonomy and Multivariate Analysis System NTSYS-pc version 2.1 User Guide. Exeter Software Setauket, New York.
- Sarala, K. and R.V.S. Rao (2008) Genetic diversity in Indian FCV and burley tobacco cultivars. J. Genet. 87: 159–163.
- Shi, W.P., L.Q. Yue, J.Y. Cheng, J.H. Guo, L.L. Li, K.D. Xie, J.R. Dong, Y.H. Xu, J. Guo and M.X. Zhou (2018) A genome-wide associate study reveals favorable alleles conferring apical and basal spikelet fertility in wheat (Triticum aestivum L.). Mol. Breed. 38: 146.
- Sierro, N., J.N.D. Battey, S. Ouadi, L. Bovet, S. Goepfert, N. Bakaher, M.C. Peitsch and N.V. Ivanov (2013) Reference genomes and transcriptomes of Nicotiana sylvestris and Nicotiana tomentosiformis. Genome Biol. 14: R60.
- Sierro, N., J.N.D. Battey, S. Ouadi, N. Bakaher, L. Bovet, A. Willig, S. Goepfert, M.C. Peitsch and N.V. Ivanov (2014) The tobacco genome sequence and its comparison with those of tomato and potato. Nat. Commun. 5: 3833.
- Sierro, N., J.N.D. Battey, L. Bovet, V. Liedschulte, S. Ouadi, J. Thomas, H. Broye, H. Laparra, A. Vuarnoz, G. Lang et al. (2018) The impact of genome evolution on the allotetraploid Nicotiana rustica—an intriguing story of enhanced alkaloid production. BMC Genomics 19: 855.
- Singh, D., L.A. Ziems, P.M. Dracatos, M. Pourkheirandish, S. Tshewang, P. Czembor, S. German, R.A. Fowler, L. Snyman, G.J. Platz et al. (2018) Genome-wide association studies provide insights on genetic architecture of resistance to leaf rust in a worldwide barley collection. Mol. Breed. 38: 43.
- Sun, Z., X. Wang, Z. Liu, Q. Gu, Y. Zhang, Z. Li, H. Ke, J. Yang, J. Wu, L. Wu et al. (2017) Genome-wide association study discovered genetic variation and candidate genes of fibre quality traits in Gossypium hirsutum L. Plant Biotechnol. J. 15: 982–996.
- Tamura, K., D. Peterson, N. Peterson, G. Stecher, M. Nei and S. Kumar (2011) MEGA5: Molecular evolutionary genetics analysis using maximum likelihood, evolutionary distance, and maximum parsimony methods. Mol. Biol. Evol. 28: 2731–2739.
- Thornsberry, J.M., M.M. Goodman, J. Doebley, S. Kresovich, D. Nielsen and E.S. Buckler IV (2001) Dwarf8 polymorphisms associate with variation in flowering time. Nat. Genet. 28: 286–289.
- Tong, Z.J., B.G. Xiao, F.C. Jiao, D.H. Fang, J.M. Zeng, X.F. Wu, X.J. Chen, J.K. Yang and Y.P. Li (2016) Large-scale development of SSR markers in tobacco and construction of a linkage map in flue-cured tobacco. Breed. Sci. 66: 381–390.
- Wang, Y.Y. and J. Zhou (1995) Parentage analysis of major tobacco varieties and tobacco breeding in America and China. Acta Tabacaria Sinica 2: 11–22.
- Xiao, B.G., X.P. Lu, F.C. Jiao, Y. Li, Y. Sun and Z. Guo (2008) Preliminary QTL analysis of several chemical components in flue-cured tobacco (Nicotiana tabacum L.). Acta Agronomica Sinica 34: 1762–1769.
- Yang, N., Y.L. Lu, X.H. Yang, J. Huang, Y. Zhou, F. Ali, W. Wen, J. Liu, J. Li and J. Yan (2014) Genome wide association studies using a new nonparametric model reveal the genetic architecture of 17 agronomic traits in an enlarged maize association panel. PLoS Genet. 10: e1004573.
- Yu, Y.W., Y.S. Xia and R.H. Li (2014) Association analysis of tobacco specific nitrosamines content in tobacco germplasm. Acta Tabacaria Sinica 20: 48–55.
- Zhang, J.S., R.G. Wang, C.Y. Yang, C. Wu, Y.W. Shi, Z.H. Wang, Y. Wang and X.L. Ren (2012) Genetic diversity of agronomic traits and association analysis with SRAP markers in flue-cured tobacco (Nicotiana tabacum) varieties from China and abroad. Acta Agronomica Sinica 38: 1029–1041.
- Zhang, Z., E.S. Buckler, T.M. Casstevens and P.J. Bradbury (2009) Software engineering the mixed model for genome-wide association studies on large samples. Brief. Bioinformatics 10: 664–675.
- Zhang, Z., E. Ersoz, C. Lai, R.J. Todhunter, H.K. Tiwari, M.A. Gore, P.J. Bradbury, J. Yu, D.K. Arnett, J.M. Ordovas et al. (2010) Mixed linear model approach adapted for genome-wide association studies. Nat. Genet. 42: 355–360.
- Zheng, Z., S. Gao, M.X. Zhou, G.J. Yan and C.J. Liu (2017) Enhancing Fusarium crown rot resistance by pyramiding large-effect QTL in common wheat (Triticum aestivum L.). Mol. Breed. 37: 107.
- Zhou, G.F., D.R. Hao, L. Xue, G.Q. Chen, H.H. Lu, Z.L. Zhang, M.L. Shi, X.L. Huang and Y.X. Mao (2018) Genome-wide association study of kernel moisture content at harvest stage in maize. Breed. Sci. 68: 622–628.
- Zhou, L.Y., R.Y. Li, L.J. Fan, Y. Shi, Z. Wang, S. Xie, Y.J. Gui, X. Ren and J. Zhu (2013) Mapping epistasis and environment × QTX interaction based on four-omics genotypes for the detected QTX loci controlling complex traits in tobacco. Crop J. 6: 151–159.
