Abstract
Cadmium (Cd) is as an extremely toxic metal that can contaminate agricultural soils. To reduce the risk of Cd intake in food cereals, the development of cultivars with low grain Cd concentration (GCC) is an effective countermeasure. We analyzed quantitative trait loci (QTLs) for GCC in a doubled haploid (DH) common wheat (Triticum aestivum L.) population derived from ‘Chugoku 165’ (low GCC) × ‘Chukei 10-22’ (high GCC). We found novel loci for low GCC on the short arm of chromosome 4B and on the long arm of chromosome 6B. These QTLs accounted for 9.4%–25.4% (4B) and 9.0%–17.8% (6B) of the phenotypic variance in the DH population. An association analysis with 43 cultivars identified 3 loci at these QTLs: QCdc.4B-kita, QCdc.6B-kita1, and QCdc.6B-kita2. In contrast to durum wheat and barley, no QTL was detected on the chromosomes of homeologous group 5 for heavy metal P1B-type ATPase 3. These results will contribute to marker-assisted selection for low GCC in breeding of common wheat.
Introduction
Cadmium (Cd) is as an extremely toxic metal. In humans, Cd damages the liver and kidneys and can cause weakening of bones (osteoporosis), resulting in joint and back pain (Järup and Åkesson 2009, Nishijo et al. 2006, Olsson et al. 2005). Cd contamination of agricultural land originating from old mines and smelters occurs in Japan. In 2017, the Japanese Ministry of the Environment reported that 97 farmland areas (total of 6709 ha) contained high soil Cd concentrations (http://www.env.go.jp/press/files/jp/110461.pdf). Because wheat grows normally even in fields highly contaminated with Cd, the grain can absorb and accumulate Cd (Grant et al. 1998). To reduce the health risk caused by Cd intake, the Codex Committee set the international standard for grain Cd concentration (GCC) in wheat at the maximum acceptable level of 0.2 ppm (Codex Alimentarius Commission 2005a, 2005b). Three countermeasures are used primarily to reduce wheat GCC: (1) soil dressings, soil washings and phytoremediation to reduce soil Cd concentrations, (2) cultivation management with the application of ZnSO4 (Saifullah et al. 2014) or (NH4)2SO4 or urea fertilizers in place of NH4Cl fertilizer (Ishikawa et al. 2015) to suppress Cd uptake, and (3) low-GCC cultivars to minimize Cd uptake. The use of low-GCC cultivars may be the most effective way to diminish the risk of Cd intake, because the other countermeasures are time consuming and costly.
Genotypic variation in GCC has been reported in wheat (Greger and Löfstedt 2004, Kubo et al. 2008, 2011, Li et al. 1997, Oliver et al. 1995). In Japan, the common wheat cultivars bred in Hokkaido (northern Japan), such as ‘Kitahonami’, have lower GCC than those bred in other regions (Kubo et al. 2008, 2011). Although food safety increases with the use of low-GCC Hokkaido cultivars, these cultivars have unfavorable agricultural characteristics (e.g., late maturity and susceptibility to preharvest sprouting) when they are grown in warm regions. Therefore, low-GCC cultivars that are adapted to warm regions must be developed, potentially from the Hokkaido cultivars (Kubo et al. 2008). Thus, the Western Region Agricultural Research Center (WARC) of the National Agriculture and Food Organization (NARO) developed the low-GCC cultivar ‘Biwahonami’ (‘Chugoku 165’) from ‘Chugoku 153’ × ‘Kitami 81’ (‘Kitahonami’), with continuous selection of the low-GCC phenotype following GCC measurement.
The selection of low-GCC phenotypes based on measuring the GCC is laborious and expensive. Marker-assisted selection is a useful tool for conventional cross breeding, because plants that have a target gene can be screened quickly by DNA markers closely linked to that gene (McCouch and Tanksley 1991). Nevertheless, few reports about genes and DNA markers linked to the low-GCC trait in common wheat are available. In rice, some genes associated with GCC have been identified and include the heavy metal P1B-type ATPase (HMA) family genes, which affect the translocation of Cd and therefore the GCC (Miyadate et al. 2011, Sasaki et al. 2014, Satoh-Nagasawa et al. 2012, Takahashi et al. 2012, Ueno et al. 2010, Yamaji et al. 2013). OsHMA2 is involved in the translocation of Cd from root to shoot (Satoh-Nagasawa et al. 2012, Yamaji et al. 2013) and overexpression can decrease the GCC (Takahashi et al. 2012). OsHMA3 transports Cd and sequesters it in vacuoles in root tissues, thereby limiting the amount available for translocation to grain (Miyadate et al. 2011, Ueno et al. 2010). Similar to OsHMA2, the overexpression of OsHMA3 reduces GCC (Sasaki et al. 2014, Ueno et al. 2010). In durum wheat, a major dominant gene controlling GCC was found on chromosome 5B and designated Cdu1 (Knox et al. 2009), with HMA3-B1 the likely candidate gene (Wiebe 2012). PCR-based DNA markers developed for low GCC have become a useful tool in the breeding of durum wheat. We expect that these genes and QTLs are also involved with GCC in common wheat.
Our objectives in this study were to identify the QTLs for GCC in common wheat and to determine whether they contained HMA family genes. Therefore, we used single nucleotide polymorphisms (SNPs) and HMA-derived markers to analyze QTLs for GCC in a doubled haploid (DH) population. To verify the effects of QTLs detected in the DH lines, we also conducted an association analysis with 43 cultivars.
Materials and Methods
Plant materials
We developed the mapping population used in this study (190 DH lines) from ‘Chugoku 165’ (a low-GCC parent) × ‘Chukei 10-22’ (a high-GCC parent). We used ‘Chugoku 165’, derived from ‘Chugoku 153’ × ‘Kitami 81’ (‘Kitahonami’, the source of the low-GCC trait), as the low-GCC parent because ‘Kitahonami’ does not grow successfully in the western region of Japan. Thus, we regarded the low-GCC genotype of ‘Chugoku 165’ as that of ‘Kitahonami’ in this study. The DH lines were developed by the wheat × maize method (Inagaki and Tahir 1990). The DH and parental lines were grown in 3 different fields and seasons: field A in 2013–14, field B in 2014–15, and field C in 2015–16. The 0.1 M HCl-extractable soil Cd concentrations were ~0.2 mg kg–1 in field A, ~1.9 mg kg–1 in field B, and ~2.1 mg kg–1 in field C. In 2013, the plots were 2 parallel 16-cm-spaced rows 30 cm in length with a 6-cm planting distance between seeds, without replication. In 2014 and 2015, the plots were single rows 23 cm in length with 2.3-cm between seeds, with 2 replications. Plants were sown in November 2013 and October 2014 and 2015 and harvested at the full maturity stage. To verify the effects of QTLs that were detected in the DH lines, we grew 43 cultivars that were bred in various regions of Japan (Table 1) in fields at the WARC for 3 growing seasons (2009–10, 2010–11, and 2011–12). All cultivars were sown in 6-m rows in 2009 and 2010 and in 3-m rows in 2011 in November and were harvested at the full maturity stage in June. All cultivation management followed the standard procedures used at the WARC.
Table 1.
Summary of cultivars of common wheat used in this study
Cultivar
name |
Originating regiona |
Allele typesb |
tarc2177
(QCdc.4B-kita) |
tarc2244
(QCdc.6B-kita1) |
tarc2248
(QCdc.6B-kita2) |
| Harukirari |
Hokkaido |
K |
K |
K |
| Harunoakebono |
Hokkaido |
K |
K |
K |
| Haruyokoi |
Hokkaido |
K |
K |
K |
| Haruyutaka |
Hokkaido |
K |
K |
K |
| Hokushin |
Hokkaido |
K |
A |
K |
| Kitahonami |
Hokkaido |
K |
K |
K |
| Kitamoe |
Hokkaido |
K |
K |
K |
| Kitanokaori |
Hokkaido |
K |
A |
K |
| Yumechikara |
Hokkaido |
K |
K |
K |
| Mochihime |
Tohoku |
K |
A |
K |
| Nanbukomugi |
Tohoku |
K |
K |
K |
| Nebarigoshi |
Tohoku |
K |
A |
A |
| Yukichikara |
Tohoku |
K |
A |
K |
| Aobanokoi |
Kanto |
K |
A |
K |
| Ayahikari |
Kanto |
A |
A |
A |
| Harunokagayaki |
Kanto |
A |
A |
A |
| Kinunonami |
Kanto |
K |
A |
A |
| Satonosora |
Kanto |
A |
A |
A |
| Tamaizumi |
Kanto |
K |
A |
A |
| Tsurupikari |
Kanto |
K |
A |
A |
| Uraramochi |
Kanto |
K |
A |
A |
| Gunma W8 |
Kanto |
K |
A |
A |
| Yumeshihou |
Kanto |
K |
A |
A |
| Hanamanten |
Chubu |
K |
A |
K |
| Kinuakari |
Chubu |
A |
A |
A |
| Kinuhime |
Chubu |
A |
A |
A |
| Shiranekomugi |
Chubu |
K |
A |
A |
| Yumeasahi |
Chubu |
K |
K |
K |
| Yumekaori |
Chubu |
K |
A |
K |
| Zenkoujikomugi |
Chubu |
K |
A |
K |
| Fukuharuka |
Chugoku |
A |
A |
A |
| Fukuhonoka |
Chugoku |
A |
A |
A |
| Fukusayaka |
Chugoku |
A |
A |
A |
| Chikugoizumi |
Kyushu |
K |
A |
A |
| Chikugomaru |
Kyushu |
A |
A |
A |
| Iwainodaichi |
Kyushu |
A |
A |
A |
| Kinuiroha |
Kyushu |
A |
A |
A |
| Minaminokaori |
Kyushu |
K |
A |
K |
| Nishihonami |
Kyushu |
K |
A |
A |
| Nishinokaori |
Kyushu |
K |
A |
K |
| Norin 61 |
Kyushu |
A |
A |
A |
| Shiroganekomugi |
Kyushu |
A |
A |
A |
| Towaizumi |
Kyushu |
K |
A |
K |
a Locations of regions of origin in Japan: Hokkaido, north; Tohoku, north; Kanto, central; Chubu, central; Chugoku, west; Kyushu, south.
b The alphabet indicate genotypes of each marker in each cultivar: K, ‘Kitahonami’ allele; A, another allele.
The phenotypic data for the DH lines and the 43 cultivars were recorded for 3 growing seasons. Analyses of GCC were conducted by the Overseas Merchandise Inspection Co., Ltd. (Tokyo, Japan; 2009, 2013, 2014, 2015 seasons), Nippon Total Science, Inc. (Hiroshima, Japan; 2010 season), and the Tohoku Ryokka Kankyohozen Co., Ltd. (Miyagi, Japan; 2011 season). In brief, grain was weighed in a beaker and heated to ~500°C until ash was obtained. The sample was digested completely with nitric acid on a hot plate and resuspended at a constant volume. The Cd concentration of the digested solution was measured in duplicate by ICP-MS or ICP-OES. All measurements were conducted with standard samples of known Cd concentration to guarantee accuracy.
Genotyping with SNP and Simple Sequence Repeat (SSR) markers in the DH lines
We used the potassium acetate method to extract the DNA (Dellaporta et al. 1983). For SNP genotyping, we tested 480 markers (Ishikawa et al. 2018) for polymorphisms. The genotyping with SNP markers was conducted by amplicon sequencing according to the methods of Ishikawa et al. (2018). The sequencing was performed on an Ion Torrent S5 sequencer with an Ion 530 Chip Kit (Thermo Fisher Scientific, Waltham, MA, USA). For SSR genotyping, we tested 23 markers (Somers et al. 2004) for polymorphisms. The microsatellites were amplified in a total volume of 10 μL containing 100 ng of genomic DNA; 200 μM each dNTP; 1.5 mM MgCl2; 0.05 μM forward primer and 0.2 μM reverse primer; 0.2 μM FAM-labeled M13(-21) primer; 0.5 U of ExTaq DNA polymerase (TaKaRa, Shiga, Japan); and ExTaq buffer (TaKaRa). To reduce the genotyping cost, we designed the sequence-specific forward primers with the M13(-21) universal sequence at their 5ʹ end, and added the FAM-labeled M13(-21) primer to label the PCR products, as described in Schuelke (2000). The amplification conditions were as follows: initial denaturation at 94°C for 1 min; 30 cycles of 98°C for 10 s, 51, 55, 60, 61, or 65°C for 30 s, and 72°C for 30 s; 8 cycles of 98°C for 10 s, 53°C for 30 s, and 72°C for 30 s; and a final extension of 10 min at 72°C. The PCR fragments were separated and detected using a Genetic Analyzer 3130xl DNA sequencer (Applied Biosystems, Foster City, CA, USA). We used GeneScan software (Applied Biosystems) and comparison with an internal DNA standard (Genescan-500 LIZ, Applied Biosystems) to determine the size of the amplified microsatellites.
Detection of polymorphism in HMA genomic regions
To identify polymorphisms in HMA2 and HMA3, we amplified and sequenced the genomic regions of HMAs retrieved from the GenBank/EMBL/DDBJ non-redundant sequence database. We designed the primers in Primer3Plus software (Untergasser et al. 2012). The accession numbers and resultant primers for each HMA sequence were as follows: HMA2-A1 (KF933095), Fw 5ʹ-GCCATCTCCACCGCCCAGATT-3ʹ, Rev 5ʹ-GCGATGAGCATGAGTATGTTGACGTCC-3ʹ; HMA2-B1 (KF933096), Fw 5ʹ-GAACAAGTGTACGGAGAGGGAGC-3ʹ, Rev 5ʹ-TCCTGCAACACCTGCGGAC-3ʹ; HMA2-D1 (KF933097), Fw 5ʹ-GAAGAGCCTGGCCACTCG-3ʹ, Rev 5ʹ-TCCTGCAACACCTGCGGAT-3ʹ; HMA3-A1 (KF683296), Fw 5ʹ-TGTTCATCTTCATCCGCCCGC-3ʹ, Rev 5ʹ-CCTTGCTACCTGTTTCACGGGGA-3ʹ; HMA3-B1 (KF683297), Fw 5ʹ-GCTGTTCATCCGCCTGCGTC-3ʹ, Rev 5ʹ-CCTTGCTACCTGTTTCACGGGGA-3ʹ; HMA3-D1 (KF683298), Fw 5ʹ-GCTGTTCATCCGCCTGCGTC-3ʹ, Rev 5ʹ-CTTCCGTGCTATCTGTTTCACGAGG-3ʹ. Primer specificity was confirmed by the amplification of Chinese Spring nulli-tetrasomic lines in which individual wheat chromosomes were replaced (nullisomic) by an extra pair (tetrasomic) of their homeologs (Sears 1954). All PCRs were performed in a total volume of 20 μL containing 200 ng of genomic DNA; 200 μM each dNTP; 1.5 mM MgCl2; 0.5 μM each primer; 0.5 U of LA Taq DNA polymerase (TaKaRa); and LA Taq Mg+-free buffer (TaKaRa). For HMA2s, the amplification conditions were as follows: initial denaturation at 94°C for 1 min; 35 cycles of 98°C for 10 s and 68°C for 8.5 min (HMA2-A1) or 7 min (HMA2-B1 and -D1); and a final extension of 10 min at 72°C. For HMA3s, the amplification conditions were as follows: initial denaturation at 94°C for 1 min; 35 cycles of 98°C for 10 s and 70°C for 3 min; and a final extension of 5 min at 72°C. The PCR products were electrophoresed and purified using a QIAquick Gel Extraction Kit (Qiagen, Hilden, Germany). To find polymorphisms, the PCR fragments were directly sequenced on a Genetic Analyzer 3130xl DNA sequencer (Applied Biosystems) with a BigDye Terminator v. 3.1 Cycle Sequencing Kit (Applied Biosystems). HMA2-A1, HMA2-B1, and HMA3-B1 in the DH lines were genotyped as above. The other HMAs were not genotyped because there was no polymorphism in the genomic region.
Genetic linkage map construction and QTL detection
We constructed a genetic linkage map in MapDisto 2.0 software (Heffelfinger et al. 2017). The map distances were calculated according to the Kosambi mapping function (Kosambi 1944). The QTL analysis was conducted on the genetic linkage maps in MapQTL 6.0 software (Van Ooijen 2009) by using simple interval mapping analysis (Lander and Botstein 1989). The phenotypic data from each year and the replications and the mean values of the 2 replications were analyzed separately. Logarithm of odds (LOD) thresholds corresponding to α = 0.05 were determined using 1000 permutations (Churchill and Doerge 1994). The positions at which the peak LOD score exceeded the threshold were used to estimate the QTL position and the 1-LOD support interval for the confidence interval for the putative QTL. We considered a QTL detected reproducibly in all phenotypic data to be stable. The QTL regions on the linkage maps were illustrated in MapChart 2.2 software (Voorrips 2002).
Genotyping with selected SNP markers in the 43 cultivars
The SNP markers within the 1-LOD interval were selected (see Table 3) and genotyped in the 43 cultivars (Table 1). To amplify the DNA region that included an SNP, primer information was obtained from the supplemental data of Ishikawa et al. (2018). PCR was conducted in a total volume of 20 μL containing 100 ng of genomic DNA; 200 μM each dNTP; 0.5 μM each primer; 0.5 U of Ex Taq HS DNA polymerase (TaKaRa); and Ex Taq buffer (TaKaRa). The amplification conditions were as follows: initial denaturation at 94°C for 1 min; 30 cycles of 98°C for 10 s, 60°C for 30 s, and 72°C for 1 min; and a final extension of 10 min at 72°C. The PCR products were electrophoresed and purified using a QIAquick Gel Extraction Kit (Qiagen). To genotype the SNPs, the PCR fragments were directly sequenced on a Genetic Analyzer 3130xl DNA sequencer (Applied Biosystems) with a BigDye Terminator v. 3.1 Cycle Sequencing Kit (Applied Biosystems).
Statistical analyses
We used R version 3.3.3 (R core team 2017) for all statistical analyses, except for mapping and QTL analysis. Multiple comparisons were implemented by ANOVA and Tukey’s honestly significant difference (HSD) test using the R built-in function ‘TukeyHSD’. The comparison of the means of 2 samples was conducted with a t-test using the R built-in function ‘t.test’. Because the sample size was small, the independence test was performed by Fisher’s exact test using the R built-in function ‘fisher.test’.
Results
Distribution of GCC in DH lines
The distributions of GCC in the DH lines in the 3 seasons are shown in Fig. 1. The GCC values of the parents differed notably from those of the DH lines in each season. The DH lines had a wide distribution and continuous variation in GCC, which is typical of quantitative traits. The GCC also varied across the seasons: In 2013, it ranged from 0.05 to 0.29 mg/kg, the lowest values among the seasons. In 2014, it ranged from 0.18 to 0.47 mg/kg. In 2015, it ranged from 0.41 to 1.18 mg/kg, the highest values among the seasons. The variation among years was due primarily to the use of different fields in the experiment, each with a different concentration of soil Cd (see Materials and Methods).
QTL analysis of GCC in the DH lines
We used 375 polymorphic markers (361 SNP markers, 11 SSR markers, HMA2-A1, HMA2-B1, and HMA3-B1) for construction of the genetic linkage map. No polymorphism was detected in the genomic regions of HMA2-D1, HMA3-A1, or HMA3-D1. The genetic linkage map contained 32 linkage groups covering 3178 cM in the DH population. As shown in Fig. 2, stable QTLs for GCC were found in 2 genomic regions: on chromosome (Chr.) 4B (QCdc.4B-kita) and on Chr. 6B (QCdc.6B-kita). The main features of these stable QTLs are listed in Table 2, and their LOD peaks and confidence intervals are shown in Fig. 2. Several other QTLs were also detected but not reproducibly, and they are not presented or discussed. QCdc.4B-kita was found on the short arm of Chr. 4B. Although the position of the QTL peak varied depending on the year, the QTL was always in the same region (37.0–51.3 cM) of Chr. 4B (Table 2). The LOD scores ranged from 4.06 to 10.55. QCdc.4B-kita explained 9.4%–25.4% of the total phenotypic variance, with a confidence interval of up to 17.0 cM (Table 2). QCdc.6B-kita was found on the long arm of Chr. 6B, with a peak LOD at 106.6–114.7 cM (Table 2). The position of the QTL peak was close to or coincided with the SNP marker tarc1156 or tarc2255 in most data. The LOD scores ranged from 3.26 to 8.07. QCdc.6B-kita explained 9.0%–17.8% of the total phenotypic variance, with a confidence interval of up to 16.4 cM. We did not detect a stable QTL on either Chr. 5 or Chr. 7, on which HMA3 and HMA2, respectively, are located. Because the QTL positions for GCC were completely different from those of heading date and grain protein concentration (data not shown), we assumed that GCC was not genetically related to those traits, at least in this population.

Table 2.
Summary of detected quantitative trait loci for grain cadmium concentration
| Year |
Chromosome |
LOD |
%
variance |
LOD peak
(cM) |
1-LOD interval
(cM) |
Nearest markera |
LOD
thresholdb |
Additive
effect |
| Name |
cM |
| 2013 |
4B |
4.17 |
9.6 |
51.3 |
44.8–54.5 |
tarc1059 |
51.3 |
3.1 |
–0.0090 |
|
6B |
5.00 |
11.4 |
114.7 |
110.2–117.2 |
tarc1156 |
114.7 |
|
–0.0098 |
| 2014-1 |
4B |
4.26 |
9.8 |
51.3 |
47.6–53.4 |
tarc1059 |
51.3 |
3.1 |
–0.0175 |
|
6B |
5.07 |
11.6 |
114.7 |
111.2–118.2 |
tarc1156 |
114.7 |
|
–0.0190 |
| 2014-2 |
4B |
4.06 |
9.4 |
51.3 |
49.6–53.4 |
tarc1059 |
51.3 |
3.1 |
–0.0239 |
|
6B |
7.04 |
15.7 |
106.6 |
106.6–114.7 |
tarc2243 |
106.6 |
|
–0.0309 |
| 2014-Average |
4B |
5.68 |
12.9 |
51.3 |
49.6–52.4 |
tarc1059 |
51.3 |
3.1 |
–0.0207 |
|
6B |
8.07 |
17.8 |
113.2 |
106.6–116.2 |
tarc1156 |
114.7 |
|
–0.0250 |
| 2015-1 |
4B |
10.11 |
25.4 |
50.2 |
40.0–51.3 |
tarc2185 |
50.2 |
3.0 |
–0.0608 |
|
6B |
3.26 |
9.0 |
114.7 |
103.8–120.2 |
tarc1156 |
114.7 |
|
–0.0362 |
| 2015-2 |
4B |
6.37 |
17.3 |
37.0 |
36.4–53.4 |
snp500 |
37.0 |
3.0 |
–0.0629 |
|
6B |
3.38 |
9.6 |
108.2 |
103.8–113.2 |
tarc2255 |
108.2 |
|
–0.0466 |
| 2015-Average |
4B |
10.55 |
22.7 |
39.0 |
36.4–52.4 |
tarc1020 |
41.9 |
3.1 |
–0.0605 |
|
6B |
4.67 |
10.8 |
110.2 |
103.8–116.2 |
tarc2255 |
108.2 |
|
–0.0420 |
a Marker closest to the position of the logarithm of odds (LOD) peak.
b LOD thresholds corresponding to the genome-wide significance level (α) of 0.05 using 1000 permutation cycles.
To confirm the effect of the QTLs in the DH lines, we analyzed the relationships between the phenotypic values and the genotypes of the markers closest to the QTLs. We selected the markers tarc1059 for QCdc.4B-kita and tarc1156 for QCdc.6B-kita. The lines with the ‘Chugoku 165’ genotype at either QTL had significantly lower GCC values than those with the ‘Chukei 10-22’ genotype (Fig. 3). Moreover, the lines with ‘Chugoku 165’ genotypes at both QTLs had significantly lower GCC values than those with the ‘Chugoku 165’ genotype at either QTL except in 2013 (Fig. 3). These results verified the effects of these QTLs in the DH lines.
Effects of QCdc.4B-kita and QCdc.6B-kita in the 43 cultivars
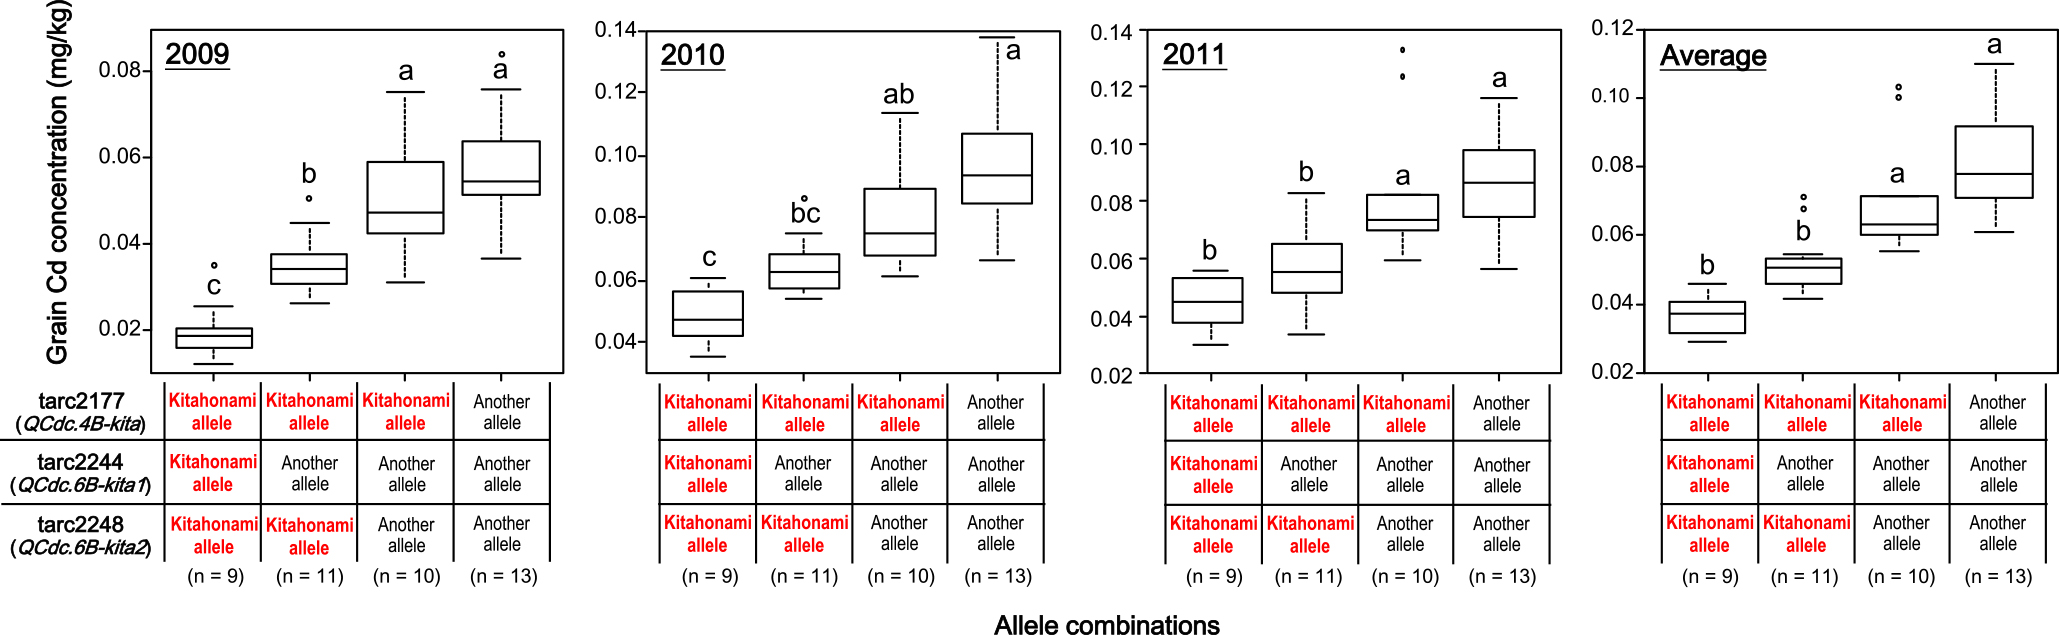
To assess the effects of QCdc.4B-kita and QCdc.6B-kita in different genetic backgrounds, we used 43 cultivars (Table 1) with different GCCs. First, we identified loci with segregation distortion within the 1-LOD confidence interval by using 8 low-GCC and 8 high-GCC cultivars. We found 3 such loci by Fisher’s exact test (Table 3). In QCdc.4B-kita, one locus, tarc2177, was detected with P = 0.0070. In QCdc.6B-kita, 2 loci, tarc2244 (QCdc.6B-kita1) and tarc2248 (QCdc.6B-kita2), were detected with P = 0.0002 (Table 3). Next, we genotyped tarc2177, tarc2244 and tarc2248 using the 43 cultivars (Table 1), and analyzed the relationships between the phenotypic values and the genotypes of the markers. We considered low-GCC genotypes as having the ‘Kitahonami’ allele and high-GCC genotypes as having a different allele. The cultivars with the ‘Kitahonami’ allele at QCdc.4B-kita, QCdc.6B-kita1, or QCdc.6B-kita2 had significantly lower GCC values than those with another allele in all tested years (Fig. 4). Moreover, in all tested years, the cultivars with the ‘Kitahonami’ allele at all QTLs had significantly lower GCC values than those with another allele at all QTLs (Fig. 5). In addition, the GCC of the cultivars with 2 ‘Kitahonami’ alleles at the QTLs tended to be lower; and the cultivars with the ‘Kitahonami’ allele at 2 QTLs had significantly lower GCC values than those with the ‘Kitahonami’ allele at one QTL in 2009 and 2011 and in the average data (Fig. 5).
Table 3.
Genotypes of single nucleotide polymorphism markers located within 1 logarithm of odds confidence interval in cultivars with low and high grain Cd concentration (GCC)
| Marker name |
Genetic
distance
(cM)a |
Physical
distance
(Mb)b |
Kitahonami |
Low GCC |
|
High GCC |
p-valuec |
| Haruyutaka |
Harukirari |
Kitamoe |
Harunoakebono |
Yumeasahi |
Yumechikara |
Haruyokoi |
Nanbukomugi |
Ayahikari |
Kinuakari |
Chikugomaru |
Fukusayaka |
Kinuiroha |
Yumeshihou |
Nishihonami |
Shiroganekomugi |
| 4B |
|
|
|
|
|
|
|
|
|
|
|
|
|
|
|
|
|
|
|
|
|
| snp500 |
37.0 |
29.0 |
■d |
□ |
□ |
■ |
□ |
■ |
□ |
□ |
■ |
|
□ |
□ |
□ |
□ |
□ |
□ |
□ |
□ |
0.2000 |
| tarc2181 |
43.8 |
34.0 |
■ |
□ |
■ |
■ |
■ |
□ |
□ |
■ |
■ |
|
□ |
□ |
□ |
□ |
□ |
□ |
□ |
□ |
0.0256 |
| tarc1002 |
45.9 |
40.2 |
■ |
□ |
□ |
■ |
□ |
■ |
■ |
□ |
■ |
|
□ |
□ |
□ |
□ |
□ |
□ |
□ |
□ |
0.0769 |
| tarc2177 |
47.6 |
47.0 |
■ |
■ |
■ |
■ |
■ |
■ |
■ |
■ |
■ |
|
□ |
□ |
□ |
□ |
□ |
■ |
■ |
□ |
0.0070 |
| tarc2173 |
47.6 |
47.6 |
■ |
□ |
□ |
■ |
□ |
■ |
■ |
□ |
■ |
|
□ |
□ |
□ |
□ |
□ |
■ |
■ |
□ |
0.6084 |
| tarc1064 |
48.6 |
71.6 |
■ |
□ |
□ |
■ |
□ |
■ |
■ |
□ |
■ |
|
□ |
□ |
□ |
□ |
□ |
■ |
□ |
□ |
0.2821 |
| tarc1059 |
51.3 |
171.1 |
■ |
□ |
□ |
□ |
□ |
□ |
□ |
□ |
□ |
|
□ |
□ |
□ |
□ |
□ |
□ |
□ |
□ |
1.0000 |
| tarc2162 |
51.3 |
351.9 |
■ |
□ |
□ |
■ |
□ |
■ |
■ |
□ |
■ |
|
□ |
■ |
□ |
□ |
□ |
■ |
■ |
□ |
1.0000 |
| snp58 |
52.4 |
423.1 |
■ |
□ |
□ |
□ |
□ |
□ |
□ |
□ |
□ |
|
□ |
□ |
□ |
□ |
□ |
□ |
□ |
□ |
1.0000 |
| 6B |
|
|
|
|
|
|
|
|
|
|
|
|
|
|
|
|
|
|
|
|
|
| tarc2260 |
102.8 |
415.9 |
■ |
□ |
■ |
■ |
■ |
■ |
□ |
□ |
■ |
|
□ |
□ |
□ |
□ |
□ |
□ |
□ |
□ |
0.0256 |
| tarc2244 |
103.9 |
447.1 |
■ |
■ |
■ |
■ |
■ |
■ |
■ |
■ |
■ |
|
□ |
□ |
□ |
□ |
□ |
□ |
□ |
□ |
0.0002 |
| tarc2256 |
104.4 |
459.8 |
■ |
□ |
□ |
■ |
□ |
□ |
□ |
□ |
■ |
|
□ |
□ |
□ |
□ |
□ |
□ |
□ |
□ |
0.4667 |
| tarc2272 |
106.6 |
489.8 |
■ |
□ |
■ |
■ |
■ |
■ |
■ |
□ |
□ |
|
□ |
□ |
□ |
□ |
□ |
□ |
□ |
□ |
0.0256 |
| tarc2255 |
108.2 |
552.2 |
■ |
■ |
■ |
■ |
■ |
■ |
□ |
■ |
■ |
|
■ |
■ |
■ |
■ |
■ |
■ |
■ |
■ |
1.0000 |
| tarc1156 |
114.7 |
606.4 |
■ |
□ |
■ |
■ |
■ |
□ |
□ |
□ |
□ |
|
□ |
□ |
□ |
□ |
□ |
□ |
□ |
□ |
0.2000 |
| snp221 |
114.7 |
614.1 |
■ |
□ |
□ |
■ |
□ |
■ |
■ |
□ |
■ |
|
□ |
□ |
□ |
□ |
□ |
□ |
□ |
□ |
0.0769 |
| tarc2248 |
115.2 |
632.8 |
■ |
■ |
■ |
■ |
■ |
■ |
■ |
■ |
■ |
|
□ |
□ |
□ |
□ |
□ |
□ |
□ |
□ |
0.0002 |
| tarc2240 |
652.6 |
652.6 |
■ |
■ |
■ |
■ |
■ |
□ |
□ |
■ |
□ |
|
□ |
□ |
□ |
□ |
□ |
□ |
□ |
□ |
0.0256 |
| Cd concentration (mg/kg)e |
0.029 |
0.030 |
0.032 |
0.037 |
0.037 |
0.040 |
0.041 |
0.045 |
0.046 |
|
0.079 |
0.080 |
0.092 |
0.096 |
0.098 |
0.100 |
0.103 |
0.110 |
|
a Genetic distances were retrieved from the genetic map of the DH population (‘Chugoku 165’ × ‘Chukei 10-22’).
b Physical distances were calculated on the basis of the IWGSC RefSeq v. 1.0 (https://wheat-urgi.versailles.inra.fr/Seq-Repository/Assemblies).
c P-values were calculated by Fisher’s exact test.
d The squares indicate genotypes of each marker in each cultivar: black, ‘Kitahonami’ allele; white, another allele.
e The data averaged over 3 years are presented.

Discussion
In this study, we successfully found one QTL for low GCC on the short arm of Chr. 4B (QCdc.4B-kita) and one QTL for low GCC on the long arm of Chr. 6B (QCdc.6B-kita) using DH population. QCdc.4B-kita explained 9.4%–25.4% and QCdc.6B-kita explained 9.0%–17.8% of the total phenotypic variance, showing nearly equivalent effects. We used 43 cultivars to further identify QCdc.6B-kita as two loci (QCdc.6B-kita1 and QCdc.6B-kita2). Because the positions of these 2 loci were relatively close, their distinction may have been due to linkage disequilibrium (Table 3). However, recombination occurred between them in 11 cultivars (Table 1, Fig. 5). Therefore, we concluded that QCdc.6B-kita1 and QCdc.6B-kita2 were 2 different loci. Because these 3 QTLs were detected in all data sets in different growing seasons, soil conditions, and cultivars, they are reliable and can be used in breeding programs.
There are some previous studies about QTLs associated with Cd accumulation in grain and roots of wheat and barley. A major locus for low GCC of durum wheat (Cdu1-B) was found on Chr. 5BL by QTL mapping (Knox et al. 2009, Penner et al. 1995). A minor QTL for low GCC was also found on 5BL, close to Cdu1-B (Wiebe et al. 2010). In common wheat, Ci et al. (2012) found 2 QTLs for Cd accumulation in roots on Chrs. 4A and 5D by QTL mapping, and Guttieri et al. (2015) identified GCC-associated SNPs on Chr. 5AL in a region homeologous to the Cdu1 locus by using genome-wide association scans. Recently, Oladzad-Abbasabadi et al. (2018) reported that a novel locus for Cd uptake in grain (Cdu2-B), which was transferred from common wheat into the durum wheat background, is close to Cdu1-B on Chr. 5BL. In barley, Wu et al. (2015) detected 2 major QTLs for GCC on Chrs. 2H and 5H by using genome-wide association mapping. In contrast, the QTLs we found here are on Chrs. 4B and 6B, in positions that are completely different from the QTLs detected previously. Thus, we consider QCdc.4B-kita, QCdc.6B-kita1, and QCdc.6B-kita2 to be novel loci for low GCC on Chrs. 4B and 6B in common wheat.
Root-to-shoot translocation of Cd is an important physiological process that affects GCC. In rice, genes of the heavy metal P1B-type ATPase (HMA) family affect the translocation of Cd from root to shoot and thus GCC; OsHMA2 affects Cd loading into the xylem and OsHMA3 affects Cd sequestration in vacuoles in root tissues (Miyadate et al. 2011, Sasaki et al. 2014, Satoh-Nagasawa et al. 2012, Takahashi et al. 2012, Ueno et al. 2010, Yamaji et al. 2013). In durum wheat, TdHMA3-B1, which is located within a 0.14 cM interval on Chr. 5BL where Cdu1-B was mapped, is the best candidate gene associated with root-to-shoot translocation (Wiebe 2012). In barley, HvHMA3 is close to the major QTL for GCC on Chr. 5H (Wu et al. 2015). In common wheat, Kubo et al. (2011) found that low-GCC cultivars including ‘Kitahonami’, the parental cultivar of ‘Chugoku 165’, had lower shoot/root ratios of Cd than high-GCC cultivars had. With consideration of these studies, we hypothesized that HMA family genes (i.e., HMA2 and HMA3) regulate GCC in common wheat. However, we did not detected any QTLs on the chromosomes with HMA3 (Chr. 5) and HMA2 (Chr. 7) (Table 2). Moreover, the near-isogenic lines carrying Cdu1-B that was introduced by the use of DNA markers in the common wheat background did not always have low GCC (data not shown). Guttieri et al. (2015) indicated that the position of HMA3 is distant from GCC-associated SNPs on Chr. 5AL in common wheat. Therefore, compared with regulation in durum wheat and barley, other genes might regulate the GCC in common wheat.
The publicly available genomic sequence of ‘Chinese Spring’ (IWGSC 2018) can be used to identify positional candidate genes underlying QTLs near SNP markers. We tried to identify positional and functional candidate genes underlying QCdc.4B-kita (between tarc1002 and tarc2173), QCdc.6B-kita1 (between tarc2260 and tarc2256), and QCdc.6B-kita2 (between snp221 and tarc2240). We searched for possible candidate genes (e.g., genes associated with metal transporters or regulatory factors) in these regions in the public database (IWGSC RefSeq v. 1.0; https://wheat-urgi.versailles.inra.fr). The QCdc.4B-kita region contained 61 putative genes (Supplemental Table 1), the QCdc.6B-kita1 region 168 (Supplemental Table 2), and the QCdc.6B-kita2 region 238 (Supplemental Table 3). Among the genes, we found those of the pleiotropic drug resistance (PDR) belonging to the ATP-binding cassette (ABC) transporter G family in the QCdc.4B-kita region and those of plant metal tolerance protein (MTP) and plant cadmium resistance 2 (PCR2) in the QCdc.6B-kita2 region. However, we found no candidate genes in the QCdc.6B-kita1 region. Plant PDR transporters can transport heavy metals including Cd, secondary metabolites, and plant hormones (Lefèvre and Boutry 2018). At the plasma membrane of Arabidopsis cells, AtPDR8 functions as an efflux pump of Cd2+ and decreases Cd concentration more in shoots than in roots (Kim et al. 2007). MTP is a transporter that mediates heavy metal movement through membranes (Williams et al. 2000). Yuan et al. (2012) report that OsMTP1 is necessary for the translocation of Zn, Cd, and other heavy metals, and when downregulated can affect Cd accumulation in different rice organs. PCR proteins are involved in the efflux of heavy metals (Song et al. 2004), and Song et al. (2010) reported that AtPCR2 affects Cd concentration in roots, although they characterized it as a Zn exporter. The expression of all three genes (for PDR, MTP, and PCR) alters Cd concentration in plants and affects Cd shoot/root ratios (Kim et al. 2007, Song et al. 2010, Yuan et al. 2012). In common wheat, a high-Cd cultivar has a high shoot/root Cd ratio, whereas a low-Cd cultivar has a low ratio (Kubo et al. 2011). Thus, these three genes can be considered as possible candidate genes underlying QCdc.4B-kita and QCdc.6B-kita2, although we cannot exclude novel genes other than known transporter genes. In further genomic and molecular studies, we will identify the genes underlying QCdc.4B-kita, QCdc.6B-kita1, and QCdc.6B-kita2.
Collectively, our results indicate that (1) QCdc.4B-kita, QCdc.6B-kita1, and QCdc.6B-kita2 are novel loci for low GCC in common wheat, and (2) in contrast to durum wheat, HMA3 on Chr. 5 might not be involved in GCC in common wheat. We anticipate that QCdc.4B-kita and QCdc.6B-kita will improve the efficiency of selection for low-GCC traits in common wheat breeding programs.
Author Contribution Statement
MY designed the study, and YB and MY wrote the initial draft of the manuscript. MY, KT, NI, YB and KK conducted field trials. MY and NI contributed grain Cd data collection and MM contributed soil Cd data collection. YB, GI, HU and MY contributed to genotypic data collection. YB, MY, GI, KK, KT and HH contributed data analysis and interpretation of data. All authors reviewed and approved the manuscript.
Acknowledgments
The authors are grateful to the members of the Wheat and Barley Breeding Unit (Institute of Crop Science, NARO) for the development of the DH population. They are also grateful to Dr. H. Funatsuki (NICS, NARO) for his valuable suggestions. This study was partially supported by a grant from the Japanese Ministry of Agriculture, Forestry and Fisheries (Research project for ensuring food safety from farm to table, 1331-3). The Advanced Genomics Breeding Section of the Institute of Crop Science, NARO (Project ID: 17-1-04), supported the amplicon sequencing analysis.
Literature Cited
- Churchill, G.A. and R.W. Doerge (1994) Empirical threshold values for quantitative trait mapping. Genetics 138: 963–971.
- Ci, D., D. Jiang, S. Li, B. Wollenweber, T. Dai and W. Cao (2012) Identification of quantitative trait loci for cadmium tolerance and accumulation in wheat. Acta Physiol. Plant. 34: 191–202.
- Codex Alimentarius Commission (2005a) Report of the 37th session of the Codex committee on food additives and contaminants. The Hague, The Netherlands, 25–29 April 2005. ALINORM 05/28/12. WHO/FAO. Rome. 184.
- Codex Alimentarius Commission (2005b) Report of the twenty-eighth session. Rome, 4–9 July 2005. ALINORM 05/28/41. WHO/FAO. Rome. 115.
- Dellaporta, S.L., J. Wood and J.B. Hicks (1983) A plant DNA minipreparation: version II. Plant Mol. Biol. Rep. 1: 19–21.
- Grant, C.A., W.T. Buckley, L.D. Bailey and F. Selles (1998) Cadmium accumulation in crops. Can. J. Plant Sci. 78: 1–17.
- Greger, M. and M. Löfstedt (2004) Comparison of uptake and distribution of cadmium in different cultivars of bread and durum wheat. Crop Sci. 44: 501–507.
- Guttieri, M.J., P.S. Baenziger, K. Frels, B. Carver, B. Arnall, S. Wang, E. Akhunov and B.M. Waters (2015) Prospects for selecting wheat with increased zinc and decreased cadmium concentration in grain. Crop Sci. 55: 1712–1728.
- Heffelfinger, C., C.A. Fragoso and M. Lorieux (2017) Constructing linkage maps in the genomics era with MapDisto 2.0. Bioinformatics 33: 2224–2225.
- Inagaki, M. and M. Tahir (1990) Comparison of haploid production frequencies in wheat varieties crossed with Hordeum bulbosum L. and maize. Japan. J. Breed. 40: 209–216.
- International Wheat Genome Sequencing Consortium (IWGSC) (2018) Shifting the limits in wheat research and breeding using a fully annotated reference genome. Science 361: eaar7191.
- Ishikawa, G., M. Saito, T. Tanaka, Y. Katayose, H. Kanamori, K. Kurita and T. Nakamura (2018) An efficient approach for the development of genome-specific markers in allohexaploid wheat (Triticum aestivum L.) and its application in the construction of high-density linkage maps of the D genome. DNA Res. 25: 317–326.
- Ishikawa, N., G. Ishioka, M. Yanaka, K. Takata and M. Murakami (2015) Effects of ammonium chloride fertilizer and its application stage on cadmium concentrations in wheat (Triticum aestivum L.) grain. Plant Prod. Sci. 18: 137–145.
- Järup, L. and A. Åkesson (2009) Current status of cadmium as an environmental health problem. Toxicol. Appl. Pharmacol. 238: 201–208.
- Kim, D.Y., L. Bovet, M. Maeshima, E. Martinoia and Y. Lee (2007) The ABC transporter AtPDR8 is a cadmium extrusion pump conferring heavy metal resistance. Plant J. 50: 207–218.
- Knox, R.E., C.J. Pozniak, F.R. Clarke, J.M. Clarke, S. Houshmand and A.K. Singh (2009) Chromosomal location of the cadmium uptake gene (Cdu1) in durum wheat. Genome 52: 741–747.
- Kosambi, D.D. (1944) The estimation of map distances from recombination values. Ann. Eugen. 12: 172–175.
- Kubo, K., Y. Watanabe, A. Oyanagi, S. Kaneko, M. Chono, H. Matsunaka, M. Seki and M. Fujita (2008) Cadmium concentration in grains of Japanese wheat cultivars: genotypic difference and relationship with agronomic characteristics. Plant Prod. Sci. 11: 243–249.
- Kubo, K., Y. Watanabe, H. Matsunaka, M. Seki, M. Fujita, N. Kawada, K. Hatta and T. Nakajima (2011) Differences in cadmium accumulation and root morphology in seedlings of Japanese wheat varieties with distinctive grain cadmium concentration. Plant Prod. Sci. 14: 148–155.
- Lander, E.S. and D. Botstein (1989) Mapping Mendelian factors underlying quantitative traits using RFLP linkage maps. Genetics 121: 185–199.
- Lefèvre, F. and M. Boutry (2018) Towards identification of the substrates of ATP-binding cassette transporters. Plant Physiol. 178: 18–39.
- Li, Y.M., L.C. Rufus, A.A. Schneiter, J.F. Miller, E.M. Elias and J.J. Hammond (1997) Screening for low grain cadmium phenotypes in sunflower, durum wheat and flax. Euphytica 94: 23–30.
- McCouch, S.R. and S.D. Tanksley (1991) Development and use of restriction fragment length polymorphism in rice breeding and genetics. In: Toenniessen, G. and G. Khush (eds.) Rice Biotechnology, CAB International, Tucson, pp. 109–133.
- Miyadate, H., S. Adachi, A. Hiraizumi, K. Tezuka, N. Nakazawa, T. Kawamoto, K. Katou, I. Kodama, K. Sakurai, H. Takahashi et al. (2011) OsHMA3, a P 1B-type of ATPase affects root-to-shoot cadmium translocation in rice by mediating efflux into vacuoles. New Phytol. 189: 190–199.
- Nishijo, M., Y. Morikawa, H. Nakagawa, K. Tawara, K. Miura, T. Kido, A. Ikawa, E. Kobayashi and K. Nogawa (2006) Causes of death and renal tubular dysfunction in residents exposed to cadmium in the environment. Occup. Environ. Med. 63: 545–550.
- Oladzad-Abbasabadi, A., A. Kumar, S. Pirseyedi, E. Salsman, M. Dobrydina, R.S. Poudel, W.A. AbuHammad, S. Chao, J.D. Faris and E.M. Elias (2018) Identification and validation of a new source of low grain cadmium accumulation in durum wheat. G3 (Bethesda) 8: 923–932.
- Oliver, D.P., J.W. Gartrell, K.G. Tiller, R. Correll, G.D. Cozens and B.L. Youngberg (1995) Differential responses of Australian wheat cultivars to cadmium concentration in wheat grain. Aust. J. Agric. Res. 46: 873–886.
- Olsson, I.M., J. Eriksson, I. Oborn, S. Skerfving and A. Oskarsson (2005) Cadmium in food production systems: a health risk for sensitive population groups. Ambio 34: 344–351.
- Penner, G.A., L.J. Bezte, D. Leisle and J. Clarke (1995) Identification of RAPD markers linked to a gene governing cadmium uptake in durum wheat. Genome 38: 543–547.
- R Core Team (2017) R: a language and environment for statistical computing. Vienna, Austria R Foundation for Statistical Computing.
- Saifullah, N. Sarwar, S. Bibi, M. Ahmad and Y.S. Ok (2014) Effectiveness of zinc application to minimize cadmium toxicity and accumulation in wheat (Triticum aestivum L.). Environ. Earth Sci. 71: 1663–1672.
- Sasaki, A., N. Yamaji and J.F. Ma (2014) Overexpression of OsHMA3 enhances Cd tolerance and expression of Zn transporter genes in rice. J. Exp. Bot. 65: 6013–6021.
- Satoh-Nagasawa, N., M. Mori, N. Nakazawa, T. Kawamoto, Y. Nagato, K. Sakurai, H. Takahashi, A. Watanabe and H. Akagi (2012) Mutations in rice (Oryza sativa) heavy metal ATPase 2 (OsHMA2) restrict the translocation of zinc and cadmium. Plant Cell Physiol. 53: 213–224.
- Schuelke, M. (2000) An economic method for the fluorescent labeling of PCR fragments. Nat. Biotechnol. 18: 233–234.
- Sears, E.R. (1954) The aneuploids of common wheat. Research Bulletin No. 572, Agricultural Experiment Station, University of Missouri, Columbia, pp. 1–58.
- Somers, D.J., P. Isaac and K. Edwards (2004) A high-density microsatellite consensus map for bread wheat (Triticum aestivum L.). Theor. Appl. Genet. 109: 1105–1114.
- Song, W.Y., E. Martinoia, J. Lee, D. Kim, D.Y. Kim, E. Vogt, D. Shim, K.S. Choi, I. Hwang and Y. Lee (2004) A novel family of Cys-rich membrane proteins mediates cadmium resistance in Arabidopsis. Plant Physiol. 135: 1027–1039.
- Song, W.Y., K.S. Choi, D.Y. Kim, M. Geisler, J. Park, V. Vincenzetti, M. Schellenberg, S.H. Kim, Y.P. Lim, E.W. Noh et al. (2010) Arabidopsis PCR2 is a zinc exporter involved in both zinc extrusion and long-distance zinc transport. Plant Cell 22: 2237–2252.
- Takahashi, R., Y. Ishimaru, H. Shimo, Y. Ogo, T. Senoura, N.K. Nishizawa and H. Nakanishi (2012) The OsHMA2 transporter is involved in root-to-shoot translocation of Zn and Cd in rice. Plant Cell Environ. 35: 1948–1957.
- Ueno, D., N. Yamaji, I. Kono, C.F. Huang, T. Ando, M. Yano and J.F. Ma (2010) Gene limiting cadmium accumulation in rice. Proc. Natl. Acad. Sci. USA 107: 16500–16505.
- Untergasser, A., I. Cutcutache, T. Koressaar, J. Ye, B.C. Faircloth, M. Remm and S.G. Rozen (2012) Primer3—new capabilities and interfaces. Nucleic Acids Res. 40: e115.
- Van Ooijen, J.W. (2009) MapQTL® 6, Software for the mapping of quantitative trait loci in experimental populations of diploid species. Kyazma B.V. Wageningen, Netherlands.
- Voorrips, R.E. (2002) MapChart: software for the graphical presentation of linkage maps and QTLs. J. Hered. 93: 77–78.
- Wiebe, K., N.S. Harris, J.D. Faris, J.M. Clarke, R.E. Knox, G.J. Taylor and C.J. Pozniak (2010) Targeted mapping of Cdu1, a major locus regulating grain cadmium concentration in durum wheat (Triticum turgidum L. var. durum). Theor. Appl. Genet. 121: 1047–1058.
- Wiebe, K. (2012) Molecular characterization of Cdu-b1, a major locus controlling cadmium accumulation in durum wheat (Triticum turgidum L. var. durum) grain. PhD. Dissertation, University of Saskatchewan, Saskatoon.
- Williams, L.E., J.K. Pittman and J.L. Hall (2000) Emerging mechanisms for heavy metal transport in plants. Biochim. Biophys. Acta 1465: 104–126.
- Wu, D., K. Sato and J.F. Ma (2015) Genome-wide association mapping of cadmium accumulation in different organs of barley. New Phytol. 208: 817–829.
- Yamaji, N., J. Xia, N. Mitani-Ueno, K. Yokosho and J.F. Ma (2013) Preferential delivery of zinc to developing tissues in rice is mediated by P-type heavy metal ATPase OsHMA2. Plant Physiol. 162: 927–939.
- Yuan, L., S. Yang, B. Liu, M. Zhang and K. Wu (2012) Molecular characterization of a rice metal tolerance protein, OsMTP1. Plant Cell Rep. 31: 67–79.