Abstract
Fruit shape of cultivated strawberry (Fragaria × ananassa Duch.) is an important breeding target. To detect genomic regions associated with this trait, its quantitative evaluation is needed. Previously we created a multi-parent advanced-generation inter-cross (MAGIC) strawberry population derived from six founder parents. In this study, we used this population to quantify fruit shape. Elliptic Fourier descriptors (EFDs) were generated from 2 969 two-dimensional binarized fruit images, and principal component (PC) scores were calculated on the basis of the EFD coefficients. PC1–PC3 explained 96% of variation in shape and thus adequately quantified it. In genome-wide association study, the PC scores were used as phenotypes. Genome wide association study using mixed linear models revealed 2 quantitative trait loci (QTLs) for fruit shape. Our results provide a novel and effective method to analyze strawberry fruit morphology; the detected QTLs and presented method can support marker-assisted selection in practical breeding programs to improve fruit shape.
Introduction
Cultivated strawberry (Fragaria × ananassa Duch.) is a commercially important fruit around the world, and is very popular in Japan. Strawberry production has increased worldwide, and the value of strawberry production is only exceeded by tomato production among Japan’s horticultural crops. Many breeders have focused on and improved the agronomic traits of cultivated strawberry, such as yield, resistance to diseases, skin color, and firmness. A number of quantitative trait loci (QTL) for these quantifiable traits have been reported recently (Lerceteau-Köhler et al. 2012, Zorrilla-Fontanesi et al. 2011). However, several agronomic traits are difficult to quantify, including fruit shape.
Although the shape of strawberry fruits is affected by environmental conditions, such as temperature, nutrient levels, and soil moisture content, it is also controlled by genetic factors, because fruit shape differs widely among commercial varieties. For example, ‘Tochiotome’ (Ishihara et al. 1996) has typical conical fruits, but ‘Red Pearl’ (Nishida 2002) has egg-shaped fruits and ‘Harunoka’ (Honda et al. 1974) has wedged fruits. The fruit shape is an essential characteristic for registration of varieties, and strawberry breeders are required to classify a new variety into one of the nine designated categories during registration of the variety (Plant Variety Protection Office at Ministry of Agriculture, Forestry and Fisheries, Japan 2011; Supplemental Fig. 1). Indeed, the three abovementioned cultivars are described as conical, ovoid, and wedged, respectively in variety registration. However, fruit shape is usually judged visually. Although some quantitative measures can be used to evaluate some aspects of fruit shape, such as the weight, length, and width of the fruit, there are no quantitative measures that can define the full range of variation of fruit shape. This makes it impossible to consistently analyze the genetic regions that control fruit shape. Therefore, establishment of a quantitative method for shape evaluation is needed to support genetic analysis that focuses on modifying strawberry fruit shape.
One promising method to describe fruit shape is based on elliptic Fourier descriptors (EFDs). EFDs, which were proposed by Kuhl and Giardina (1982), can delineate any type of shape with a closed two-dimensional contour, and have been effectively applied to evaluate various biological shapes in animals (Bierbaum and Ferson 1986, Diaz et al. 1989, Ferson et al. 1985, Rohlf and Archie 1984) and plants (Furuta et al. 1995, Iwata et al. 1998, McLellan 1993, Ohsawa et al. 1998, White et al. 1988). Furthermore, the SHAPE software developed by Iwata and Ukai (2002) has made EFDs a more familiar and powerful tool for quantitative analysis of biological morphology. Many reports have shown that measurements based on EFDs can support quantification of the shapes of plant and animal organs using SHAPE. For instance, Iwata et al. (2002) conducted a diallel analysis of the shape of citrus leaves based on EFDs. However, there have been few analyses of the morphology of edible fruits; we found two studies for fruit shape of Tarocco sweet orange (Citrus × sinensis, Costa et al. 2009) and cucumber (Cucumis sativus, Shimomura et al. 2017).
To detect genetic regions associated with strawberry fruit shape, it’s necessary to accumulate sufficient genome information and to develop DNA markers. Studies of the strawberry genome have been reported recently. Diploid and octoploid strawberry genome sequences were reported by Shulaev et al. (2011) and Hirakawa et al. (2014), respectively. A high-density simple sequence repeat (SSR) marker linkage map in cultivated strawberry was constructed by Isobe et al. (2013). Using these SSR markers, Wada et al. (2017) developed a multi-parent advanced-generation inter-cross (MAGIC) population derived from six founder parents.
The objectives of the present study were (1) to establish a quantitative method for evaluation of strawberry fruit shape and (2) to detect QTLs affecting fruit morphology by genome-wide association study (GWAS).
Materials and Methods
Plant materials
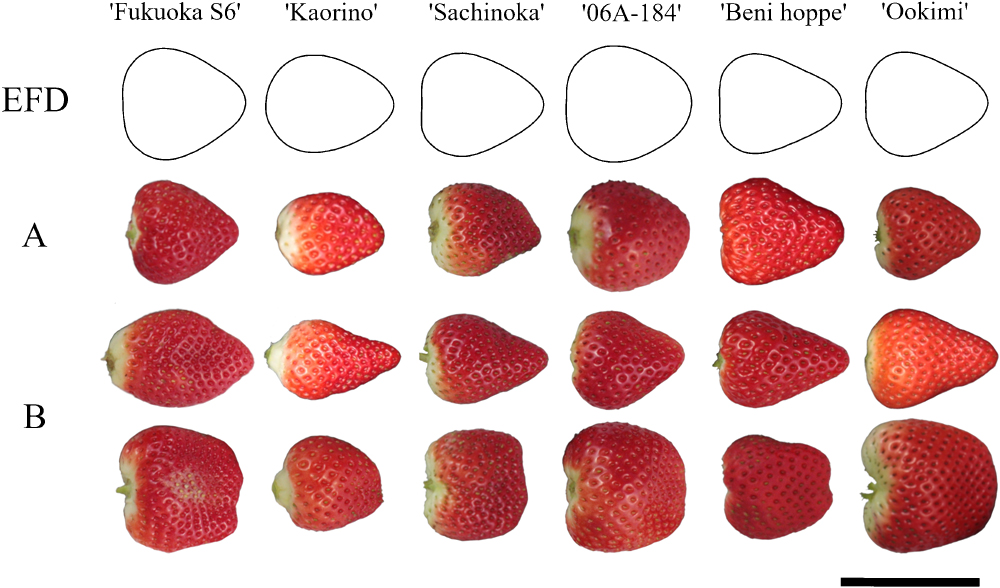
The strawberry MAGIC population was derived from six founder parents: ‘Fukuoka S6’ (trade name ‘Amaou’; Mitsui et al. 2003), ‘Kaorino’ (Kitamura et al. 2015), ‘Sachinoka’ (Morishita et al. 1997), ‘06A-184’ (‘Fukuoka S6’ × ‘Sanchiigo’; Mori et al. 2000), ‘Beni Hoppe’ (Takeuchi et al. 1999), and ‘Ookimi’ (Okimura 2010). Selection of founder parents was based on the genetic dissimilarity analysis of Isobe et al. (2013) and on the wide variations in numerous major agronomic traits of these accessions (Wada et al. 2017). Typical and atypical fruits of the six founder cultivars are shown in Fig. 1. The fruit shape of ‘Fukuoka S6’ is like a large spherical cone, ‘Kaorino’ is like a spherical cone, ‘Sachinoka’ is like a thick cone, ‘06A-184’ is like a sphere, ‘Beni Hoppe’ is like a thin cone, and ‘Ookimi’ is like a large short cone.
In the present study, we used the inter-cross second generation (314 lines in total) of the MAGIC population as experimental materials. The clone of MAGIC population and founder parents, were grown over three consecutive years, from 2014 to 2016; 312, 256, and 245 lines of MAGIC population were grown in 2014, 2015, and 2016, respectively. Details of the plants, fertilizer, and pest management were also described previously (Wada et al. 2017). Fruits that enlarged normally were harvested at maturity, but fruits with abnormal shape, which were induced by infertility or pest infection, were not used in the following analysis. For the subsequent image analysis, we selected representative examples from the second to fifth fruits of the apical flower cluster from each plant for the shape evaluation. Finally, we obtained 2 969 fruits of MAGIC population and founder parents; 1 400, 792, 777 fruits in 2014, 2015, and 2016, respectively.
Image capture and phenotype evaluation
We obtained images of the strawberry fruits with an EOS 40D digital camera (Canon Inc., Tokyo, Japan). After removing the calyx, we arranged the harvested fruits with the most colored side facing up on a black tray, and captured images under diffuse artificial lighting with a ColorChecker Passport color calibration target (X-Rite Inc., Grand Rapids, MI, USA) (Fig. 2A). All images were taken from a height of 61 cm on photography platform (Supplemental Fig. 2). The images were processed using the SIAnalysis (Strawberry Image Analysis) software that was developed by Hayashi et al. (2017) (Fig. 2B). This software uses custom algorithms for strawberry shape based on the SmartGrain software developed by Tanabata et al. (2012) to automatically identify the fruit contours based on designated target and non-target image information, and outputs the values of traits measured by the software such as fruit area (AS), fruit length (L), fruit width (W), and the length-to-width ratio (LWR) as comma-separated-value format (CSV). The fruit contours were recorded using a chain code (Freeman 1974). Recognition errors for the contour lines were corrected manually in the SIAnalysis software before outputting the shape data. In addition to the abovementioned image traits, we measured the fruit weight (FW) using an electronic balance.
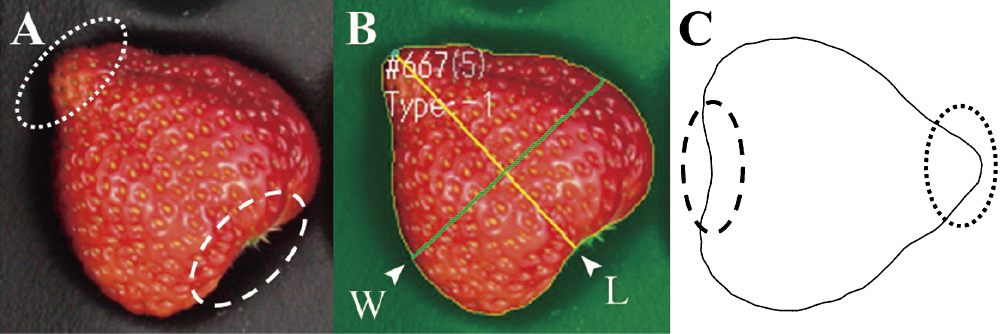
The EFD coefficients were calculated by discrete Fourier transformation of the chain-coded contours using the procedure suggested by Kuhl and Giardina (1982). Generally, the coefficients are then standardized to account for variations related to fruit size, rotation, and the starting position of the contour trace by the procedure based on the ellipse of the first harmonic. However, the rotation method differed slightly from their suggestion; instead, we rotated the EFDs around the fruit’s centroid, and placed the fruit tip at the (1,0) position in the X-Y coordinate plane (Fig. 2C). This process was done to correctly align the direction of the strawberries. The representative EFD for each MAGIC lines was determined by calculating the median of the coefficients from the 3 years of data per line. In this procedure, the median was used to prevent the representative EFD from being distorted by unusually high coefficients. The fruit shape was approximated by the first 20 harmonics that corresponded to the 77 coefficients of the normalized EFDs. The fruit contour can be reconstructed from these EFD coefficients. These processes were performed using the SHAPE on R software (Iwata and Ukai 2002).
Principal-components analysis for summarizing fruit contours
To summarize the information included in the variation of the coefficients, we conducted principal-components analysis (PCA) to obtain PCs that explained all shape variations within the MAGIC population. The shape variation explained by each PC was reconstructed using inverse Fourier transformations (Rohlf and Archie 1984). A series of analyses, from transformation of the chain codes to calculation of the PC scores, was performed using the SHAPE on R software (Iwata and Ukai 2002).
Genotyping of the MAGIC populations
MAGIC population was genotyped using a set of 606 expressed sequence tag (EST) SSR markers (Isobe et al. 2013) that were polymorphic among the six parental cultivars. Since the genome of cultivated strawberry is octoploid, most of the SSR markers generated multiple peaks. Although cultivated strawberry showed diploid inheritance (Isobe et al. 2013), it was almost impossible to detect allelic relationships among all peaks and determine whether a peak corresponded to a single locus or multiple loci. Furthermore, it was also extremely hard to determine the specific subgenome(s) from which each peak derived. Accordingly, all peaks of SSR markers were judged as dominant markers, and genotypes were scored 0 or 1 based on the absence or presence of each peak, respectively. Polymorphisms were investigated using the Gene Marker software (SoftGenetics, LLC, State College, PA, USA) based on the presence or absence of the relevant peaks, and were named by combining the marker name with the fragment size of PCR product. Details of the genotyping and used markers were described in our previous study (Wada et al. 2017) and Supplemental Table 1.
Genome-wide association study
We defined the major PC as the first PCs that cumulatively explained more than 95% of the variance, and used predicted PC scores for all fruits as the phenotypic values. We used genotype data for 606 SSR markers, 1 112 polymorphic loci to perform GWAS for the EFDs using version 5.0 of the Tassel software (Bradbury et al. 2007). The markers with minor allele frequency (MAF) <0.05 were not taken into consideration for the GWAS. The calculation of the Q matrix for population structure analysis of MAGIC was refer to Giordani et al. (2019), which used polyploidy crop and dominant marker as in the present study. STRUCTURE v2.3.4 was used to identify K discrete subpopulations based on admixture model with correlated allele frequencies. Individuals with genotypes coded 0 (absence of peak) and 1 (presence of peak) were treated as haploids to avoid any assumptions about dominance or heterozygotes. Each numerical solution was optimized using Markov Chain Monte Carlo simulations of 60 000 iterations after burn-in of 20 000 repetitions for K ranging from 1 to 10 and 12 times for each K. The value of K that best fit the data set was determined according to the Δk value by Evanno method (Evanno et al. 2005). The Q matrix was established from the result giving the highest value of Ln P(D) in the best K and was used as covariates in subsequent GWAS. We also examined the population structure by PCA of genotype using the R package “pcaMethods” (Stacklies et al. 2007). The pairwise relative kinship matrix (K matrix) was obtained following Hardy (2003) by the R package “EcoGenetics” (Roser et al. 2017).
We used a general linear model (GLM) and mixed linear model (MLM) in GWAS to detect QTLs for strawberry fruit characteristics, where K matrix was taken as a cofactor in MLM but not in GLM. Significant associations between genotype and phenotype were determined by false discovery rate (FDR) <0.05, which was calculated using the R package “stats”. Quantile-quantile (Q-Q) plots were drawn using the R package “qqman” (Turner 2014, https://www.biorxiv.org/content/10.1101/005165v1).
Results
Quantitative evaluation of strawberry fruit shape with EFDs and PCA
We harvested strawberry fruits and photographed each fruit with a digital camera. The fruit contours were automatically recognized by SIAnalysis software, then manually corrected, and outputted as chain codes. The generated chain codes were converted to EFDs.
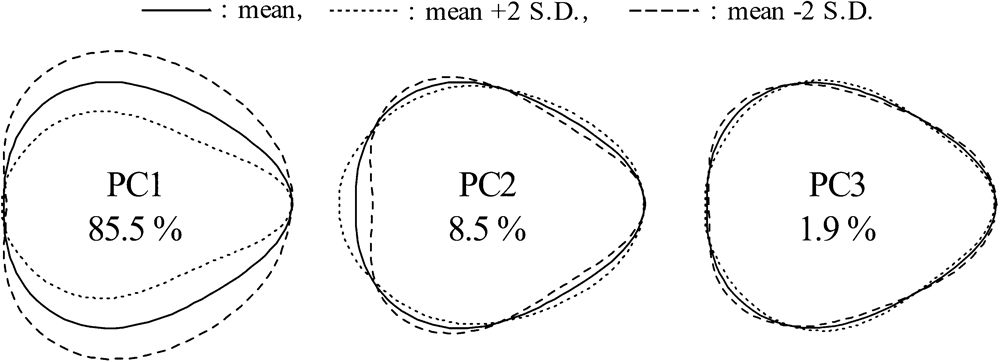
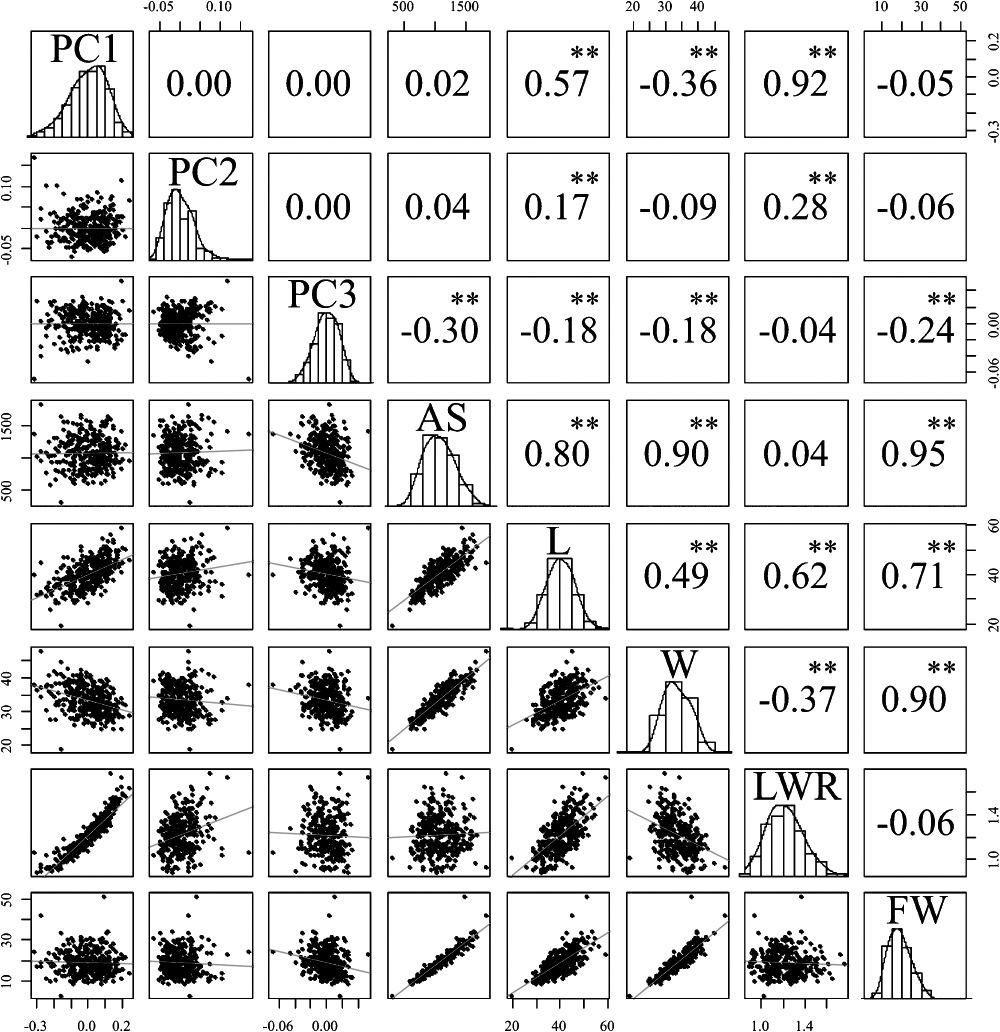
The enormous and complex EFDs were visualized by dimension reduction through PCA. The proportion of variance explained was 85.5% for PC1, 8.5% for PC2, and 1.9% for PC3 (ca. 96% in total; Fig. 3, Supplemental Table 2). PC1 described the variation of fruit length-to-width ratio. PC2 mainly described the shape of the calyx base and the fruit’s conical generatrix, and PC3 described minor effects of other aspects of the fruit shape. We performed correlation analysis (Pearson’s r) between the PCs and traits. PC1 was strongly positively correlated with LWR (r = 0.92**), moderately strongly positively correlated with L (r = 0.57**), and weakly negatively correlated with W (r = –0.36**), but showed no significant correlation with FW. PC2 and PC3 showed no strong correlation with any trait (Fig. 4). For relationships among the fruit traits, AS was closely related to L (r = 0.80**), W (r = 0.90**), and FW (r = 0.95**).
Population structure of MAGIC strawberry population
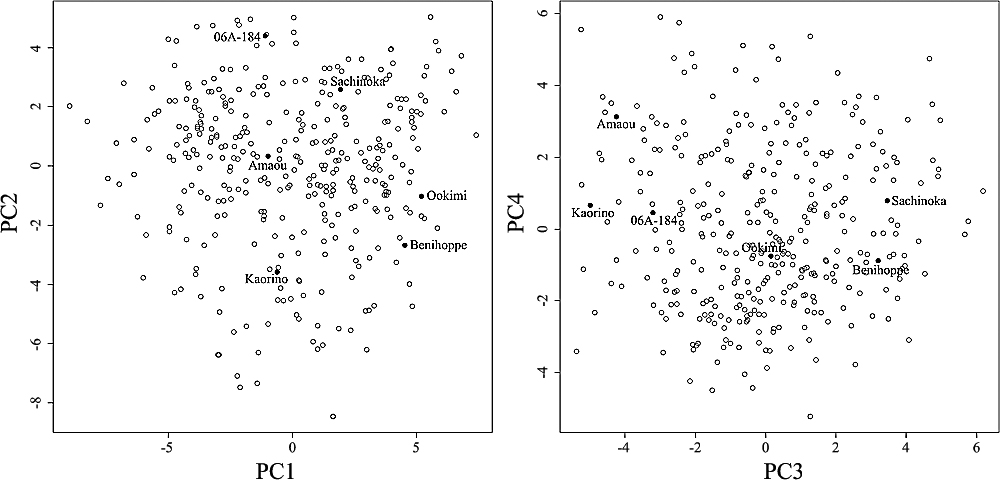
The genotype PCA results were shown in Fig. 5 and Supplemental Table 3. Six founder parents almost evenly scattered in the score plot of PC1–PC2 (Fig. 5 left) and that of PC3–PC4 (Fig. 5 right) as well as individual plants. Furthermore, the factor loadings of the majority of markers were close to 0, and only 11 markers exceeded >0.1 or <–0.1 in PC1–4 (Supplemental Table 3). These PCA analysis suggested that the MAGIC population did not formulate specific clusters which were derived from certain markers and was almost an even mosaic population of six founder parents, which were genetically distant from each other. The Δk value calculated by STRUCTURE v2.3.4 (Pritchard et al. 2000) and the Evanno method (Evanno et al. 2005) was a maximum of 426.1 when K = 2 (Supplemental Fig. 3A). The second highest Δk was 152.2 when K = 3, and after K = 4, Δk oscillated between 0.7 and 13.3.
Genome-wide association study
GWAS based on GLM revealed 2 290 significant associations (FDR <0.05) related to strawberry fruit characteristics. The number of associations in GLM is counted in duplicates across years and traits. Table 1 and Supplemental Table 4 show summary and detected all associations of the GLM-based GWAS results, respectively. The number of associations detected in GLM were 659 for PC1, 514 for L, and 581 for LWR, above 500. Those were 150, 128, 137, 33, and 88 for PC2, PC3, AS, W, and FW, respectively; particularly below 100 for W and FW. Those were 959 for 3-year average from 2014 to 2016 (2014–2016) while in each of three years the number of detected associations were 802, 436, and 93 for 2014, 2015, and 2016, respectively. On the other hand, only two associations were detected for MLM-based GWAS (Table 2). FVES2244_304 was detected for L in 2014–2016, and was located at the corresponding loci for diploid wild strawberry (Fragaria vesca L.) chromosome 7. FVES0958_299 was detected for LWR in 2015, and was located at the corresponding loci for F. vesca chromosome 6. These two associations were also detected in GLM-based GWAS for the same trait and the same year. In addition, the Q-Q plots of GWAS p-value using 2014–2016 were drawn for each trait (Supplemental Figs. 4, 5). While observed –log10(p) was inflated about 2 to 4 times of expected –log10(p) for all traits in Q-Q plot of GLM, observed and expected –log10(p)s were roughly coincident in the Q-Q plot of MLM.
Table 1.
Number of associations for strawberry fruit characteristic detected in a genome-wide association study with general linear model
|
2014–2016 |
2014 |
2015 |
2016 |
Total |
| PC1 |
282 |
(148) |
220 |
(96) |
136 |
(43) |
21 |
(0) |
659 |
(287) |
| PC2 |
38 |
(14) |
46 |
(16) |
62 |
(16) |
4 |
(1) |
150 |
(47) |
| PC3 |
83 |
(12) |
16 |
(5) |
29 |
(5) |
0 |
(0) |
128 |
(22) |
| AS |
73 |
(14) |
64 |
(10) |
0 |
(0) |
0 |
(0) |
137 |
(24) |
| L |
207 |
(94) |
191 |
(81) |
84 |
(40) |
32 |
(4) |
514 |
(219) |
| W |
11 |
(3) |
22 |
(0) |
0 |
(0) |
0 |
(0) |
33 |
(3) |
| LWR |
246 |
(109) |
177 |
(103) |
125 |
(54) |
33 |
(0) |
581 |
(266) |
| FW |
19 |
(4) |
66 |
(12) |
0 |
(0) |
3 |
(0) |
88 |
(16) |
| Total |
959 |
(398) |
802 |
(323) |
436 |
(158) |
93 |
(5) |
2290 |
(884) |
Abbreviations: For the principal components, PC1, PC2, and PC3 represent the first, second, and third PCs, respectively; AS, fruit area; L, fruit length; W, fruit width; LWR, fruit length-to-width ratio; FW, fruit weight; 2014–2016, GWAS result using the average value of strawberries harvested in 2014, 2015, and 2016. Numbers outside brackets indicate the number of markers for q value <0.05, and in the brackets indicate the number of markers for q value <0.01, respectively.
Table 2.
Quantitative trait loci for strawberry fruit characteristic and adjacent DNA markers detected in a genome-wide association study with mixed linear model
| Year |
Trait |
Marker |
Size |
p-value |
q value |
R2 |
F. vesca physical map |
| Linkage |
Mb |
| 2014–2016 |
L |
FVES2244 |
304 bp |
2.82E-05 |
1.71E-02 |
0.06 |
Chr. 7 |
23.2 |
| 2015 |
LWR |
FVES0958 |
299 bp |
6.58E-05 |
4.16E-02 |
0.06 |
Chr. 6 |
0.2 |
Abbreviations: L, fruit length; LWR, fruit length-to-width ratio; 2014–2016, GWAS result using the average value of strawberries harvested in 2014, 2015, and 2016. The Fragaria vesca physical map provisionally shows the chromosome and physical distance of the marker corresponding to F. vesca. The integrated map provisionally shows the linkage group and position of the markers that correspond to the F. × ananassa integrated map (Isobe et al. 2013).
Discussion
In this study, we quantitatively evaluated strawberry fruit shapes using image processing and EFDs, and used GWAS for the fruit morphology traits using MAGIC population derived from six founder parents. We detected 2 290 associations in GLM for all traits, but the GLM is naïve, so we examined them more rigorously. In MLM that considered kinship relatedness, we detected two associations for L and LWR, respectively.
Quantitative measurement of fruit shape with EFDs
EFDs have been used in many previous studies to quantitatively evaluate biological morphology. Although this approach provides a useful morphological description, it requires time-consuming calculations because of the huge amounts of data generated by EFD analysis. Thus, computer software is necessary to accelerate the calculations. Iwata and Ukai (2002) developed the SHAPE software to perform this analysis. SHAPE offers many functions, such as binarization of the images, generation of the chain codes, Fourier transformation, PCA, and inverse Fourier transformation. They also proposed that the quantitative data obtained with this software could support genetic analysis.
We used SHAPE to process digital images of the strawberry fruits and applied EFD analysis to the resulting data. However, we found it difficult to modify the binarized images using SHAPE and used the SIAnalysis software developed by Hayashi et al. (2017) instead. SIAnalysis is very useful in the process of binarizing images and extracting the contour of strawberry fruit, and is superior to SHAPE, but does not have the function to process EFD. It let us easily modify the binarized images manually, obtain precise fruit contour data, generate the chain codes, calculate L, W, and AS automatically based on the binarized data. Subsequent Fourier transformation and PCA were conducted with SHAPE on R based on the methods of Iwata and Ukai (2002). PCA is essential for the subsequent GWAS, because normal EFDs are not independent variables and the size of the EFD dataset was too large to analyze.
PCA successfully extracted the major components that control the variation of fruit shape using EFDs derived from binarized digital camera images as the explanatory variables. The PC scores explained 96% of the variation of strawberry fruit shape in the MAGIC population. We inferred the meanings of the PCs from the reconstructed contours. PC1 was strongly positively correlated with LWR (r = 0.92**), and more weakly correlated with L and W, but was not significantly correlated with AS or FW. This suggests that PC1 independently affects fruit LWR regardless of the fruit size. PC2 was significantly correlated with the sharpness of the fruit tip and with the depression around the calyx base, and PC3 showed a weak significant correlation with AS, L, W, and FW but no difference was found in the inverse Fourier transform because PC3 explains only 1.87% of the strawberry fruit variation. PC2 and PC3 showed weaker correlations than PC1 with the fruit traits, suggesting that these PCs affect variation of multiple aspects of the fruit shape that were difficult to define specifically.
Strawberry fruit length or width could be measured directly, and Lerceteau-Köhler et al. (2012) performed QTL analysis on such traits. But these traits do not accurately evaluate fruit shape. On the other hand, EFD quantitatively evaluates the whole shape, which is its advantage. In fact, PC1 of strawberry fruit shape obtained here mainly signified the variation of LWR. Shimomura et al. (2017) performed EFD and PCA analysis for cucumber, where the PC1 of cucumber fruit shapes also mainly signified the variation of LWR. The proportion of variance of PC1 in cucumber and strawberry fruit shape were 95.8% and 85.8%, respectively. The difference between these values, which is slightly lower for strawberry than cucumber, could be caused by complexity of strawberry fruit such as sharpness or depression. Although some aspects of the fruit shape such as angle of apical parts or the depth of depressions were directly measured with protractors and calipers, these measurements could explain only the portion of the shape variations. On the other hand, EFD can express the whole shape even if it is a complicated shape. The detection of QTLs that affect the complex shape of strawberry fruit might be utilized to transform the strawberry fruit to ideal shape. In Japan, ‘Tochiotome’ has the highest production, followed by ‘Fukuoka S6’ (trade name ‘Amaou’) and then ‘Beni Hoppe’ based on market statistical information (Tokyo Metropolitan Central Wholesale Market 2014–2018). These three cultivars and major commercial cultivars indicate conical shape, not spherical or fan-shape. However, the MAGIC population that derived from six founder cultivars had a wide variety of fruit shapes. This fact clearly suggested, that the conical shape was preferable for Japanese consumers and strawberry breeders could consider conical shape as ideal one.
Genome shuffling of MAGIC population
The Magic population was developed by the mutual crossing or artificial pollination with mixed pollen. The genotype-based PCA was performed to examine whether the MAGIC population was stratified throughout the abovementioned process. PCA using 1 112 polymorphic loci (MAF >0.05) did not detect clear clusters in the MAGIC population and six founder parents. The factor loadings of each loci were quite low. The Evanno method (Evanno et al. 2005) provided the largest Δk value when K = 2 (Supplemental Fig. 3), however, cannot treat K <2 in the structure analysis. These results suggested that there is no or very little population stratification in the MAGIC strawberry population, and that the genomes of the six founder parents were evenly distributed in the MAGIC population.
QTLs for fruit shape detected in the GWAS
We performed GWAS using the obtained fruit shape characteristics (PC1–PC3, L, W, LWR, AS, and FW) and SSR polymorphism information for the MAGIC population. Two types of the GWAS were performed, one is using GLM which did not consider kinship relatedness, and the other is using MLM which considered kinship relatedness. Both considered the population structure. We found a total of 2 290 and 2 associations (FDR <0.05) in GLM and MLM, respectively. This fact reminded us that the associations that were significant in GLM included many false positives, which were suppressed by correction with the K matrix in MLM. Consequently, we could regard the associations that were still significant after correction as reliable QTLs.
The detected associations with GLM varied depending on the trait and year. In total, PC1, L, and LWR had more than 500 associations, on the other hand, W and FW had less than 100 (Table 1). In total, 2014–2016 and 2014 had more than 800 associations, whereas 2016 had only 93 (Table 1). In all traits, GLM detected fewer significant associations in 2016 than in other years. We examined the reason of this tendency by statistically processing the number of fruits, weather conditions, and harvesting date, but finally could not know exact reasons. By contrast, only two significant associations were detected by MLM, FVES2244_304 related to L and FVES0958_299 related to LWR (Table 2). The notable difference in the number of detected associations between GLM and MLM could depend on whether or not contain the genetic relatedness by means of K matrix. The MLM with K matrix can suppress p-value inflation and false positives. In fact, the Q-Q plots of GLM and MLM showed a p-value correction effect. The p-value obtained by GLM without considering the K matrix was inflated (Supplemental Fig. 4), but the MLM corrected by K matrix suppressed the inflation to the same level as the expected –log10(p) (Supplemental Fig. 5). These markers detected by MLM were considered adjacent to the QTL, as K matrix successfully reduced false positives. This result that the K matrix worked effectively was in agreement with other association studies using dominant markers. Dadras et al. (2014) performed association analysis using phenotype of tobacco and genotype of amplified fragment length polymorphism (AFLP) markers, in addition, also tested a correction with Q matrix and K matrix. Then, 29 associations detected by GLM decreased to 10 by MLM. In the analysis performed by Giordani et al. (2019) using maize and AFLP markers, the 7 associations detected in GLM were corrected by K matrix to 3 (MLM). Yu et al. (2006) concluded that the K matrix worked effectively, and the Q-Q plots they drew also improved the inflation by considering the kinship relatedness. These results, including ours, are consistent with the statement of Achleitner et al. (2008) that the combination of Q matrix and K matrix is presumably the best correction for population structure.
The associations were detected by MLM only for L and LWR, but no associations for PCs. However, since PC1 was significantly correlated with L and LWR and lowest q value of PC1 was obtained as 0.37 in FVES2244, which was the same as L, the application of SSR markers listed in Table 2 could contribute to modifying strawberry fruit shape dramatically. In contrast, PC2 and PC3 did not show any strong correlation with other directly measurable traits (Fig. 4). Furthermore, neither strong associations were detected in GWAS with MLM, although QTLs for PC2 will transform the strawberry fruit into conical shape, like “strawberryly”. One of the reasons for no detection of QTLs (or associations) for PC2 and PC3 in MLM-based GWAS is that the fruit shape is controlled by many QTLs with small effects, each of which was polygenic and was difficult to detect as a significant effect. Further, the EFDs can describe the whole contour of fruit, but cannot describe specific parts (e.g., only the tip of fruit), and PC1 explained the most parts of variation of fruit shape with other PCs only contributing to the remaining minor parts of the variation, which might lead to no detection of QTLs in PC2 and PC3.
Generally speaking, strawberry breeders do not always focus on the whole shape variation. They could be interested only in the sharpness of the fruit tip, or could be interested only in the depression around the calyx base. In that regard, novel analysis method specifically focusing on the morphological parts of strawberry fruits and enlarging its phenotypic variation were quite necessary. The new Fourier descriptor proposed by Uesaka (1984) can be applied to open curves, and is valuable for quantification of partial shape. In addition, He et al. (2017) and Kochi et al. (2018) measured strawberry fruit three-dimensionally. 3D measurement provides more information about the shape of strawberry such as volume, surface condition, attitude of sepal. To change strawberry fruit to ideal shape requires stable detection of QTLs in MLM-based GWAS by improving the evaluation accuracy of the fruit shape using the abovementioned methods. The combination of quantification methods for non-measurable trait and genetic analysis will lead to detection of QTLs for PC2 and PC3 to provide the strawberry with the preferable shape for the consumer.
Several genes related to fruit shape have been identified in other crops. For example, in tomato, how gene expression affects fruit shape is already known. According to Rodríguez et al. (2011), the diversity in tomato fruit shape originates from only four mutated genes, OVATE, SUN, FASCIATED, and LOCULE NUMBER. Further refinement of the QTLs detected in this study will lead to the identification of genes that control strawberry fruit morphology. Future refinement of QTLs and breeding of strawberry cultivar which have ideal fruit shape could be promoted by using the MAGIC population. In plants, MAGIC populations were first developed and described in Arabidopsis thaliana (Cavanagh et al. 2008, Kover et al. 2009), and have been created in many crops (Dell’Acqua et al. 2015, Pascual et al. 2015). The MAGIC population is known to have higher genetic diversity and higher mapping resolution than the bi-parental population. The bi-parental population can be analyzed for only alleles that differ between two parents, whereas the MAGIC population has a greater genetic diversity. The MAGIC population of strawberry developed by Wada et al. (2017) also have high genetic diversity, and will be a useful material to reveal how QTLs and genes control fruit shape.
In the present study, we evaluated the contours of strawberry fruits quantitatively as continuous variables using EFD. GWAS based on the EFD results for the fruit images revealed 2 290 associations (GLM) and 2 QTLs (MLM) for the fruit shape characteristics. Although the EFDs effectively described the shape variation, but also has a disadvantage. It is not applicable to open curves, that is, could not describe partial morphological variation. As we mentioned before, PC2 could be a critical concern in practical strawberry breeding. However, the variation of PC1 was prioritized and the effect of PC2 was evaluated relatively smaller in the analysis of EFDs. To overcome this issue, p-type Fourier descriptor (PFD; Uesaka 1984) might be effective. PFDs provide more power for focusing on one specific aspect of the contour, such as the tip sharpness, and applying PFDs to describe the tip or the calyx base of the strawberry fruit could improve the evaluation accuracy for these aspects of the contour and lead to the detection of novel QTLs for fruit shape. Quantification with these methods could lead to accurate description of fruit shape and make it possible to select a new cultivar with good shape based on the scientific evidence. In addition to obtaining more data to support phenotype evaluation, improvement of the genotype evaluation using higher-density marker information for the octoploid strawberry genome will improve the accuracy of the genome analysis. Specifically, the Affymetrix IStraw90 Axiom array (Bassil et al. 2015), which comprises 95 062 SNPs and indels, can provide more details of the strawberry genotype and identify sub-genomes of cultivated strawberry. If fine mapping of QTLs for strawberry fruit shape can be performed, comprehensively understanding genetics of fruit shape could be promoted, then marker-assisted selection for strawberry fruit shape could be implemented, thereby allowing breeders to more efficiently approach the ideal (conical) fruit shape of strawberries.
Author Contribution Statement
SN and TW conceived of the whole study. TW and KO developed the strawberry MAGIC population. SN, MT, TW, KO, MM, CH, KT, and KS carried out the field evaluation. SI performed genotyping. SN, AH, and TT performed image processing. SN performed EFD analysis. SN and TW performed GWAS. SN wrote the manuscript with support from TW. All authors provided critical feedback and helped shape the research, analysis and manuscript. KS supervised the whole study.
Acknowledgments
We thank Dr. H. Iwata and Ms. L. Sakamoto, JSPS research fellow, from the University of Tokyo for practical advice about the EFD analysis. This study was partly supported by a grant from the Genomics-based Technology for Agricultural Improvement (DHR1) and the Science and Technology Research Promotion Program for Agriculture, Forestry, Fisheries, and Food Industry (27003A) of the Ministry of Agriculture, Forestry, and Fisheries of Japan.
Literature Cited
- Achleitner, A., N.A. Tinker, E. Zechner and H. Buerstmayr (2008) Genetic diversity among oat varieties of worldwide origin and associations of AFLP markers with quantitative traits. Theor. Appl. Genet. 117: 1041–1053.
- Bassil, N.V., T.M. Davis, H. Zhang, S. Ficklin, M. Mittmann, T. Webster, L. Mahoney, D. Wood, E.S. Alperin, U.R. Rosyara et al. (2015) Development and preliminary evaluation of a 90 K Axiom® SNP array for the allo-octoploid cultivated strawberry Fragaria × ananassa. BMC Genomics 16: 155.
- Bierbaum, R.M. and S. Ferson (1986) Do symbiotic pea crabs decrease growth rate in mussels? Biol. Bull. 170: 51–61.
- Bradbury, P.J., Z. Zhang, D.E. Kroon, T.M. Casstevens, Y. Ramdoss and E.S. Buckler (2007) TASSEL: software for association mapping of complex traits in diverse samples. Bioinformatics 23: 2633–2635.
- Cavanagh, C., M. Morell, I. Mackay and W. Powell (2008) From mutations to MAGIC: resources for gene discovery, validation and delivery in crop plants. Curr. Opin. Plant Biol. 11: 215–221.
- Costa, C., P. Menesatti, G. Paglia, F. Pallottino, J. Aguzzi, V. Rimatori, G. Russo, S. Recupero and G. Reforgiato Recupero (2009) Quantitative evaluation of Tarocco sweet orange fruit shape using optoelectronic elliptic Fourier based analysis. Postharvest Biol. Technol. 54: 38–47.
- Dadras, A.R., H. Sabouri, G.M. Nejad, A. Sabouri and M. Shoai-Deylami (2014) Association analysis, genetic diversity and structure analysis of tobacco based on AFLP markers. Mol. Biol. Rep. 41: 3317–3329.
- Dell’Acqua, M., D.M. Gatti, G. Pea, F. Cattonaro, F. Coppens, G. Magris, A.L. Hlaing, H.H. Aung, H. Nelissen, J. Baute et al. (2015) Genetic properties of the MAGIC maize population: a new platform for high definition QTL mapping in Zea mays. Genome Biol. 16: 167.
- Diaz, G., A. Zuccarelli, I. Pelligra and A. Ghiani (1989) Elliptic Fourier analysis of cell and nuclear shapes. Comput. Biomed. Res. 22: 405–414.
- Evanno, G., S. Regnaut and J. Goudet (2005) Detecting the number of clusters of individuals using the software STRUCTURE: a simulation study. Mol. Ecol. 14: 2611–2620.
- Ferson, S., F.J. Rohlf and R.K. Koehn (1985) Measuring shape variation of two-dimensional outlines. Syst. Zool. 34: 59–68.
- Freeman, H. (1974) Computer processing of line-drawing images. ACM Comput. Surv. 6: 57–97.
- Furuta, N., S. Ninomiya, N. Takahashi, H. Ohmori and Y. Ukai (1995) Quantitative evaluation of soybean (Glycine max L. Merr.) leaflet shape by principal component scores based on elliptic fourier descriptor. Japan. J. Breed. 45: 315–320.
- Giordani, W., C.A. Scapim, P. M. Ruas, C.D.F. Ruas, R. Contreras-Soto, M. Coan, I.C.D.B. Fonseca and L.S.A. Gonçalves (2019) Genetic diversity, population structure and AFLP markers associated with maize reaction to southern rust. Bragantia Campinas 78: 183–196.
- Hardy, O.J. (2003) Estimation of pairwise relatedness between individuals and characterization of isolation‐by‐distance processes using dominant genetic markers. Mol. Ecol. 12: 1577–1588.
- Hayashi, A., T. Tanabata, T. Wada and S. Isobe (2017) A proposal of image analysis system for measuring strawberries. Hort. Res. (Japan) 16 (Suppl. 1): 446 (in Japanese).
- He, J.Q., R.J. Harrison and B. Li (2017) A novel 3D imaging system for strawberry phenotyping. Plant Methods 13: 93.
- Hirakawa, H., K. Shirasawa, S. Kosugi, K. Tashiro, S. Nakayama, M. Yamada, M. Kohara, A. Watanabe, Y. Kishida, T. Fujishiro et al. (2014) Dissection of the octoploid strawberry genome by deep sequencing of the genomes of Fragaria species. DNA Res. 21: 169–181.
- Honda, F., M. Yamato, K. Niiuchi and T. Amano (1974) Studies on the breeding of new strawberry variety ‘Harunoka’. Bull. Vege. and Ornamental Crops Res. Stn. Series C (Kurume) 1: 1–14.
- Ishihara, Y., K. Takano, M. Ueki and H. Tochigi (1996) New strawberry cultivar ‘Tochiotome’. Bull. Tochigi Agr. Exp. Stn. 44: 109–123.
- Isobe, S.N., H. Hirakawa, S. Sato, F. Maeda, M. Ishikawa, T. Mori, Y. Yamamoto, K. Shirasawa, M. Kimura, M. Fukami et al. (2013) Construction of an integrated high density simple sequence repeat linkage map in cultivated strawberry (Fragaria × ananassa) and its applicability. DNA Res. 20: 79–92.
- Iwata, H., S. Niikura, S. Matsuura, Y. Takano and Y. Ukai (1998) Evaluation of variation of root shape of Japanese radish (Raphanus sativus L.) based on image analysis using elliptic Fourier descriptors. Euphytica 102: 143–149.
- Iwata, H., H. Nesumi, S. Ninomiya, Y. Takano and Y. Ukai (2002) Diallel analysis of leaf shape variations of citrus varieties based on elliptic Fourier descriptors. Breed. Sci. 52: 89–94.
- Iwata, H. and Y. Ukai (2002) SHAPE: a computer program package for quantitative evaluation of biological shapes based on elliptic Fourier descriptors. J. Hered. 93: 384–385.
- Kitamura, H., T. Mori, J. Kohori, S. Yamada and H. Shimizu (2015) Breeding and extension of the new strawberry cultivar ‘Kaorino’ with extremely early flowering and resistance to anthracnose. Hortic. Res. 14: 89–95.
- Kochi, N., T. Tanabata, A. Hayashi and S. Isobe (2018) A 3D shape-measuring system for assessing strawberry fruits. Int. J. Autom. Technol. 12: 395–404.
- Kover, P.X., W. Valdar, J. Trakalo, N. Scarcelli, I.M. Ehrenreich, M.D. Purugganan, C. Durrant and R. Mott (2009) A Multiparent Advanced Generation Inter-Cross to fine-map quantitative traits in Arabidopsis thaliana. PLoS Genet. 5: e1000551.
- Kuhl, F.P. and C.R. Giardina (1982) Elliptic Fourier features of a closed contour. Comput. Graph. Image Process. 18: 236–258.
- Lerceteau-Köhler, E., A. Moing, G. Guérin, C. Renaud, A. Petit, C. Rothan and B. Denoyes (2012) Genetic dissection of fruit quality traits in the octoploid cultivated strawberry highlights the role of homoeo-QTL in their control. Theor. Appl. Genet. 124: 1059–1077.
- McLellan, T. (1993) The roles of heterochrony and heteroblasty in the diversification of leaf shapes in Begonia dregei (Begoniaceae). Am. J. Bot. 80: 796–804.
- Mitsui, H., K. Fujita, T. Sueyoshi and H. Fushihara (2003) New strawberry cultivar Fukuoka S6 and Fukuoka S7 for forcing culture. Bull. Fukuoka Agric. Res. Cent. 22: 61–68.
- Mori, T., T. Toya and T. Fujiwara (2000) Development of the new strawberry cultivar Sanchiigo with resistance to anthracnose. Bull. Mie Agri. Tech. Cent. 27: 27–36.
- Morishita, M., T. Mochizuki, Y. Noguchi, K. Sone and O. Yamakawa (1997) ‘Sachinoka’, a new strawberry variety for forcing culture. Bull. Natl. Res. Inst. Veg., Ornam. Plants & Tea, Ser. 12: 91–115.
- Nishida, A. (2002) The breeding of “Red Pearl” strawberry and it’s diffusion. Res. Journal of Food and Agric. 25: 22–25.
- Ohsawa, R., T. Tsutsumi, H. Uehara, H. Namai and S. Ninomiya (1998) Quantitative evaluation of common buckwheat (Fagopyrum esculentum Moench) kernel shape by elliptic Fourier descriptor. Euphytica 101: 175–183.
- Okimura, M. (2010) Development and dissemination of new strawberry cultivars Ookimi and Koinoka. Bio Kyushu 195.
- Pascual, L., N. Desplat, B.E. Huang, A. Desgroux, L. Bruguier, J.P. Bouchet, Q.H. Le, B. Chauchard, P. Verschave and M. Causse (2015) Potential of a tomato MAGIC population to decipher the genetic control of quantitative traits and detect causal variants in the resequencing era. Plant Biotechnol. J. 13: 565–577.
- Plant Variety Protection Office at Ministry of Agriculture, Forestry and Fisheries, Japan (2011) Fragaria L. in Test Guidelines. http://www.hinshu2.maff.go.jp/info/sinsakijun/kijun/1289.pdf (accessed 2019-02-12)
- Pritchard, J.K., M. Stephens and P. Donnelly (2000) Inference of population structure using multilocus genotype data. Genetics 155: 945–959.
- Rodríguez, G.R., S. Muños, C. Anderson, S.C. Sim, A. Michel, M. Causse, B.B. McSpadden Gardener, D. Francis and E. van der Knaap (2011) Distribution of SUN, OVATE, LC, and FAS in the tomato germplasm and the relationship to fruit shape diversity. Plant Physiol. 156: 275–285.
- Rohlf, F.J. and J. Archie (1984) A comparison of Fourier methods for the description of wing shape in mosquitoes (Diptera: Culicidae). Syst. Zool 33: 302–317.
- Roser, L.G., L.I. Ferreyra, B.O. Saidman and J.C. Vilardi (2017) EcoGenetics: an R package for the management and exploratory analysis of spatial data in landscape genetics. Mol. Ecol. Resour. 17: e241–e250.
- Shimomura, K., N. Fukino, M. Sugiyama, Y. Kawazu, Y. Sakata and Y. Yoshioka (2017) Quantitative trait locus analysis of cucumber fruit morphological traits based on image analysis. Euphytica 213: 138.
- Shulaev, V., D.J. Sargent, R.N. Crowhurst, T.C. Mockler, O. Folkerts, A.L. Delcher, P. Jaiswal, K. Mockaitis, A. Liston, S.P. Mane et al. (2011) The genome of woodland strawberry (Fragaria vesca). Nat. Genet. 43: 109–116.
- Stacklies, W., H. Redestig, M. Scholz, D. Walther and J. Selbig (2007) pcaMethods—a bioconductor package providing PCA methods for incomplete data. Bioinformatics 23: 1164–1167.
- Takeuchi, T., H. Fujinami, T. Kawata and M. Matsumura (1999) Pedigree and characteristics of a new strawberry cultivar “Beni hoppe”. Bull. Shizuoka Agric. Exp. St. 44: 13–24.
- Tanabata, T., T. Shibaya, K. Hori, K. Ebana and M. Yano (2012) SmartGrain: high-throughput phenotyping software for measuring seed shape through image analysis. Plant Physiol. 160: 1871–1880.
- Tokyo Metropolitan Central Wholesale Market (2014–2018) Market statistical information. http://www.shijou-tokei.metro.tokyo.jp/ (accessed 2019-02-14)
- Uesaka, Y. (1984) A new fourier descriptor applicable to open curves. Electron. Commun. Japan (Part I Commun.) 67: 1–10.
- Wada, T., K. Oku, S. Nagano, S. Isobe, H. Suzuki, M. Mori, K. Takata, C. Hirata, K. Shimomura, M. Tsubone et al. (2017) Development and characterization of a strawberry MAGIC population derived from crosses with six strawberry cultivars. Breed. Sci. 67: 370–381.
- White, R.J., H.C. Prentice and T. Verwijst (1988) Automated image acquisition and morphometric description. Can. J. Bot. 66: 450–459.
- Yu, J., G. Pressoir, W.H. Briggs, I.V. Bi, M. Yamasaki, J.F. Doebley, M.D. McMullen, B.S. Gaut, D.M. Nielsen, J.B. Holland et al. (2006) A unified mixed-model method for association mapping that accounts for multiple levels of relatedness. Nat. Genet. 38: 203–208.
- Zorrilla-Fontanesi, Y., A. Cabeza, P. Domínguez, J.J. Medina, V. Valpuesta, B. Denoyes-Rothan, J.F. Sánchez-Sevilla and I. Amaya (2011) Quantitative trait loci and underlying candidate genes controlling agronomical and fruit quality traits in octoploid strawberry (Fragaria × ananassa). Theor. Appl. Genet. 123: 755–778.