Abstract
Twenty-four wheat lines, developed by Aegilops tauschii Coss. introgressions and previously selected for heat or salinity stress tolerance, were evaluated under a drought-rewatering-drought cycle for two years. The objective was to select breeding lines that are resilient to more than one abiotic stress. The experiment was designed in alpha lattice with three replications. Drought was imposed by withholding water during flowering. The results revealed considerable genetic variability in physio-agronomic traits, reflecting the variation in the introgressed segments. High heritability estimates (above 47%) were recorded for most traits, including days to 50% heading, plant height, and thousand-grain weight, indicating the genetic control of these traits which may be useful for cultivar development. The trait-trait correlations within and between water regimes highlighted a strong association among the genetic factors controlling these traits. Some lines exhibited superior performance in terms of stress tolerance index and mean productivity compared with their backcross parent and elite cultivars commonly grown in hot and dry areas. Graphical genotyping revealed unique introgressed segments on chromosomes 4B, 6B, 2D, and 3D in some drought-resilient lines which may be linked to drought resilience. Therefore, we recommend these lines for further breeding to develop climate-resilient wheat varieties.
Introduction
Wheat (Triticum aestivum L.) productivity is considerably limited by persistent drought stress. To meet global wheat demands, the current annual increase of 1% must be accelerated to at least 1.6% (GCARD 2012). This task is compounded by the current climate change scenario (Elliott et al. 2014), and therefore, developing climate-resilient wheat genotypes with the capacity to thrive under different abiotic stresses needs urgent attention.
Climate-resilient wheat genotypes are scarce due to the narrow genetic diversity in modern wheat cultivars (Ogbonnaya et al. 2013). To broaden this genetic diversity, the use of wheat wild relatives for stress resilience breeding has been widely reported (Cox et al. 2017, Kishii 2019, Ogbonnaya et al. 2013, Tsujimoto et al. 2015). To utilize the variation in Ae. tauschii for wheat breeding, synthetic hexaploid wheat lines were developed by crossing Ae. tauschii accessions with a durum wheat cultivar, ‘Langdon’ (Tsujimoto et al. 2015). Then, to reduce linkage drag, the synthetic hexaploid wheat lines were crossed and backcrossed with a popular bread wheat cultivar, ‘Norin 61’ (N61) and the resulting lines were named ‘multiple synthetic derivative (MSD) lines’ (Tsujimoto et al. 2015). The MSD lines possess a wide diversity of stress tolerance-related traits (Elbashir et al. 2017b, Gorafi et al. 2018). Elbashir et al. (2017b) evaluated a population of 400 MSD lines under heat stress in Sudan and selected heat-tolerant candidate lines. Similarly, the same population was evaluated for salinity tolerance, and salinity-tolerant candidate lines were selected (manuscript under preparation). However, genetic analysis for drought resilience among the MSD lines is limited. Also, the role of Ae. tauschii in conferring multiple stress tolerance to wheat is not well understood. Since wheat response to various abiotic stresses is similar and operates through connected pathways (Abhinandan et al. 2018, Tounsi et al. 2019), we selected the previously-reported heat-tolerant (Elbashir et al. 2017b) and salinity-tolerant MSD lines for evaluation under a drought-rewatering-drought cycle.
The objective was to select drought-resilient MSD lines that may also possess heat or salinity resilience traits for breeding. MSD lines exhibiting high-stress tolerance index (STI) and mean productivity (MP) compared with their backcross parent and standard cultivars under drought stress were selected for further breeding.
Materials and Methods
Plant materials
Twenty-four MSD lines were selected based on heat stress tolerance (14 lines) (Elbashir et al. 2017a, 2017b) and salinity stress tolerance (10 lines) (manuscript under preparation). Two of the MSD lines were previously named as MNH2 and MNH5 (Elbashir et al. 2017b). For consistency with Elbashir et al. (2017b), we will retain the names of these two lines (MNH2 and MNH5). Therefore, in this study, the term “MSD lines” refers to all twenty-four lines including MNH2 and MNH5. For comparison, the backcross parent of the MSD lines (N61) and three check cultivars were included in the study. The check cultivars were ‘Imam’ (a widely cultivated cultivar in Sudan), ‘Cham 6’ and ‘Halberd’ (elite wheat cultivars from ICARDA and CIMMYT, respectively). A list of plant materials and their pedigrees is shown in Table 1.
Table 1.
List of selected plant materials showing heat or salinity tolerance traits
| Genotype |
Trait |
Synthetic family |
Pedigree |
| Norin 61 |
Control |
|
Backcross parent of the MSD lines (Japan) |
| Imam |
Check |
|
Sudan, Turkey, CIMMYT |
| Halberd |
Check |
|
CIMMYT |
| Cham 6 |
Check |
|
ICARDA, Syria |
| MSD006 |
Heat tolerant |
Syn65 |
Norin 61/T. durum cv. Langdon × Ae. tauschii KU-2132//*Norin 61 |
| MSD084 |
Heat tolerant |
Syn30 |
Norin 61/T. durum cv. Langdon × Ae. tauschii IG131606//*Norin 61 |
| MSD108 |
Heat tolerant |
Syn45 |
Norin 61/T. durum cv. Langdon × Ae. tauschii KU-2126//*Norin 61 |
| MSD186 |
Heat tolerant |
Syn30 |
Norin 61/T. durum cv. Langdon × Ae. tauschii IG131606//*Norin 61 |
| MSD265 |
Heat tolerant |
Syn44 |
Norin 61/T. durum cv. Langdon × Ae. tauschii KU-2124//*Norin 61 |
| MSD296 |
Heat tolerant |
Syn32 |
Norin 61/T. durum cv. Langdon × Ae. tauschii KU-2039//*Norin 61 |
| MSD345 |
Heat tolerant |
Syn48 |
Norin 61/T. durum cv. Langdon × Ae. tauschii KU-2829A//*Norin 61 |
| MSD360 |
Heat tolerant |
Syn57 |
Norin 61/T. durum cv. Langdon × Ae. tauschii KU-2078//*Norin 61 |
| MSD054 |
Heat tolerant |
Syn26 |
Norin 61/T. durum cv. Langdon × Ae. tauschii AE454//*Norin 61 |
| MSD208 |
Heat tolerant |
Syn26 |
Norin 61/T. durum cv. Langdon × Ae. tauschii AE454//*Norin 61 |
| MSD453 |
Heat tolerant |
Syn50 |
Norin 61/T. durum cv. Langdon × Ae. tauschii AT55//*Norin 61 |
| MSD367 |
Heat tolerant |
Syn57 |
Norin 61/T. durum cv. Langdon × Ae. tauschii KU-2078//*Norin 61 |
| MNH2 |
Heat tolerant |
Syn68 |
Norin 61/T. durum cv. Langdon × Ae. tauschii KU-2156//*Norin 61 |
| MNH5 |
Heat tolerant |
Syn29 |
Norin 61/T. durum cv. Langdon × Ae. tauschii IG126387//*Norin 61 |
| MSD308 |
Salinity tolerant |
Syn60 |
Norin 61/T. durum cv. Langdon × Ae. tauschii KU-2090//*Norin 61 |
| MSD366 |
Salinity tolerant |
Syn66 |
Norin 61/T. durum cv. Langdon × Ae. tauschii KU-2136//*Norin 61 |
| MSD254 |
Salinity tolerant |
Syn45 |
Norin 61/T. durum cv. Langdon × Ae. tauschii KU-2126//*Norin 61 |
| MSD53 |
Salinity tolerant |
Syn68 |
Norin 61/T. durum cv. Langdon × Ae. tauschii KU-2156//*Norin 61 |
| MSD376 |
Salinity tolerant |
Syn68 |
Norin 61/T. durum cv. Langdon × Ae. tauschii KU-2156//*Norin 61 |
| MSD273 |
Salinity tolerant |
Syn30 |
Norin 61/T. durum cv. Langdon × Ae. tauschii IG131606//*Norin 61 |
| MSD386 |
Salinity tolerant |
Syn72 |
Norin 61/T. durum cv. Langdon × Ae. tauschii PI508262//*Norin 61 |
| MSD55 |
Salinity tolerant |
Syn51 |
Norin 61/T. durum cv. Langdon × Ae. tauschii AT76//*Norin 61 |
| MSD140 |
Salinity tolerant |
Syn68 |
Norin 61/T. durum cv. Langdon × Ae. tauschii KU-2156//*Norin 61 |
| MSD044 |
Salinity tolerant |
Syn71 |
Norin 61/T. durum cv. Langdon × Ae. tauschii PI499262//*Norin 61 |
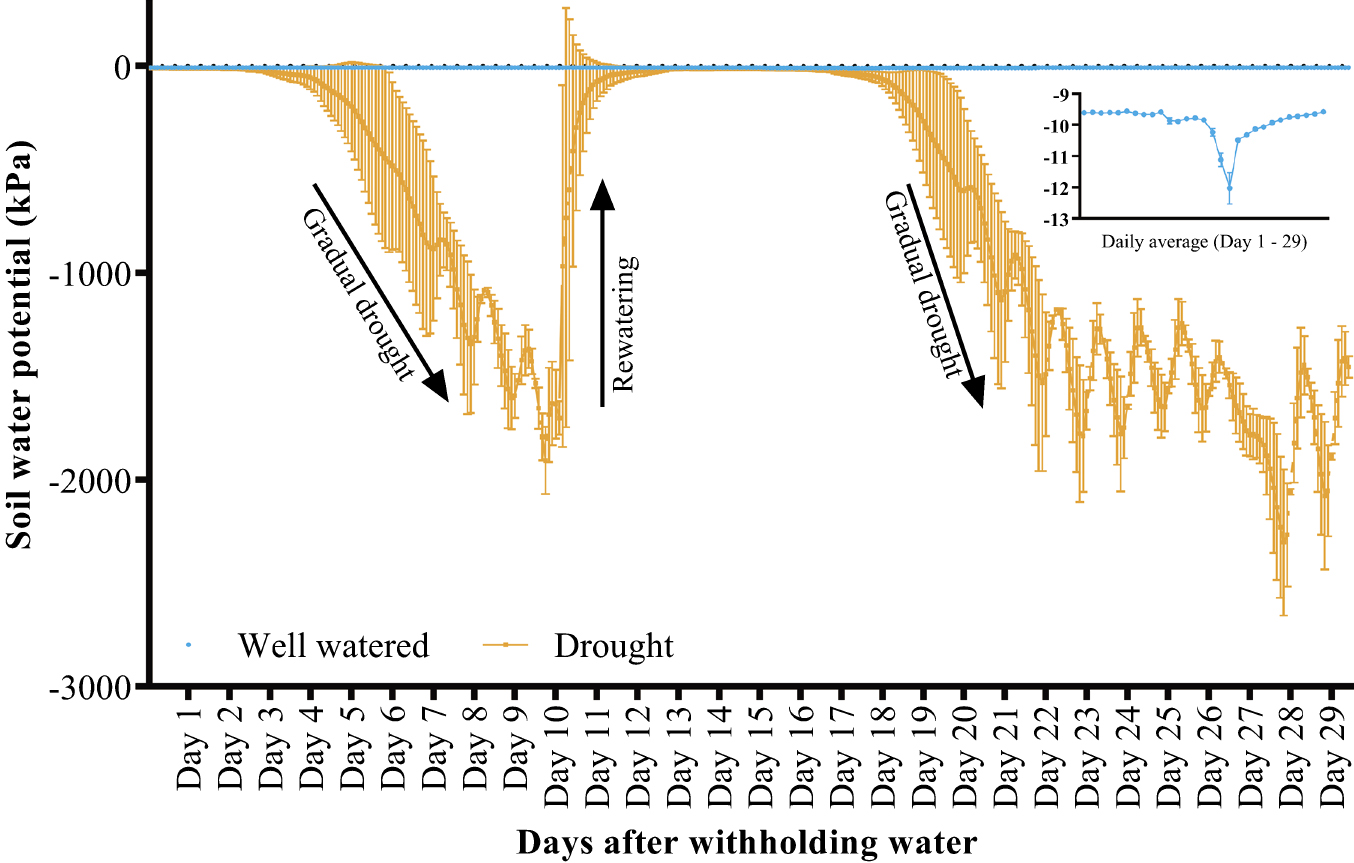
The experiment was conducted in a greenhouse in Arid Land Research Center, Tottori University, Japan (coordinates: 35.5354534, 134.212066), during the 2018/2019 and 2019/2020 growing seasons. Two rectangular beds (100 m × 1.2 m each) were constructed using concrete blocks, 0.35 m deep. The beds were filled with sand-dune regosol (collected from the Tottori Sand Dunes). Four irrigation tubes (0.3 m apart) were set along the beds. Before sowing, fertilizer (NPK 366) was applied at 20 kg ha–1 by mixing with soil. A second application (NPK 366 + Mg) was made during the tillering stage at 50 kg ha–1. Seeds were sown on rows across the beds, each row for a different genotype, with planting distance 0.2 m × 0.3 m between and within rows. At first, eight seeds were sown per row, but latter thinned to four plants at 20 d after germination. Seeds were sown on January 29th and December 15th during the first and second growing seasons, respectively. The experiment was designed in alpha lattice with two treatment levels (well-watered and drought conditions) and three replicates per treatment. The average light intensity in the greenhouse during the reproductive stage was 37,546 lx. The corresponding day/night temperature and relative humidity were 31/18°C and 36/67%, respectively. The soil water potential was measured every two hours using sensors (Decagon devices, WA, USA). Automatic irrigation was performed using Aqua Pro automated irrigation controller (Netafim, Tel Aviv, Israel). When 50% of the plants had flowered, drought was imposed by withholding water supply in one bed, while the well-watered condition was maintained at 90% field capacity. To account for minor phenological differences between the genotypes, genotypes with more than 7 d of delayed flowering (compared to N61) were separated from other genotypes and exposed to drought separately. To mimic the erratic rainfall pattern common in drought-prone areas, the drought-treated bed was rewatered when soil moisture was near permanent wilting point (–1500 kPa, Fig. 1).
The number of days-to-heading (DH) was measured when 50% of the spikes had headed. Chlorophyll content (SPAD) was measured during the grain-filling stage using the Minolta SPAD-502 chlorophyll meter (Konica-Minolta, Japan). The SPAD readings were made on the penultimate leaves of 12 main tillers (four tillers per replicate). Plant height (PH), biomass per square meter (BIO), grain weight per square meter (GY), spike number per square meter (SN), grain number per spike (GPS), thousand-grain weight (TGW), and harvest index (HI) were determined at maturity. The STI was calculated as grain weight difference between drought-stressed and well-watered plants using the equation below:
where GWsi is the grain weight under drought stress, and GWpi is the grain weight under well-watered conditions, for genotype “i” (Fernandez 1992). The MP was calculated as average yield in the well-watered and drought conditions (Rosielle and Hamblin 1981).
Graphical genotyping using DArT-seq markers
Genomic DNA was extracted using the CTAB method (Saghai-Maroof et al. 1984) and sent to Diversity Arrays Technology Pty Ltd., Australia (http://www.diversityarrays.com) for whole-genome scanning using the DArT-seq platform. Complexity reduction was applied to obtain a subset of restriction fragments for each genotype using a combination of restriction enzymes (Sansaloni et al. 2011). The restriction fragments were then sequenced and aligned to the wheat_ChineseSpring10 reference genome and wheat_ConsensusMap_version_4. The presence or absence variation of the genomic fragments (SilicoDArT markers) were used for graphical genotyping. The SilicoDArT markers are dominant and were scored in a binary fashion: “0” or “1” representing absence or presence, respectively, of a restriction fragment containing the marker sequence. A total of 51,202 SilicoDArT markers were obtained. The markers were then filtered on the basis of minimum reproducibility (95%), call rate (90%), and average read depth (8). Only markers that have known chromosomal positions and are polymorphic between N61 and the synthetic parents of individual MSD lines were used for genotyping. Finally, a minimum of 4,148 polymorphic markers were used for the graphical genotyping of individual genotypes. The markers were ordered according to their position within each chromosome from top to bottom, and the conditional formatting function in Microsoft Excel 2019 was used to highlight each marker.
Statistics
ANOVA was performed for nine physio-agronomic traits for each year following the General Linear Model, using GenStat 18th edition (http://www.genstat.co.uk). The ANOVA was performed by considering genotype by water regime as Treatment Structure, and Rep/Sub-block as Blocking (Nuisance terms). Broad-sense heritability was estimated for each trait using Plant Breeding Tools software version 1.3 (http://bbi.irri.org). The correlation coefficients for nine agronomic traits were calculated using IBM SPSS Statistics for Windows, version 23 (IBM Corp., Armonk, NY, USA). A principal component analysis (PCA) was conducted using the FactoMineR package in R (Lê et al. 2008). Genotype-genotype comparisons for STI and MP were conducted using the Tukey Honestly Significant Difference (HSD) test, and drought-tolerant candidates were selected based on high STI and MP.
Results
Influence of genotype and water regime on trait variability
Bartlett’s test for homogeneity of variance revealed that the error variances between the two years were heterogeneous for most traits (F = 3,332; P < 0.05) and therefore, individual year data were used to assess drought resilience. Although the sowing dates were different between 2019 and 2020, the trend for most of the evaluated traits was the same in both years. The means and ranges of all evaluated traits for the MSD lines and N61 are shown in Table 2. The ANOVA table (Table 3) revealed highly significant differences between the main effects of genotype (G) and water regime (E) for most of the evaluated traits in each year. The DH was non-significantly affected by water regime in both years. The interaction effects of G and E (G×E) were significant (P < 0.05) for SPAD, GY and TGW during 2019, and for SPAD and SN during 2020. Other traits were non-significantly affected by G×E interaction in both years (Table 3). In 2020, the investigated genotypes showed longer DH and higher GY and HI than in 2019 under both water regimes. Two MSD lines (MSD53 and MSD308) had later heading dates than N61 and the three check cultivars under both control and drought conditions for two years (Supplemental Tables 1, 2).
Table 2.
Means and ranges of traits for the investigated genotypes and the backcross parent of the MSD lines, Norin 61 (N61), under two contrasting water regimes for two years
|
Well-watered 2019 |
|
Drought 2019 |
|
Well-watered 2020 |
|
Drought 2020 |
| Range |
Mean |
N61 |
Range |
Mean |
N61 |
Range |
Mean |
N61 |
Range |
Mean |
N61 |
| DH |
80.0–97.0 |
84.6 |
82.0 |
|
80.0–97.0 |
84.6 |
82.0 |
|
117.6–137.7 |
122.6 |
119.6 |
|
116.0–138.0 |
122.6 |
119.6 |
| SPAD |
34.0–50.0 |
42.3 |
42.8 |
|
16.8–25.6 |
21.2 |
21.4 |
|
37.1–54.7 |
45.9 |
47.6 |
|
31.0–52.2 |
40.2 |
39.9 |
| PH |
70.0–130.0 |
95.4 |
87.3 |
|
66.0–122.0 |
88.9 |
83.0 |
|
60.0–120.0 |
84.4 |
83.3 |
|
58.0–112.0 |
80.7 |
74.0 |
| GY |
93.6–181.2 |
126.7 |
124.8 |
|
78.0–160.8 |
113.6 |
111.0 |
|
249.0–1038.0 |
516.3 |
668.6 |
|
35.6–626.4 |
290.7 |
340.2 |
| BIO |
480.0–1740.0 |
1114.2 |
1200.0 |
|
240.0–1140.0 |
767.1 |
780.0 |
|
504.0–2346.0 |
1062.4 |
1256.0 |
|
336.0–1422.0 |
654.8 |
682.0 |
| SN |
150.0–420.0 |
275.9 |
328.0 |
|
78.0–324.0 |
221.7 |
256.0 |
|
156.0–474.0 |
283.3 |
348.0 |
|
120.0–342.0 |
202.5 |
260.0 |
| GPS |
39.5–58.1 |
46.6 |
50.1 |
|
37.0–52.5 |
45.49 |
49.3 |
|
32.1–59.4 |
42.2 |
48.5 |
|
28.3–50.5 |
39.1 |
40.7 |
| TGW |
39.1–53.8 |
45.3 |
41.5 |
|
37.4–48.4 |
41.7 |
37.4 |
|
34.7–53.6 |
43.0 |
39.4 |
|
3.4–44.1 |
36.6 |
32.4 |
| HI |
0.06–0.21 |
0.1 |
0.1 |
|
0.09–0.38 |
0.2 |
0.2 |
|
0.40–0.62 |
0.5 |
0.5 |
|
0.05–0.50 |
0.4 |
0.5 |
DH, days to 50% heading; SPAD, chlorophyll content; PH, plant height; GY, grain yield; BIO, biomass; HI, harvest index; SN, number of spikes m–2; GPS, grain number per spike; TGW, thousand-grain weight.
Table 3.
Mean sum of squares for evaluated traits under two contrasting water regimes for two years
| Trait |
2019 |
|
2020 |
h2 well-watered |
h2 drought |
| G |
E |
G×E |
Residual |
Total |
CV (%) |
G |
E |
G×E |
Residual |
Total |
CV (%) |
| DH |
135.7*** |
0.0 |
0.0 |
0.0 |
21.9 |
0.1 |
|
130.8*** |
0.0 |
0.0 |
3.3 |
25.4 |
1.5 |
0.84 |
0.84 |
| SPAD |
27.9*** |
18757.9*** |
16.3*** |
0.8 |
120.0 |
2.8 |
|
39.8* |
1401.8*** |
11.1*** |
9.3 |
23.2 |
7.1 |
0.14 |
0.14 |
| PH |
975.3*** |
1761.5*** |
16.4 |
12.8 |
180.1 |
3.9 |
|
648.6*** |
575.7** |
49.5 |
65.6 |
160.8 |
9.8 |
0.83 |
0.81 |
| GY |
847.8*** |
7227.3*** |
205.0* |
112.0 |
291.2 |
8.8 |
|
49632.0*** |
2136793.0*** |
10465.0 |
8389.0 |
31781.0 |
22.7 |
0.00 |
0.19 |
| BIO |
203375.0*** |
5061343.0*** |
28010.0 |
28001.0 |
88526.0 |
17.8 |
|
281263.0*** |
6977052.0*** |
48669.0 |
37076.0 |
137849.0 |
22.4 |
0.16 |
0.20 |
| SN |
11481.0*** |
123446.0*** |
1148.0 |
1522.0 |
3846.0 |
15.7 |
|
10728.0*** |
274106.0*** |
1740.0*** |
2163.0 |
5635.0 |
19.1 |
0.57 |
0.21 |
| GPS |
99.3* |
53.2 |
19.9 |
14.8 |
30.2 |
8.4 |
|
78.7*** |
399.7*** |
13.5 |
17.7 |
31.5 |
10.4 |
0.48 |
0.67 |
| TGW |
50.6*** |
537.0*** |
5.1** |
2.5 |
14.0 |
3.7 |
|
92.4*** |
1719.6*** |
11.7 |
8.0 |
32.8 |
7.1 |
0.92 |
0.91 |
| HI |
0.003*** |
0.06*** |
0.0007 |
0.0007 |
0.001 |
20.3 |
|
0.004*** |
0.08*** |
0.0 |
0.0 |
0.0 |
8.6 |
0.00 |
0.35 |
| df |
110 |
27 |
1 |
27 |
167 |
|
|
110 |
27 |
1 |
27 |
167 |
|
|
|
*, **, and ***, represent F-probability values less than 0.05, 0.01, and 0.001, respectively. DH, days to 50% heading; SPAD, chlorophyll content; PH, plant height; GY, grain yield; BIO, biomass; SN, number of spikes m–2; GPS, grain number per spike; TGW, thousand-grain weight; HI, harvest index; df, degrees of freedom. G, genotypic main effect; E, water regime main effect; G×E, genotype by water regime interaction effect; h2, broad sense heritability; CV, coefficient of variation.
Principal component analysis (PCA) revealed differences in trait contribution, with GY and BIO, having the strongest contribution to the PCs under drought condition (Fig. 2A). The first component (Dim 1) explained 35.7%, while the second component (Dim 2) explained 21.9% of the variability. Three high-yielding MSD lines were separated from other genotypes: MSD53 was close to MSD308, while MSD140 was close to the check cultivars ‘Imam’ and ‘Cham6’. MSD140 has two sister lines that are relatively sensitive to drought stress. These two sister lines (MNH2 and MSD376) were separated from MSD140 on the PCA biplot (Fig. 2B).
High heritability values (above 47%) were observed for DH, PH, GPS, and TGW in both water regimes. Other traits showed medium to low heritability values (below 35%) in both water regimes, except SN (57%) under well-watered conditions (Table 3).
GY significantly correlated (P < 0.05) with most of the evaluated traits under both water regimes for two years (Table 4). Significant correlations were also found among other traits. Worthy of note is the positive correlation between BIO and SN (0.813), and BIO and GPS (0.623), and the negative correlations between HI and BIO (–0.869), and HI and SN (–0.855) under well-watered conditions in 2019 (Table 4). Similar trends were found under drought conditions in 2019, and in both water regimes in 2020 (Table 4). Additionally, positive correlations between different water regimes were recorded for most traits.
Table 4.
Correlation coefficients of the evaluated traits in 2019 and 2020
|
2019 |
|
2020 |
| DH |
SPAD |
PH |
GY |
BIO |
SN |
GPS |
TGW |
HI |
DH |
SPAD |
PH |
GY |
BIO |
SN |
GPS |
TGW |
HI |
| DH |
1.00** |
–0.12 |
–0.11 |
–0.03 |
0.03 |
–0.24* |
–0.39 |
–0.03 |
0.04 |
|
1.00** |
–0.17 |
0.27* |
0.51** |
0.58** |
0.31** |
0.33** |
0.18 |
–0.39** |
| SPAD |
–0.07 |
0.30** |
–0.40** |
0.05 |
0.01 |
0.19 |
–0.06 |
0.20 |
0.02 |
|
–0.08 |
0.39** |
–0.08 |
0.13 |
0.07 |
0.13 |
0.04 |
0.15 |
0.17 |
| PH |
–0.22* |
–0.06 |
0.93** |
0.42** |
0.48** |
0.16 |
0.47* |
0.16 |
–0.35** |
|
0.09 |
–0.27* |
0.61** |
0.24* |
0.35** |
0.13 |
0.26* |
0.06 |
–0.55** |
| GY |
0.24* |
–0.01 |
0.23* |
0.52** |
0.54** |
0.27* |
0.78** |
0.54** |
–0.10 |
|
0.63** |
0.09 |
0.06 |
0.65** |
0.97** |
0.91** |
0.59** |
–0.01 |
–0.17 |
| BIO |
–0.13 |
–0.14 |
0.47** |
0.53** |
0.57** |
0.81** |
0.62** |
0.13 |
–0.84** |
|
0.66** |
0.01 |
0.14 |
0.93** |
0.73** |
0.87** |
0.54** |
0.03 |
–0.38** |
| SN |
–0.29** |
–0.16 |
0.23* |
0.26* |
0.87** |
0.56** |
0.41* |
–0.11 |
–0.81** |
|
0.44** |
0.19 |
–0.06 |
0.79** |
0.83** |
0.56** |
0.35** |
–0.22* |
–0.12 |
| GPS |
0.33** |
0.23* |
–0.28* |
0.04 |
–0.69** |
0.42* |
0.67** |
–0.06 |
–0.37 |
|
0.34** |
–0.001 |
0.16 |
0.46** |
0.45** |
0.18 |
0.44** |
–0.34** |
0.01 |
| TGW |
0.23* |
0.06 |
0.15 |
0.33** |
–0.08 |
–0.34** |
–0.34 |
0.70** |
0.14 |
|
0.19 |
–0.04 |
0.06 |
0.36** |
0.18 |
–0.05 |
–0.25* |
0.60** |
–0.10 |
| HI |
0.23* |
0.12 |
–0.42** |
–0.19 |
–0.87** |
–0.86** |
–0.38 |
0.21 |
0.42** |
|
–0.01 |
0.24* |
–0.21 |
0.29** |
–0.08 |
0.01 |
0.05 |
0.52** |
0.18 |
*, **, significant at the 0.05 and 0.01 levels, respectively (2-tailed). DH, days to 50% heading; SPAD, chlorophyll content; PH, plant height; GY, grain yield; BIO, biomass; HI, harvest index; SN, number of spikes m–2; GPS, grain number per spike; TGW, thousand-grain weight. The bold numbers arranged diagonally represent individual trait correlations between water regimes. The diagonal separates the two water regimes: well-watered (left to right) and drought conditions (top to bottom).
To select drought-resilient candidates among the wheat MSD lines, stress tolerance index (STI) and mean productivity (MP) were calculated. There was variability in STI among the evaluated genotypes with some MSD lines showing higher STI than N61 and ‘Imam’. Specifically, MNH5, MSD140, and MSD308 exhibited higher STIs compared with N61 and ‘Imam’ for two years (Fig. 3A, 3B). Similarly, MSD308 consistently showed higher MP than N61 and ‘Imam’ for two years (but non-significantly higher than N61 in 2020), while MSD53 showed higher MP than N61 and ‘Imam’ in 2020 (Fig. 3C, 3D).
Graphical genotyping
The results indicated that MNH5, MSD53, MSD140, and MSD308 had better drought resilience than N61 and the three check cultivars, including ‘Imam’. Therefore, to identify the genomic regions that may be associated with drought adaptation in the selected MSD lines, we conducted graphical genotyping by comparing their genomes with those of their donor (synthetic) and backcross (N61) parents. The results showed that the MSD lines were different from their parents in several genomic regions; various recombinant portions (introgressed segments) were found in most of the 21 chromosomes (Fig. 4). Worthy of note, MNH5 and MSD308 showed similar introgressed segments on chromosome 1A. All four drought-resilient lines possessed similar introgressed segments on chromosome 6B which were not found in two drought-sensitive lines (MNH2 and MSD376) (Fig. 4). Also, MNH5, MSD53, and MSD140 showed similar introgressed segments on chromosome 4B. Interestingly, the drought-resilient MSD53 and MSD140 and the drought-sensitive MNH2 and MSD376 were developed from the same Ae. tauschii accession (Table 1). Since these lines could be considered as sister lines, their genomes were graphically compared (Fig. 4). Similarly, MSD53 and MSD140 contained similar introgressed segments on chromosome 2D and 3D (Fig. 4). These segments were not found in the drought-sensitive lines (MNH2 and MSD376). MNH5 and MSD308 also possessed large introgressed segments on chromosome 2D and 3D. Taken together, the drought-resilient MSD lines possessed similar introgressed segments on chromosome 6B, 4B (except MSD308), 2D, and 3D (except MNH5) (Fig. 4).

Discussion
One way to ensure sustainable wheat production under the current climate change scenario is to develop drought-resilient wheat genotypes that can adapt to more than one abiotic stress. Drought resilience is a quantitative trait controlled by many quantitative trait loci (QTL) and thus, it is difficult to use marker-assisted selection techniques for drought resilience breeding. Therefore, a first step in breeding drought-resilient wheat lines may be to broaden the wheat gene pool using wild introgressions. In the present study, the investigated MSD lines were developed from wild (Ae. tauschii) introgressions, and had been previously selected as heat (Elbashir et al. 2017a) and salinity-tolerant candidates (Table 1).
The significant genotypic differences (P < 0.001) observed for the investigated traits (Table 3) indicated high genetic diversity among the MSD lines. This diversity is mainly due to the introgressions from the individual Ae. tauschii accessions and may, therefore, be useful for further breeding for drought-resilient wheat lines. Significant differences due to water regime were observed in all evaluated traits except DH. These differences may have resulted from the profound effect of drought on yield and yield components (Fischer and Maurer 1978). The non-significant effect of water regime on DH was expected since the drought stress was imposed after heading. The significant G×E interaction effects on SPAD, yield and yield components for two years reflect the variation in drought adaptation among the investigated genotypes.
The high heritability estimates for most of the investigated traits for two years point to a possible effect of genes or major QTL on these traits. Low heritability estimates are often reported for yield and yield components under drought conditions (Eid 2009, Yaqoob 2016). Moreover, heritability values are subject to specific sets of genotypes and target environments (Mwadzingeni et al. 2017). Therefore, the heritability estimates in this study may have been influenced by the small population size and the amount of genetic variance present in the investigated lines. Overall, the heritability estimates indicated that these traits are highly influenced by genetic factors and may be useful for cultivar development. Also, there were high correlations between most of the evaluated traits, suggesting a strong inherent association among these traits at the genetic level. Highly heritable traits exhibiting strong correlations with other quantitative traits improve selection efficiency (Mwadzingeni et al. 2017, Shimelis and Shiringani 2010). Furthermore, the positive and highly significant correlations between traits under different water regimes (Table 4) suggest that these traits were consistent in both conditions. Similar correlations have been reported in bread wheat under different drought intensities in Morocco (Bennani et al. 2017).
The high STI exhibited by three MSD lines (MNH5, MSD308, and MSD140) suggests better adaptation of the MSD lines to post-anthesis drought stress compared with practical cultivars, N61 and ‘Imam’ (Fig. 3A, 3B). This points to the potential of the MSD lines in outperforming popular elite cultivars including ‘Imam’ which is widely cultivated in stress-prone areas in Sudan. STI is a reliable selection criterion that has been used for selecting drought-resilient wheat (Bennani et al. 2017) and rice genotypes (Mau et al. 2019). Similarly, some MSD lines showed higher MP compared with N61 and ‘Imam’, reflecting the higher productivity of the MSD lines in both water regimes (Fig. 3C, 3D). These MSD lines present an opportunity to develop new cultivars with high yield under well-watered and marginal rainfall-growing regions. Based on STI and MP for two years, MSD308 was the best performing, and therefore, selected alongside MNH5, MSD53, and MSD140 (Fig. 3) for further breeding for drought resilience. These MSD lines (except MNH5) were separated from other lines in the PCA (Fig. 2B), suggesting unique drought resilience traits which may be due to similar effects of Ae. tauschii gene introgression. Additionally, MSD53 was recently found to have an efficient water conservation capacity under dry down conditions (Itam et al., unpublished).
Genotyping with polymorphic markers ensured that the variation in each MSD line was due to introgressed segments from its synthetic parent (containing Ae. tauschii genome). The presence of such introgressed segments indicates the effectiveness of the multiple synthetic approach for utilizing the variation in Ae. tauschii for wheat breeding (Cox et al. 2017, Tsujimoto et al. 2015). These acquired genomic segments are likely the source of variation in drought resilience traits among the MSD lines and between the MSD lines and N61. For example, chromosome 1A harbors many plant height-regulating genes, including Rht-B1 and Rht-D1 (Daba et al. 2020, Zanke et al. 2014). Plant height is strongly associated with yield and yield-related traits and has been a major target for selection for high yield in wheat (Rebetzke et al. 2011). This suggests that the introgressed chromosome 1A segments in MNH5 and MSD308 may have yield-related functions. Similarly, chromosomes 4B and 6B introgressions may have drought-resilience functions. Chromosome 4BS harbors the QTL qDSI.4B.1 which is associated with drought susceptibility index, GY, HI, and root biomass in bread wheat under drought stress (Kadam et al. 2012), whereas chromosome 6B harbors the QTL QYld.aww-6B.1 which is associated with increased GY, leaf biomass, and chlorophyll index under combined drought and heat stress (Schmidt et al. 2020). The introgressions in the A and B subgenomes are likely from durum wheat (‘Langdon’) which is the source of the A and B subgenomes in the synthetic parents (Table 1, Fig. 4). This reflects the presence of important durum wheat genes in the MSD lines for bread wheat improvement. Furthermore, three drought-resilient lines (MSD53, MSD308, and MSD140) contained introgressed segments on chromosome 2D. Chromosome 2D bears the photoperiod sensitivity gene, Ppd-D1 (Hanocq et al. 2004) which is associated with multiple traits including HI, spike length and chlorophyll content under drought conditions (Dodig et al. 2012), and canopy temperature at grain filling under optimal conditions (Sukumaran et al. 2014). Similarly, chromosome 3D is associated with chlorophyll and carotenoid properties and increased GY under drought stress (Czyczyło-Mysza et al. 2011). Furthermore, since the synthetic parents were developed with 43 different accessions of Ae. tauschii, the presence of similar introgressed segments among unrelated drought-resilient MSD lines is interesting; the introgressed segments on chromosome 2D were not present in the drought-sensitive sister lines of the same synthetic parent, emphasizing their (2D donations) possible role in drought adaptation and the potential for utilization in drought resilience breeding. Further investigations are needed to better understand the genetic contributions of the introgressed segments to drought resilience in wheat.
In this study, the screening of the MSD lines under a drought-rewatering-drought cycle ensured that selected lines are able to not only survive the erratic rainfall pattern common in natural field conditions, but to maintain high yield under prolonged drought spells nearing wilting point. Under the test environment, high heritability values were obtained for some of the evaluated traits indicating that selection based on such traits can result in genetic gain for drought resilience. Since the investigated lines had been evaluated under separate heat (Elbashir et al. 2017a) and salinity stresses, they are a useful genetic resource for further breeding for climate-resilient wheat that may thrive under different abiotic stresses. At present, graphical genotyping has shown interesting introgressed segments in the drought-resilient MSD lines. For effective breeding using these genotypes, further exploration of their genetic variability using QTL analysis is recommended.
Author Contribution Statement
H.T., Y.G. and I.T. conceived the project, H.T. provided materials and acquired funding, M.I. and Y.G. performed experiments, M.I. analyzed the data, prepared figures, and wrote a draft of the manuscript, H.T., Y.G. and I.T. reviewed and edited the manuscript, H.T. supervised the study. All authors agreed to the published version of the manuscript.
Acknowledgments
This study was partly funded by Science and Technology Research Partnership for Sustainable Development (SATREPS, JPMJSA1805) by JST, Kakenhi (18H02179), and the Marginal Region Agriculture Project of Tottori University.
Literature Cited
- Abhinandan, K., L. Skori, M. Stanic, N.M.N. Hickerson, M. Jamshed and M.A. Samuel (2018) Abiotic stress signaling in wheat—an inclusive overview of hormonal interactions during abiotic stress responses in wheat. Front. Plant Sci. 9: 734.
- Bennani, S., N. Nsarellah, M. Jlibene, W. Tadesse, A. Birouk and H. Ouabbou (2017) Efficiency of drought tolerance indices under different stress severities for bread wheat selection. Aust. J. Crop Sci. 11: 395–405.
- Cox, T.S., J. Wu, S. Wang, J. Cai, Q. Zhong and B. Fu (2017) Comparing two approaches for introgression of germplasm from Aegilops tauschii into common wheat. Crop J. 5: 355–362.
- Czyczyło-Mysza, I., I. Marcińska, E. Skrzypek, M. Chrupek, S. Grzesiak, T. Hura, S. Stojałowski, B. Myśków, P. Milczarski and S. Quarrie (2011) Mapping QTLs for yield components and chlorophyll a fluorescence parameters in wheat under three levels of water availability. Plant Genet. Resour. 9: 291–295.
- Daba, S.D., P. Tyagi, G. Brown-Guedira and M. Mohammadi (2020) Genome-wide association study in historical and contemporary U.S. winter wheats identifies height-reducing loci. Crop J. 8: 243–251.
- Dodig, D., M. Zoric, B. Kobiljski, J. Savic, V. Kandic, S. Quarrie and J. Barnes (2012) Genetic and association mapping study of wheat agronomic traits under contrasting water regimes. Int. J. Mol. Sci. 13: 6167–6188.
- Eid, M.H. (2009) Estimation of heritability and genetic advance of yield traits in wheat (Triticum aestivum L.) under drought condition. Int. J. Genet. Mol. Biol. 1: 115–120.
- Elbashir, A.A.E., Y.S.A. Gorafi, I.S.A. Tahir, A.M.A. Elhashimi, M.G.A. Abdalla and H. Tsujimoto (2017a) Genetic variation in heat tolerance-related traits in a population of wheat multiple synthetic derivatives. Breed. Sci. 67: 483–492.
- Elbashir, A.A.E., Y.S.A. Gorafi, I.S.A. Tahir, J.S. Kim and H. Tsujimoto (2017b) Wheat multiple synthetic derivatives: a new source for heat stress tolerance adaptive traits. Breed. Sci. 67: 248–256.
- Elliott, J., D. Deryng, C. Müller, K. Frieler, M. Konzmann, D. Gerten, M. Glotter, M. Flörke, Y. Wada, N. Best et al. (2014) Constraints and potentials of future irrigation water availability on agricultural production under climate change. Proc. Natl. Acad. Sci. USA 111: 3239–3244.
- Fernandez, G.C.J. (1992) Effective selection criteria for assessing plant stress tolerance. In: Kuo, C.G. (ed.) Adaptation of food crops to temperature and water stress. AVRDC, Taipei, pp. 257–270.
- Fischer, R.A. and R. Maurer (1978) Drought resistance in spring wheat cultivars. I. Grain yield responses. Aust. J. Agric. Res. 29: 897–912.
- GCARD (2012) Breakout session P1.1 National Food Security—The Wheat Initiative—an International Research Initiative for Wheat Improvement. Uruguay.
- Gorafi, Y.S.A., J.S. Kim, A.A.E. Elbashir and H. Tsujimoto (2018) A population of wheat multiple synthetic derivatives: an effective platform to explore, harness and utilize genetic diversity of Aegilops tauschii for wheat improvement. Theor. Appl. Genet. 131: 1615–1626.
- Hanocq, E., M. Niarquin, E. Heumez, M. Rousset and J. Le Gouis (2004) Detection and mapping of QTL for earliness components in a bread wheat recombinant inbred lines population. Theor. Appl. Genet. 110: 106–115.
- Kadam, S., K. Singh, S. Shukla, S. Goel, P. Vikram, V. Pawar, K. Gaikwad, R. Khanna-Chopra and N. Singh (2012) Genomic associations for drought tolerance on the short arm of wheat chromosome 4B. Funct. Integr. Genomics 12: 447–464.
- Kishii, M. (2019) An update of recent use of Aegilops species in wheat breeding. Front. Plant Sci. 10: 585.
- Lê, S., J. Josse and F. Husson (2008) FactoMineR: An R package for multivariate analysis. J. Stat. Softw. 25: 1–18.
- Mau, Y.S., A.S.S. Ndiwa, S.S. Oematan and J.E.R. Markus (2019) Drought tolerance indices for selection of drought tolerant, high yielding upland rice genotypes. Aust. J. Crop Sci. 13: 170–178.
- Mwadzingeni, L., H. Shimelis and T.J. Tsilo (2017) Variance components and heritability of yield and yield components of wheat under drought-stressed and non-stressed conditions. Aust. J. Crop Sci. 11: 1425–1430.
- Ogbonnaya, F.C., O. Abdalla, A. Mujeeb-Kazi, A.G. Kazi, S.S. Xu, N. Gosman, E.S. Lagudah, D. Bonnett, M.E. Sorrells and H. Tsujimoto (2013) Synthetic hexaploids: harnessing species of the primary gene pool for wheat improvement. Plant Breed. Rev. 37: 35–122.
- Rebetzke, G.J., M.H. Ellis, D.G. Bonnett, A.G. Condon, D. Falk and R.A. Richards (2011) The Rht13 dwarfing gene reduces peduncle length and plant height to increase grain number and yield of wheat. F. Crop Res. 124: 323–331.
- Rosielle, A.A. and J. Hamblin (1981) Theoretical aspects of selection for yield in stress and non‐stress environment. Crop Sci. 21: 943–946.
- Saghai-Maroof, M.A., K.M. Soliman, R.A. Jorgensen and R.W. Allard (1984) Ribosomal DNA spacer-length polymorphisms in barley: mendelian inheritance, chromosomal location, and population dynamics. Proc. Natl. Acad. Sci. USA 81: 8014–8018.
- Sansaloni, C., C. Petroli, D. Jaccoud, J. Carling, F. Detering, D. Grattapaglia and A. Kilian (2011) Diversity Arrays Technology (DArT) and next-generation sequencing combined: genome-wide, high throughput, highly informative genotyping for molecular breeding of Eucalyptus. BMC Proc. 5: 54.
- Schmidt, J., M. Garcia, C. Brien, P. Kalambettu, T. Garnett, D. Fleury and P.J. Tricker (2020) Transcripts of wheat at a target locus on chromosome 6B associated with increased yield, leaf mass and chlorophyll index under combined drought and heat stress. PLoS ONE 15: 1–24.
- Shimelis, H. and R. Shiringani (2010) Variance components and heritabilities of yield and agronomic traits among cowpea genotypes. Euphytica 176: 383–389.
- Sukumaran, S., S. Dreisigacker, M. Lopes, P. Chavez and M.P. Reynolds (2014) Genome-wide association study for grain yield and related traits in an elite spring wheat population grown in temperate irrigated environments. Theor. Appl. Genet. 128: 353–363.
- Tounsi, S., K. Feki and F. Brini (2019) Abiotic stress signaling in wheat crop. In: Hasanuzzaman, M., K. Nahar and M. Hossain (eds.) Wheat production in changing environments. Springer, Singapore, pp. 261–282.
- Tsujimoto, H., Q. Sohail and Y. Matsuoka (2015) Broadening the genetic diversity of common and durum wheat for abiotic stress tolerance breeding. In: Advances in wheat genetics: from genome to field. Springer Japan, Tokyo, pp. 233–238.
- Yaqoob, M. (2016) Estimation of genetic variability, heritability and genetic advance for yield and yield related. J. Agric. Res. 54: 1–14.
- Zanke, C.D., J. Ling, J. Plieske, S. Kollers, E. Ebmeyer, V. Korzun, O. Argillier, G. Stiewe, M. Hinze, K. Neumann et al. (2014) Whole genome association mapping of plant height in winter wheat (Triticum aestivum L.). PLoS ONE 9: e113287.


