Abstract
In the absence of pathogen attack, lesion mimic mutants (LMMs) in plants undergo spontaneous cell death and develop necrosis or apoptosis-like lesions on the leaves or sheath, resembling symptoms of hypersensitive response. In-depth research has been conducted on LMMs, especially regarding the molecular mechanisms underlying programmed cell death and disease resistance. In this study, the spotted leaf 36 (spl36) mutant was identified as a typical LMM, showing lesions on both the leaf blade and leaf sheath. The formation of lesions was found to be caused by cell death accompanied by accumulation of hydrogen peroxide and degradation of chloroplasts. Compared with wild-type, the main agronomic traits such as plant height, effective panicle number, panicle length, grain per panicle, seed setting rate, and 1000-grain weight of spl36 were significantly reduced. The defence and pathogenesis-related genes PR1a, PR1b, PR10, and NPR1, were transcriptionally activated in mutant spl36 without pathogen attack. Genetic analysis showed that the mutant phenotype was controlled by the gene SPL36, which was mapped to an interval of 260 kb at the end of the long arm on chromosome 11. Pathogen inoculation analysis showed that spl36 has enhanced resistance to sheath blight, rice blast, and bacterial blight.
Introduction
In the absence of pathogen attack, lesion mimic mutants (LMMs) in plants undergo spontaneous cell death and develop necrosis or apoptosis-like lesions on the leaves or sheath, resembling symptoms of hypersensitive response (HR) (Xu et al. 2018). HR is a typical disease-resistance response characterized by the rapid cell death at the infected site due to an incompatible interaction between plants and pathogens, and is one of the important manifestations of programmed cell death (PCD) (Xiao et al. 2018).
LMMs have been identified in a variety of plants including Arabidopsis thaliana (Igari et al. 2008), rice (Hurni et al. 2015), barley (Persson et al. 2009), and wheat (Sugie et al. 2007). A large number of LMMs have been reported since the first identification of spotted leaf (spl) in rice by Japanese scholars (Kiyosawa 1970). To date, more than 90 mutants have been identified in rice (http://www.gramene.org/). The mechanisms underlying the formation of LMMs are very complicated and the corresponding genes are related to different biological mechanisms in plants. Mutations of disease resistance genes can result in the production of lesion mimics on leaves such as NLS1 (Tang et al. 2011), OsAT1 (Mori et al. 2007), OsNH1 (Chern et al. 2005), OsABA2 (Liao et al. 2018), and OsPti1a (Takahashi et al. 2007). Besides, variable other gene families that mediating metabolic pathways (Sun et al. 2011, Wang et al. 2015a), accumulation of reactive oxygen species (ROS) and hormones (Weymann et al. 1995), programmed cell death (Fekih et al. 2015, Jin et al. 2015, Lin et al. 2012) and heat shock proteins (Qiao et al. 2010). Among the LMMs identified in rice, most have reported to participated in defence response to fungal pathogen Magnaporthe oryzae (M. oryzae) or/and Rhizoctonia solani (Rs), or/and bacterial pathogen Xanthomonas oryzae pv. Oryzae (Xoo) in rice. The activation of pathogenesis-related (PR) genes characterize the activation of a successful plant defence response, meanwhile callus and phytohormones play vital roles in defence response.
The biosynthesis and decomposition of callosin help plants resist biotic and abiotic stresses, whereas salicylic acid transmits signals in the defence response of plants. Some LMMs show accumulation of callose and an increase in salicylic acid, which can promote the expression of PR genes to enhance disease resistance (Campbell and Ronald 2005). The expression of PR1 and probenazole-inducible protein is significantly increased in the mutants HM47 (Feng 2015), spl11 (Zeng et al. 2004), and spl18 (Mori et al. 2007). HM47 and spl11 showed enhanced resistance to M. oryzae l and Xoo compared with the wild type, and the resistance to M. oryzae is enhanced in spl18 as well. The identification, cloning, and functional research of rice LMMs are of great theoretical significance for exploring rice disease resistance and stress defence systems, as well as improving broad-spectrum disease resistance breeding in rice.
In this study, we identified a novel LMM spotted leaf 36 (spl36) in rice from the ethyl methanesulfonic (EMS)-induced mutation library of Jinhui 10 (wild-type [WT]), the indica rice restorer line. The phenotype of spl36 was characterized in detail and showed enhanced resistance to both fungal and bacterial pathogens in rice. A genetic study showed that spl36 was controlled by a dominant nuclear gene and was finely mapped to an interval of 260 kb on the long arm of chromosome 11. Here, we identified a novel LMM, and mutation of the target gene SPL36 caused enhanced resistance to three different pathogens, indicating its enhanced resistance to the defence response and potential use in rice breeding.
Materials and Methods
Materials
The stably inherited mutation spl36 was derived from Jinhui10 treated with EMS. Tetepu, Guandong 51, Lijiang Xintuan Heigu, Sifeng 43, Hejiang 18, Dongnong 363, and Zhenlong 13 were selected as the identification varieties of the physiological races of rice blast fungus. Identification of the seven physiological species of rice blast fungus was presented by C&E Senior Experimentalist Xiaoping Yuan from China National Rice Research Institute (Hangzhou, China). The rice blast standard samples were from Hechuan, Nanchuan, Qianjiang, Yongchuan in Chongqing, and Mianning County and Xuyong County in Sichuan Province. The pathogenic strain ZHE 173 of Xanthomonas oryzae pv. Oryzae, agent of bacterial blight, was presented by Associate Professor Yuxuan Hou from China National Rice Research Institute (Hangzhou, China). The pathogenic strain RH-9 of R. solani Kühu, agent of sheath blight, was used in this study. It was kindly gifted by Prof. Xuebiao Pan from Yangzhou University, China.
Investigation of agronomic traits
Ten well growing WT and mutant plants were randomly selected for statistical agronomic traits. Most of the agronomic traits were examined, including the effective number of panicles, primary branches, grain number per panicle, filled number per panicle, panicle length, 1000-grain weight, and seed setting rate, and the results were analyzed using the t-test.
Chloroplast autofluorescence observation
At the heading stage, the second leaves of WT and mutant spl36 were selected (the leaves of mutant were selected for LMMs) and placed in a centrifuge tube containing an embedding agent (Tissue-Tek; Sakura, Sakura City, Japan). The centrifuge tube was incubated at –20°C for 30 min and taken out when the embedding agent was completely solidified. The leaves were cut into 8 mm thick sections with a cryostat, placed on a glass slide and rinsed with ddH2O repeatedly until there was no embedding, covered with a glass slide, and observed under a fluorescence microscope.
Determination of photosynthetic pigments and photosynthetic characteristics
At the heading stage, the WT and mutant spl36 middle leaves were selected and photosynthetic pigments were determined according to Lichtenthaler’s method (Lichtenthaler 1987). On a sunny day at 9:00 AM, five plants of both Jinhui 10 and spl36 were randomly chosen and the net photosynthetic rate, stomatal conductance, intercellular CO2 concentration, and transpiration rate were measured using the LI-6400 photosynthetic apparatus.
Histochemistry analysis and measurement of physiological indexes
At the heading stage, 10 randomly selected WT and spl36 leaves of obvious phenotype and similar growth were stained with trypan blue and DAB solution according to the method of Dietrich et al. (1994) and Thordal-Christensen et al. (1997). Meanwhile, the first, second, and third leaves of the WT and spl36 mutant were collected and used to measure ROS and proline content, as well as catalase (CAT), superoxide dismutase (SOD), and peroxidase (POD) activity as previously described. The Superoxide Anion Assay Kit (A052), Proline Content Assay Kit (A107), SOD Activity Assay Kit (A001-1), CAT Assay Kit (A007-1), and POD Activity Assay Kit (A084-3) were provided by the Nanjing Jiancheng Technology Company (Nanjing, China).
Genetic analysis
The spl36 mutant was crossed with the Indica sterile line Xinong 1A to obtain F1, after which the phenotype of the F1 plants was observed and the F2 seeds were collected. The F2 population was planted and genetic analysis was performed on the F2 population. Ten plants of normal and lesion mimic phenotype were randomly selected from the F2 generation population, and DNA was extracted by the modified CTAB method to construct normal and mutant gene pool. The gene pool was amplified with 96 pairs of simple sequence repeat (SSR) primers (sequence design can be found http://ensembl.gramene.org/Oryza_sativa/Tools/Blast), which were evenly distributed on all 12 chromosomes of rice and had a polymorphism between Xinong 1A and spl36, followed by normal gene pool linkage analysis. InDel differential primers were derived from the differential sequence between the Indica rice sterile line Xinong 1A and Indica rice restorer line Jinhui 10. The primers are listed in Table 1.
Table 1.
Primer sequences
| Marker |
Forward primer sequences (5ʹ-3ʹ) |
Reverse primer sequences (5ʹ-3ʹ) |
| J1212-2 |
GAAGCAACAGCTTTGGTGGG |
GAGTTGAGGCGGCACCATAC |
| J1216-4 |
CAAGCCTCACTTGGTAACTGAGG |
CGCGCTCGATAGGATCTGG |
| J1211-1 |
GGCCCGTAATGTGTTTGTCACC |
GTGATACACAGTTGCAGCATCAAGC |
| J0602-4 |
GCAATGGTAGGGTGTGATGTCTGT |
CATGACCAAACGGCCTAACTTG |
| J1206-3 |
TTTAAGCAAACGAGGGCATATCC |
TTGTGTGGCGTTTGGCTCC |
| J0602-5 |
CATGTGAAGTGATTCTGTTTGCACT |
CAGGGTCAGGCAGTCAGGGC |
| J0102-3 |
GTGGTGGACGAGGATCAACG |
GTGGTCAGTGGTCACCATGACC |
| J1206-4 |
CGACGCGCCAGGGTAATG |
GTGCTGCGTGTTACTTTGGTGC |
| J0720-1 |
CCGACACCGTCTCCATTATCC |
GGTCCAGTGAAGTCCAAGGAGG |
RNA was extracted using a kit from Promega (Madison, WI, USA), and reverse transcription was done using a reverse transcription kit (Takara Biomedical Technology, Beijing, China). The resulting cDNA was diluted 10-fold for use. The relative expression of each gene was calculated with the 2–ΔΔCT method, and actin was selected as the internal reference gene for cDNA amplification of the related genes; there were at least three replicates for each sample. Quantitative PCR (qPCR) was mainly used for the expression analysis of some genes in the localization interval and some marker genes related to the defence response.
Resistance identification
According to the method of Huang et al. (1998), the rice blast resistance spectrum was determined one month after sowing. The rice sheath blight was inoculated using the toothpick embedding method of Pan et al. (1997). After 30 days, the rice disease stabilized and a field investigation was conducted. The disease level was determined using the previous scoring system (Zuo et al. 2006) with slight modification. The bacterial blight suspension production method was as follows. The medium was inoculated with activated bacteria, incubated at 28°C at 120 rpm/min, and cultivated for 24–48 h using McDonald’s turbidity method to prepare a 3 × 10⁸ cfu/mL bacterial solution concentration. At 21 days after inoculation, sterilized scissors were used to dip the above-mentioned bacteria floating liquid, cut off the leaf tip 1.5 cm diagonally, and treat five leaves of each plant. Then the incidence of WT and mutant bacterial blight was investigated.
Results
Phenotype analysis of spl36
At the ninth-leaf stage, spl36 began to develop lesion-like brown mimics on the lower leaf sheath extending upwards along the midrib of the leaf sheath to the leaf blade, and the phenotype continued with the development of the plant until the maturity stage (Fig. 1A, 1B). Some lesion mimics were also observed on the glumes at the heading stage, and brown mimics covered almost all the leaves and glumes (Fig. 1C–1F). Thus, the formation of lesion mimics was positively correlated with leaf age in spl36. The results of DAB staining showed brown deposits around the lesions on the leaf blades (Fig. 1G), indicating ROS accumulation in spl36. The results of trypan blue staining showed clear results for the lesions on the leaves of mutant spl36 and the surrounding area (Fig. 1H).
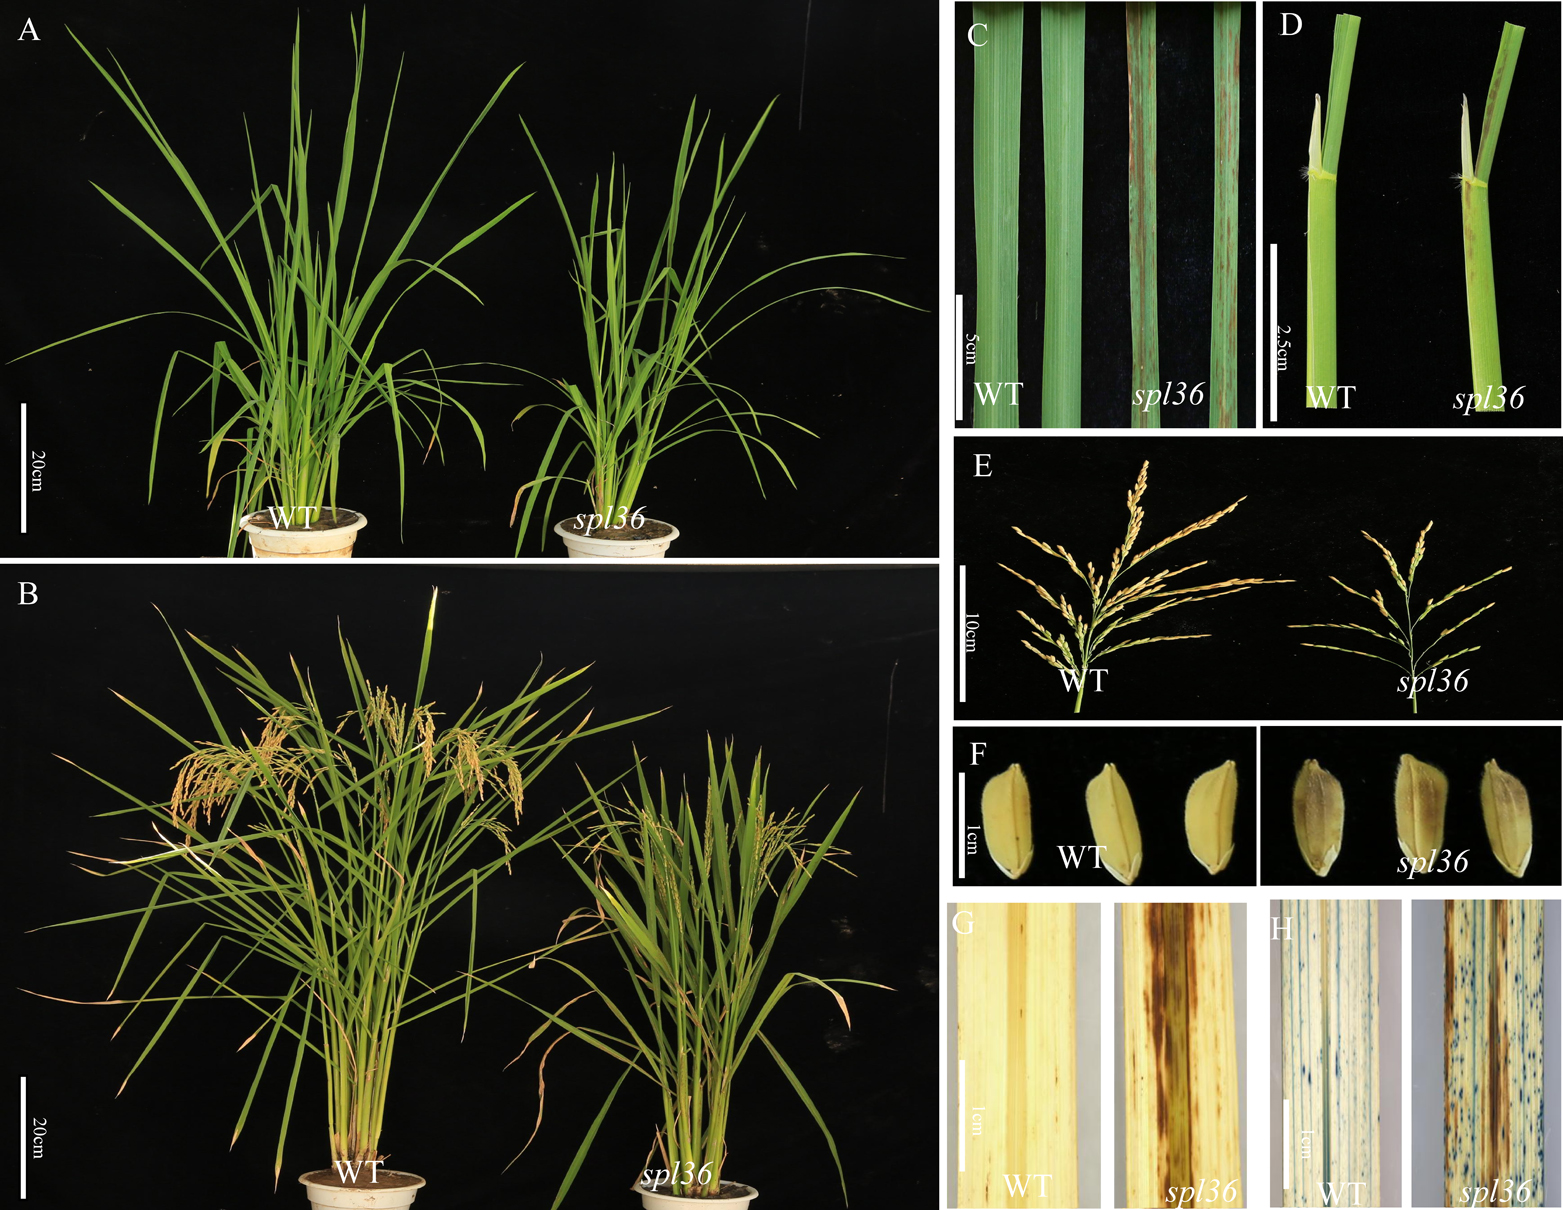
Agronomic traits of WT and mutant spl36 plants were investigated at the maturity stage (Fig. 2). Compared with WT, the plant height, effective panicle number, panicle length, seed number per panicle, seed setting rate, and thousand-grain weight of mutant spl36 were significantly reduced by 14.76%, 37.76%, 12.62%, 60.28%, 22.36%, and 12.84%, respectively. The results showed that plant growth and development were severely affected.
Observation results of chloroplast autofluorescence
In the maturity stage, the cross-section of the leaf blade in WT and spl36 plants was observed under natural light; it was green in the WT plant, whereas mutant spl36 had some brown mesophyll cells (Fig. 3A, 3B). Under the ultraviolet light, chloroplast autofluorescence showed that the red fluorescence of mutant spl36 was significantly weaker both at the parts with or without lesions compared to WT (Fig. 3C, 3D). The results showed that the mesophyll of the spl36 mutant may suffer from degradation or be destroyed with the development of lesions.
Pigment content and photosynthetic characterization
We determined and analyzed the photosynthetic pigment content and photosynthetic characteristics of the WT and mutant. The results of photosynthetic pigment content determination showed that compared with the WT, the chlorophyll a, chlorophyll b and carotenoid contents of the mutant spl36 were all reduced, and all reached extremely significant levels (Fig. 4A–4C). This indicates that mesophyll cell degradation had indeed occurred in the mutant. Analysis of photosynthetic characterization at the heading stage found that compared with the WT, the net photosynthetic rate, stomatal conductance and transpiration rate of the mutant spl36 leaves were extremely significantly reduced (Fig. 4D, 4E, 4G). At the same time, the intercellular carbon dioxide content of the first leaf blade was reduced extremely significantly, the intercellular carbon dioxide content of the remaining leaves was increased extremely significantly (Fig. 4F).
Physiology and biochemistry analyses
To further verify whether generation of the mutant phenotype was accompanied by ROS accumulation, we evaluated the ROS content and activities of antioxidant enzymes in WT and mutant spl36 at the heading stage (Fig. 5A–5C). The results show that the contents of H2O2 and O2– in the mutant were extremely significantly increased compared with WT, consistent with the results of DAB staining. Thus, the generation of lesion mimics in spl36 was accompanied by the accumulation of active oxygen, whereas the content of ˙OH was lower than that of WT, and this difference reached statistical significance. The enzyme activities of CAT, SOD, POD and other antioxidant in mutants were analyzed in the WT and spl36 (Fig. 5D–5F). The results show that CAT activity in the first, second, and third leaves was significantly lower in mutant spl36 than in WT. Meanwhile, POD activity in the first, second, and third youngest leaves was significantly reduced, with the most reduction observed in the last group. Similarly, T-SOD activity was lower in the flag, second, and third leaves in spl36 than in WT.

To determine the gene accounting for the phenotype in spl36, the F1 progeny derived from a cross between Xinong1A and the spl36 mutant showed lesion mimics on the leaves similar to those seen in spl36. The F1 plants exhibited lesions and the F1 plants were self-crossed to obtain F2 plants to conduct map-based cloning. In the population containing 2556 F2 individuals, 721 plants had normal green leaves and 1835 plants had a lesion mimic leaf trait, at a ratio of 3:1 (χ2 = 2.48 < χ20.05 = 3.84). These data indicate that the mutant phenotype is controlled by a pair of dominant nuclear genes. Therefore, we selected F2 individual plants with the WT phenotype for gene mapping. Ten normal plants from the F2 plants were selected to construct a normal gene pool. The marker J1216-4 from Chr 11 showed polymorphism, indicating that the target gene might be located on Chr 11 (Fig. 6A). To fine-map the gene, more InDel markers were designed, of which nine had a polymorphism. Using genetic linkage analysis, the target gene was further delimited to a 260 kb region between InDel markers J0102-3 and J1206-4 on the long arm of chromosome 11 (Fig. 6B).

Lesion mimics often lead to disorders in the plant defence response. To analyze whether spl36 is involved in the defence response in rice, the expression of disease-related genes was analyzed and the relative expression of defence-related genes PR1a (Agrawal et al. 2000a), PR1b (Agrawal et al. 2000b), PR10 (Kim et al. 2004), and NPR1 (Yuan et al. 2007) in WT and mutant plants was measured by qPCR. Before and after the occurrence of lesions in spl36, the expression levels of the four defence-related genes PR1a, PR1b, PR10, and NPR1 were significantly higher in the mutant than in WT (Fig. 7). In particular, after the appearance of the lesion mimics, expression of the PR genes was further significantly increased. These results show that the increased expression levels of resistance-related genes in spl36 may contribute to its enhanced resistance to pathogens.
Resistance identification
Because PR genes are activated in spl36, we further tested whether spl36 enhanced resistance to the main diseases in rice. In the rice blast spectrum test (Table 2), 59 effective strains, divided into 6 physiological populations and 19 physiological races were obtained according to varieties identified in China. The resistance frequency of mutant spl36 was 7.41%, 33.33%, and 15.71% higher in the ZB, ZE, and ZG groups, respectively, than in WT. The disease resistance frequency was 22.23% lower in the ZC group than in WT, whereas the disease resistance frequency in the ZA and ZD physiological groups was the same as that in WT. The larger difference between the ZE and ZC populations may be due to the fact that selection of ZE and ZC is caused by fewer physiological races, and the resistance frequency of the mutant to total population is 5.09% higher than in WT. The broad-spectrum resistance of the mutant to rice blast was still slightly improved (Table 3).
Table 2.
Number of effective isolates and physiological races as well as occurrence frequency in the physiological group
| No. of effective isolates |
No. of races |
Occurrence frequency of physiological race group (%) |
| ZA |
ZB |
ZC |
ZD |
ZE |
| 59 |
19 |
7.14% |
45.76% |
15.25% |
5.08% |
5.08% |
Table 3.
Resistance spectrum determination of the WT and
spl36 mutant
| Materials |
Resistance frequency to each physiological group (%) |
Resistance frequency to total population (%) |
| ZA |
ZB |
ZC |
ZD |
ZE |
ZG |
| WT |
50% |
14.81% |
66.67% |
66.67% |
33.33% |
69.23% |
40.67% |
| spl36 |
50% |
22.22% |
44.44% |
66.67% |
66.67% |
84.61% |
45.76% |
At the booting stage, inoculation of R. solani was conducted. At 30 days after R. solani inoculation, the WT leaf sheaths had all turned yellow and withered, and showed a tendency to spread upwards, whereas the mutant only produced two small water-spot mimics that were not connected (Fig. 8A). After 30 days of rice heading, the incidence of sheath blight was stable. Field investigations on the incidence of WT and mutants showed that there were more disease mimics on WT than on mutants, with statistical significance. Because the WT plant is much taller than the mutant, we further investigated the relative height of the WT and mutant lesions, and found that the relative lesion height of the WT was significantly higher than that of the mutant, indicating that the WT disease was more severe than the mutant equivalent (Fig. 8C). The disease level was significantly higher in WT than in the mutant, indicating that lesion mimics enhanced the mutant resistance to sheath blight.

At the tillering stage, the resistance to bacterial pathogen Xoo was evaluated in the WT and mutant spl36. At 21 days after the inoculation of bacterial blight, the lesion lengths of WT and mutant spl36 bacterial blight were investigated. At the inoculated leaf tips, the leaves turned yellow and withered, and bacterial blight continued to spread (Fig. 8B). The length of the lesion was significantly greater than that seen in the mutant spl36, indicating that spl36 participates in Xoo resistance in rice (Fig. 8D).
Discussion
In the absence of pathogen infection and adversity, LMMs spontaneously form lesions in leaf sheaths or leaf blades similar to those produced by pathogen infection, which is often accompanied by a growth defect and development and activation or silencing of disease resistance (Qiu et al. 2014). The ttm1 mutant (Takahashi et al. 2007) exhibits short growth, spotted leaves, and OsPti1a negatively regulates basic resistance to pathogens in rice. The leaves of OsSSI2 (Jiang et al. 2009) insertion mutation and interference plants showed spontaneous damage and slow growth. No difference in the early development stage was observed between the spl3 (Wang et al. 2015b) mutant and WT. At the late tillering stage, disease mimics gradually appeared on the older leaves and black mimics developed on the whole leaves at the heading stage with stunted growth and decreased agronomic characteristics, especially fertility and panicle length.
In this study, we identified a novel LMM spl36, which appeared in the leaf sheath of the plant at the 9-leaf stage. As the plant grew and developed, it continued to spread to the leaf blades and glumes, and no lesion mimics were observed on stems or other tissues in the spl36 mutant. Compared with WT, the plant height, effective panicle number, panicle length, seed number per panicle, seed setting rate and 1000-grain weight of the mutant spl36 were significantly reduced, showing that the mutation seriously affected the growth and development of mutant spl36 plants.
The formation of many types of lesions is accompanied by excessive ROS accumulation. The large accumulation of ROS not only destroys the cell structure, but also functions as a signal molecule to induce the activation of HR to cause PCD, which results in the production of lesion mimics on plant tissues (Matin et al. 2010). When treated with fungal inducers, the mutants spl2, spl7, and spl11 (Kojo et al. 2006) accumulate more H2O2 in the cells. In mutant cea62 (Liu et al. 2012), the accumulation of H2O2 damaged the cell membrane and caused cell death on the leaves. In our study, the results of trypan blue and DAB staining showed excessive accumulation of H2O2 and O2– in the mesophyll cells, and the activities of protective enzymes such as CAT, POD, and SOD were reduced, resulting in excessive ROS accumulation in the mutant. Together, these results suggest that the excessive ROS accumulation leads to the PCD of mesophyll cells and the formation of lesion mimics. The much weaker autofluorescence of chloroplasts, decreased photosynthetic pigment content, and reduced net photosynthetic rate, stomatal conductance, and transpiration rate in spl36 indicate that the degradation of chloroplasts and reduced photosynthesis may account for the senescence of leaf blades and the severe reduction of the main agronomic traits.
Many LMMs show diverse enhanced resistance to the corresponding pathogens in plants, due to the activation and elevated expression of defence response marker genes. In the PR family, the PR1 subfamily is often used as a marker gene for systemic resistance, of which PR1a and PR1b reportedly play a role in the abiotic stress response (Agrawal et al. 2001). PR10 induces cell death in rice, Arabidopsis, and tobacco through RNase activity inside the cell (Kim et al. 2011). NPR1 is a positive regulator of cell death in rice (Liu et al. 2017). For example, in LMM Oslsd1, expression of the defence response marker genes PR1 and PR10 was significantly increased with enhanced resistance to rice blast. The ttm1 mutant has increased expression of PR1B and PR10 also shows enhanced resistance to rice blast and bacterial blight. In this study, the expression of defence-related genes PR1a, PR1b, PR10, and NPR1 were significantly increased in spl36 with the appearance of lesion mimics on leaves, which indicates that spl36 may function in a disease-resistant signal pathway. A pathogen inoculation study found that spl36 demonstrated enhanced resistance to rice blast, sheath and bacterial blight, which confirms the participation of spl36 in the defence response.
We identified a new LMM, spl36, and fine mapped it to a 260-kb region on chromosome 11. In interval, there are 6 glycosyl hydrolase, 7 hypothetical protein, 8 expressed protein, 3 zinc finger protein, 2 thaumatin family domain containing protein, 1 SNF7 domain containing protein, 1 trp repressor/replication initiator, 1 selT/selW/selH selenoprotein domain containing protein, 1 pollen signalling protein with adenylyl cyclase activity, 1 glucan endo-1,3-beta-glucosidase precursor, 1 RNA recognition motif containing protein, 1 GRAS family transcription factor domain containing protein, 1 AAA-type ATPase family protein, 1 MYB family transcription factor and 1 alpha-hemolysin; And glycosyl hydrolase (Tokunaga et al. 2008), MYB family transcription factor (Kishi-Kaboshi et al. 2018) and zinc finger protein have been reported to play a role in the defense mechanism of rice. In addition, 4 genes have been reported. MT1A (Yang et al. 2009) encodes type 1 metallothionein. OsMT1a can directly participate in the ROS clearance pathway and change the balance of Zn2+ in the plant to regulate the expression of zinc finger structure transcription factors to improve plant stress resistance. CycD7 (La et al. 2006) is a rice cyclin gene. ZOS11-10 (Figueiredo et al. 2012) can bin to OsDREB1B promoter. DHD1 (Zhang et al. 2019) is a GRAS protein, and DHD1 is involved in the flowering pathways related to GA and ABA. The promoter, ORF, and 3ʹUTR sequence of reported genes in this range have been sequenced and no base difference was found. And glycosyl hydrolase (Tokunaga et al. 2008), MYB family transcription factor (Kishi-Kaboshi et al. 2018) and zinc finger protein have been reported to play a role in the defense mechanism of rice. We speculate that these genes may be target genes. Next, we will expand the F2 group to narrow the interval. At the same time, We will detect variant sites for wild-type and mutants to determine our target gene for future functional study. Together, we did fine mapping of a non-cloned gene that functions in the spectrum resistance response in rice, the cloning of which will be of great value to science and agriculture.
Author Contribution Statement
ChangWei Zhang conceived and designed the research. LinJun Cai, Meng Yan, Han Yun, Jia Tan, Dan Du, Hang Sun,YunXia Guo, XianChun Sang assisted in the experiments. LinJun Cai and Meng Yan analyzed the experimental data and wrote the manuscript. All authors discussed the results and commented on the manuscript.
Acknowledgments
This work was supported by grants from the project of creating high quality, disease resistance and high combining ability CMS lines (Grant No. cstc2018jscx-msybX0250) from Chongqing Technology Innovation.
Literature Cited
- Agrawal, G.K., N.S. Jwa and R. Rakwal (2000a) A novel rice (Oryza sativa L.) acidic PR1 gene highly responsive to cut, phytohormones, and protein phosphatase inhibitors. Biochem. Biophys. Res. Commun. 274: 157–165.
- Agrawal, G.K., R. Rakwal and N.S. Jwa (2000b) Rice (Oryza sativa L.) OsPR1b gene is phytohormonally regulated in close interaction with light signals. Biochem. Biophys. Res. Commun. 278: 290–298.
- Agrawal, G.K., R. Rakwal, N.S. Jwa and V.P. Agrawal (2001) Signalling molecules and blast pathogen attack activates rice OsPR1a and OsPR1b genes: A model illustrating components participating during defence/stress response. Plant Physiol. Biochem. 39: 1095–1103.
- Campbell, M.A. and P.C. Ronald (2005) Characterization of four rice mutants with alterations in the defence response pathway. Mol. Plant Pathol. 6: 11–21.
- Chern, M., H.A. Fitzgerald, P.E. Canlas, D.A. Navarre and P.C. Ronald (2005) Overexpression of a rice NPR1 homolog leads to constitutive activation of defense response and hypersensitivity to light. Mol. Plant Microbe Interact. 18: 511–520.
- Dietrich, R.A., T.P. Delaney, S.J. Uknes, E.R. Ward, J.A. Ryals and J.L. Dangl (1994) Arabidopsis mutants simulating disease resistance response. Cell 77: 565–577.
- Fekih, R., M. Tamiru, H. Kanzaki, A. Abe, K. Yoshida, E. Kanzaki, H. Saitoh, H. Takagi, S. Natsume, J.R. Undan et al. (2015) The rice (Oryza sativa L.) LESION MIMIC RESEMBLING, which encodes an AAA-type ATPase, is implicated in defense response. Mol. Genet. Genomics 290: 611–622.
- Feng, B.H. (2015) Gene Isolation and Functional Analysis of a Spotted-leaf Mutant HM47 in rice (Oryza sativa L) (in Chinese with English summary).
- Figueiredo, D.D., P.M. Barros, A.M. Cordeiro, T.S. Serra, T. Lourenço, S. Chander, M.M. Oliveira and N.J.M. Saibo (2012) Seven zinc-finger transcription factors are novel regulators of the stress responsive gene OsDREB1B. J. Exp. Bot. 63: 3643–3656.
- Huang, F., K.L. Chen, G.L. Peng, Q.M. Luo, G.H. Chen and Y.H. Zhu (1998) Standardized identification and evaluation system for rice blast resistance in Sichuan province. Journal of China Agricultural University, 1998 (S1): 23–26 (in Chinese with English summary).
- Hurni, S., D. Scheuermann, S.G. Krattinger, B. Kessel, T. Wicker, G. Herren, M.N. Fitze, J. Breen, T. Presterl, M. Ouzunova et al. (2015) The maize disease resistance gene Htn1 against northern corn leaf blight encodes a wall-associated receptor-like kinase. Proc. Natl. Acad. Sci. USA 112: 8780–8785.
- Igari, K., S. Endo, K.I. Hibara, M. Aida, H. Sakakibara, T. Kawasaki and M. Tasaka (2008) Constitutive activation of a CC-NB-LRR protein alters morphogenesis through the cytokinin pathway in Arabidopsis. Plant J. 55: 14–27.
- Jiang, C.J., M. Shimono, S. Maeda, H. Inoue, M. Mori, M. Hasegawa, S. Sugano and H. Takatsuji (2009) Suppression of the rice fatty-acid desaturase gene OsSSI2 enhances resistance to blast and leaf blight diseases in rice. Mol. Plant Microbe Interact. 22: 820–829.
- Jin, B., X.R. Zhou, B.L. Jiang, Z.M. Gu, P.H. Zhang, Q. Qian, X.F. Chen and B.J. Ma (2015) Transcriptome profiling of the spl5 mutant reveals that SPL5 has a negative role in the biosynthesis of serotonin for rice disease resistance. Rice (N Y) 8: 18.
- Kim, S.G., S.T. Kim, Y. Wang, S. Yu, I.S. Choi, Y.C. Kim, W.T. Kim, G.K. Agrawal, R. Rakwal and K.Y. Kang (2011) The RNase activity of rice probenazole-induced protein1 (PBZ1) plays a key role in cell death in plants. Mol. Cells 31: 25–31.
- Kim, S.T., S.G. Kim, D.H. Hwang, S.Y. Kang, H.J. Kim, B.H. Lee, J.J. Lee and K.Y. Kang (2004) Proteomic analysis of pathogen-responsive proteins from rice leaves induced by rice blast fungus, Magnaporthe grisea. Proteomics 4: 3569–3578.
- Kishi-Kaboshi, M., S. Seo, A. Takahashi and H. Hirochika (2018) The MAMP-responsive MYB transcription factors MYB30, MYB55, and MYB110 activate the HCAA synthesis pathway and enhance immunity in rice. Plant Cell Physiol. 59: 903–915.
- Kiyosawa, S. (1970) Inheritance of a particular sensitivity of the rice variety, Sekiguchi Asahi, to pathogens and chemicals, and linkage relationship with blast resistance genes. Bull. Natl. Inst. Agric. Sci. Tokyo 21: 61–72 (in Japanese).
- Kojo, K., T. Yaeno, K. Kusumi, H. Matsumura, S. Fujisawa, R. Terauchi and K. Iba (2006) Regulatory mechanisms of ROI generation are affected by rice spl mutations. Plant Cell Physiol. 47: 1035–1044.
- La, H., J. Li, Z. Ji, Y. Cheng, X. Li, S. Jiang, P.N. Venkatesh and S. Ramachandran (2006) Genome-wide analysis of cyclin family in rice (Oryza Sativa L.). Mol. Genet. Genomics 275: 374–386.
- Liao, Y., Q. Bai, P. Xu, T. Wu, D. Guo, Y. Peng, H. Zhang, X. Deng, X. Chen, M. Luo et al. (2018) Mutation in rice Abscisic Acid2 results in cell death, enhanced disease-resistance, altered seed dormancy and development. Front. Plant Sci. 9: 405.
- Lichtenthaler, H.K. (1987) Chlorophylls and carotenoids: pigments of photosynthetic biomembranes. Meth. Enzymol. 148: 350–382.
- Lin, A.H., Y.Q. Wang, J.Y. Tang, P. Xue, C.L. Li, L. Liu, B. Hu, F. Yang, G.J. Loake and C. Chu (2012) Nitric oxide and protein S-nitrosylation are integral to hydrogen peroxide-induced leaf cell death in rice. Plant Physiol. 158: 451–464.
- Liu, Q., Y. Ning, Y. Zhang, N. Yu, C. Zhao, X. Zhan, W. Wu, D. Chen, X. Wei, G.L. Wang et al. (2017) OsCUL3a negatively regulates cell death and immunity by degrading OsNPR1 in rice. Plant Cell 29: 345–359.
- Liu, X., F. Li, J. Tang, W. Wang, F. Zhang, G. Wang, J. Chu, C. Yan, T. Wang, C. Chu et al. (2012) activation of the jasmonic acid pathway by depletion of the hydroperoxide lyase OsHPL3 reveals crosstalk between the HPL and AOS branches of the oxylipin pathway in rice. PLoS ONE 7: e50089.
- Matin, M.N., S.A. Saief, M.M. Rahman, D.H. Lee, H. Kang, D.S. Lee and S.G. Kang (2010) Comparative phenotypic and physiological characteristics of spotted leaf 6 (spl6) and brown leaf spot2 (bl2) lesion mimic mutants (LMM) in rice. Mol. Cells 30: 533–543.
- Mori, M., C. Tomita, K. Sugimoto, M. Hasegawa, N. Hayashi, J.G. Dubouzet, H. Ochiai, H. Sekimoto, H. Hirochika and S. Kikuchi (2007) Isolation and molecular characterization of a Spotted leaf 18 mutant by modified activation-tagging in rice. Plant Mol. Biol. 63: 847–860.
- Pan, X.B., Z.X. Chen, J.Y. Xu, Y.H. Dong, Z.B. Wang and X.Y. Pan (1997) The effects of different methods of inoculation and investigation on genetic research of resistance to rice sheath blight. Journal of Yangzhou University (Agriculture and Life Sciences Edition) 18: 27–32 (in Chinese with English summary).
- Persson, M., A. Falk and C. Dixelius (2009) Studies on the mechanism of resistance to Bipolaris sorokiniana in the barley lesion mimic mutant bst1. Mol. Plant Pathol. 10: 587–598.
- Qiao, Y., W. Jiang, J.H. Lee, B.S. Park, M.S. Choi, R. Piao, M.O. Woo, J.H. Roh, L. Han, N.C. Paek et al. (2010) SPL28 encodes a clathrin-associated adaptor protein complex 1, medium subunit μ1 (AP1M1) and is responsible for spotted leaf and early senescence in rice (Oryza sativa). New Phytol. 185: 258–274.
- Qiu, J., N. Ma, H. Jiang, Z. Sheng, G. Shao, S. Tang, X. Wei and P. Hu (2014) Identification and gene mapping of a lesion mimic mutant lmm4 in rice. Chin. J. Rice Sci. 28: 367–376 (in Chinese with English summary).
- Sugie, A., K. Murai and S. Takumi (2007) Alteration of respiration capacity and transcript accumulation level of alternative oxidase genes in necrosis lines of common wheat. Jpn. J. Genet. 82: 231–239 (in Japanese with English summary).
- Sun, C., L. Liu, J. Tang, A. Lin, F. Zhang, J. Fang, G. Zhang and C. Chu (2011) RLIN1, encoding a putative coproporphyrinogen III oxidase, is involved in lesion initiation in rice. J. Genet. Genomics 38: 29–37.
- Takahashi, A., G.K. Agrawal, M. Yamazaki, K. Onosato, A. Miyao, T. Kawasaki, K. Shimamoto and H. Hirochika (2007) Rice Pti1a negatively regulates RAR1-dependent defense responses. Plant Cell 19: 2940–2951.
- Tang, J., X. Zhu, Y. Wang, L. Liu, B. Xu, F. Li and C. Chu (2011) Semi-dominant mutations in the CC-NB-LRR-type R gene, NLS1, lead to constitutive activation of defense responses in rice. Plant J. 66: 996–1007.
- Thordal-Christensen, H., Z. Zhang, Y. Wei and D.B. Collinge (1997) Subcellular localization of H2O2 in plants. H2O2 accumulation in papillae and hypersensitive response during the barley-powdery mildew interaction. Plant J. 11: 1187–1194.
- Tokunaga, T., Y. Miyata, Y. Fujikawa and M. Esaka (2008) RNAi-mediated knockdown of the XIP-type endoxylanase inhibitor gene, osxip, has no effect on grain development and germination in rice. Plant Cell Physiol. 49: 1122–1127.
- Wang, J., B. Ye, J. Yin, C. Yuan, X. Zhou, W. Li, M. He, J. Wang, W. Chen, P. Qin et al. (2015a) Characterization and fine mapping of a light-dependent leaf lesion mimic mutant 1 in rice. Plant Physiol. Biochem. 97: 44–51.
- Wang, S.H., J.Y. Lim, S.S. Kim, S.H. Cho, S.C. Yoo, H.J. Koh, Y. Sakuraba and N.C. Paek (2015b) Mutation of SPOTTED LEAF3 (SPL3) impairs abscisic acid-responsive signalling and delays leaf senescence in rice. J. Exp. Bot. 66: 7045–7059.
- Weymann, K., M. Hunt, S. Uknes, U. Neuenschwander, K. Lawton, H.Y. Steiner and J. Ryals (1995) Suppression and restoration of lesion formation in arabidopsis lsd mutants. Plant Cell 7: 2013–2022.
- Xiao, G., J. Zhou, X. Lu, R. Huang and H. Zhang (2018) Excessive UDPG resulting from the mutation of UAP1 causes programmed cell death by triggering reactive oxygen species accumulation and caspase-like activity in rice. New Phytol. 217: 332–343.
- Xu, X., Z. Chen, Y.F. Shi, H.M. Wang, Y. He, L. Shi, T. Chen, J.L. Wu and X.B. Zhang (2018) Functional inactivation of OsGCNT induces enhanced disease resistance to Xanthomonas oryzae pv. oryzae in rice. BMC Plant Biol. 18: 264.
- Yang, Z., Y. Wu, Y. Li, H.Q. Ling and C. Chu (2009) OsMT1a, a type 1 metallothionein, plays the pivotal role in zinc homeostasis and drought tolerance in rice. Plant Mol. Biol. 70: 219–229.
- Yuan, Y., S. Zhong, Q. Li, Z. Zhu, Y. Lou, L. Wang, J. Wang, M. Wang, Q. Li, D. Yang et al. (2007) Functional analysis of rice NPR1-like genes reveals that OsNPR1/NH1 is the rice orthologue conferring disease resistance with enhanced herbivore susceptibility. Plant Biotechnol. J. 5: 313–324.
- Zeng, L.R., S. Qu, A. Bordeos, C. Yang, M. Baraoidan, H. Yan, Q. Xie, B.H. Nahm, H. Leung and G.L. Wang (2004) Spotted leaf11, a negative regulator of plant cell death and defense, encodes a U-box/armadillo repeat protein endowed with E3 ubiquitin ligase activity. Plant Cell 16: 2795–2808.
- Zhang, H., S.S. Zhu, T.Z. Liu, C.M. Wang, Z.J. Cheng, X. Zhang, L.P. Chen, P.K. Sheng, M.L. Cai, C.N. Li et al. (2019) DELAYED HEADING DATE1 interacts with OsHAP5C/D, delays flowering time and enhances yield in rice. Plant Biotechnol. J. 17: 531–539.
- Zuo, S.M., Y.F. Zhang, Y.I. Yin, Z.X. Chen and X.B. Pan (2006) Establishment and inprovement of inoculation technique and rating system in researching rice sheath blight resistance in field. Journal of Yangzhou University (Agriculture and Life Sciences Edition) 27: 57–61 (in Chinese with English summary).


