Abstract
Low temperature is one of the important environmental factors that affect rice growth and yield. To better understand the japonica rice responses to cold stress, isobaric tags for a relative and absolute quantification (iTRAQ) labeling-based quantitative proteomics approach was used to detected changes in protein levels. Two-week-old seedlings of the cold tolerant rice variety Kongyu131 were treated at 8°C for 24, 48 and 72 h, then the total proteins were extracted from tissues and used for quantitative proteomics analysis. A total of 5082 proteins were detected for quantitative analysis, of which 289 proteins were significantly regulated, consisting of 169 uniquely up-regulated proteins and 125 uniquely down-regulated proteins in cold stress groups relative to the control group. Functional analysis revealed that most of the regulated proteins are involved in photosynthesis, metabolic pathway, biosynthesis of secondary metabolites and carbon metabolism. Western blot analysis showed that protein regulation was consistent with the iTRAQ data. The corresponding genes of 25 regulated proteins were used for quantitative real time PCR analysis, and the results showed that the mRNA level was not always parallel to the corresponding protein level. The importance of our study is that it provides new insights into cold stress responses in rice with respect to proteomics and provides candidate genes for cold-tolerance rice breeding.
Introduction
Rice (Oryza sativa) is one of the most important food crops in the world, feeding about half of the population (Khush 2005). Climate is an important factor affecting rice yield, especially low temperatures, which affect rice growth in tropical and subtropical areas, throughout vegetative to reproductive stages (Jin et al. 2018). Low temperature can cause severe injury in seedlings of cold-sensitive rice cultivars in the early season, and reduce growth rate and cause pollen sterility in the late season (Cui et al. 2005, Nijat et al. 2004). Low temperature stress occurs frequently and has wide-ranging influence in the world with the increase in global climate anomalies (Cen et al. 2018, Pradhan et al. 2016). Therefore, it is important to explore genes/proteins that are regulated by low temperature in order to understanding the cold-tolerance mechanism and breeding cold-tolerant rice cultivars.
An increasing number of molecular genetic studies have elucidated how rice plants respond to low temperature stress, as well as the genes/proteins involved in the response. Low temperature is first perceived by the temperature sensor COLD1/RGA1 complex on the plasma membrane, then the complex triggers calcium influx, reactive oxygen species (ROS) production, ABA accumulation and a MAPK cascade (OsMKK6-OsMPK3) leading to active downstream transcription factors responses in the nucleus (Guo et al. 2018, Ma et al. 2015, Manishankar and Kudla 2015). Recently, the vitamin E-vitamin K1 sub-network of the COLD1 downstream pathway was found to be responsible for chilling tolerance divergence (Luo et al. 2021). Other components of cold tolerance have been identified recently, such as CTB4a, which interacts with a beta subunit of ATP synthase AtpB to mediate the ATP supply in rice plant cells to improve cold tolerance (Zhang et al. 2017). The standing variation of cold tolerance gene CTB2 and de novo mutation of CTB4a facilitate cold adaptation of rice cultivation from high altitude to high latitude areas (Li et al. 2021); bZIP73Jap in japonica rice cultivars interacts with bZIP71 to modulates abscisic acid (ABA) levels and reactive oxygen species (ROS) homeostasis for enhancing rice tolerance to cold climate (Liu et al. 2018); rice OsMADS57 interacts with OsTB1 and both directly target OsWRKY94 and D14 for adaptation to cold (Chen et al. 2018). At the rice seedling stage, the cold tolerance associated gene qCTS-9 was identified in hybrid rice under different cold environments using QTL mapping and genome-wide expression profiling methods (Zhao et al. 2017). qPSST6, found from cold tolerance japonica rice variety Kongyu131with QTL mapping and Seq-BSA approach, was validated to be a functional gene relative to cold resistance (Sun et al. 2018). Three genes (LOC_Os01g55350, LOC_Os01g55510 and LOC_Os01g55560) (Zhang et al. 2018) and 67 QTLs (Wang et al. 2016), which were identified by genome-wide association analysis (GWAS), were associated with cold tolerance of indica and japonica rice, respectively. In an RNA-seq comparative analysis of cold-stressed post-meiotic anther from cold-tolerant and cold-susceptible rice cultivars, a number of ethylene-related transcription factors were found to be putative regulators of cold responses (González-Schain et al. 2019).
Proteomics is a robust approach for the large-scale identification of proteins and has been used for profiling proteins in rice (Agrawal and Rakwal 2011). Two-dimensional gel electrophoresis (2-DE) was used to separate proteins of rice treated with cold, and cold responsive proteins were identified using mass spectrometry analysis in early proteomics studies (Hashimoto and Komatsu 2007, Huo et al. 2016, Imin et al. 2006, Ji et al. 2017, Yan et al. 2006). iTRAQ is a powerful mass spectrometry technology, which can quantify proteins’ relative expression abundance by measuring relative peak areas of MS/MS mass spectra of iTRAQ-labeled peptides (Ross et al. 2004). More and more cold response proteins in rice have been monitored and characterized by the iTRAQ-labeling approach. For example, differentially expressed proteins in cold stress-treated rice that are involved in photosynthesis, metabolism, transport, ATP synthesis, ROS, stress response, DNA binding and transcription, and cell growth and integrity, as well as unknown function proteins were found using iTRAQ labeling coupled with LC-MS/MS (Cen et al. 2018, Neilson et al. 2011, Wang et al. 2018a). Although some cold stress responsive proteins were identified by the proteomic approach in different rice cultivars, only a small number of cold-response proteins have been identified so far.
In this study, to better understand the cold tolerance mechanism of japonica rice, we employed the iTRAQ labeling proteomics method to investigate the proteomic response of cold stress of the japonica cold-resistant rice cultivar Kongyu131. Rice seedling tissues were harvested after exposure to 8°C low temperature condition for 0, 24, 48 and 72 h. iTRAQ was used for quantifying relative protein abundance, and different expression proteins were obtained at each time point by comparing to the control samples. Our results report on a large number of cold stress-regulated proteins that have not been previously identified.
Materials and Methods
Plant material and cold stress treatmentsThe japonica rice variety Kongyu131, which is strongly resistant to cold weather and widely planted in the northeast area of China was used in this study. Rice seedlings were grown in the growth chamber with a 16-h light (28°C)/8-h dark (25°C) condition for 2-weeks. Cold tress treatments were performed by decreasing the temperature to 8°C, and then tissues were collected and frozen in liquid nitrogen at 0 h, 24 h, 48 h and 72 h respectively, and stored at –80°C until protein extraction. For physiology experiments, 2-week-old rice seedlings were separated into groups and treated at 8°C for 4 days, and then transferred to the normal growth temperature for 3 days. For survival rate determination, the ratio of surviving plants to total plants was calculated.
Protein extraction, digestion and iTRAQ labelingProtein extraction was performed according to previous methods (Guo and Li 2011, Qing et al. 2016, Wang et al. 2018b) with some modifications. The frozen rice seedling tissue (0.5 g) was ground to a fine powder with mortar and pestle pre-chilled at –80°C. The tissue powder was extracted with 5 volumes (g/mL) of extraction buffer containing: 8 M urea,150 mM Tris-HCl, pH 7.6, 1.2% Triton X-100, 0.5% SDS, 5 mM ascorbic acid, 20 mM EDTA, 20 mM EGTA, 5 mM DTT, 50 mM NaF, 1 mM PMSF, 1% glycerol 2-phosphate, 1× protease inhibitor (complete EDTA free; Roche) and 2% polyvinylpolypyrrolidone. The extract was centrifuged at 110,000 × g for 2 h at 10°C to remove debris at the bottom of centrifuge tube. The total protein in the supernatant was precipitated with 3 volumes of –20°C pre-cooled acetone:methanol (12:1 v/v) for at least 2 hours. The protein pellet was collected by centrifugation at 11,000 × g for 20 min and washed two times with acetone:methanol (12:1 v/v), then re-suspended in re-suspension buffer (100 mM Tris-HCl, pH 8.0, 8 M urea). The concentration of total protein was measured by the Bradford method and the proteins sample was used for proteomics and western blot analysis.
Protein samples (200 μg) were reduced by adding 10 mM DTT and incubating at 56°C for 1 h, followed by an alkylation reaction by adding 40 mM iodoacetamide and incubating at room temperature for 30 min in the dark. To digest proteins with trypsin, urea was diluted below 2 M using 100 mM Tris-HCl (pH 8.0), then trypsin was added in the protein solution at 1:50 ratio (enzyme:protein, w/w) and incubated at 37°C overnight. Peptides were acidized by adding formic acid to end the digestion, and then centrifuged at 12,000 × g for 15 min. The supernatant was subjected to peptide purification using a Sep-Pak C18 desalting column. The peptide eluate was vacuum-dried and stored at –20°C.
For iTRAQ labeling, 100 μg of the peptide samples was used. Samples were separately labeled with different iTRAQ labeling reagents (113, 114, 115, 116) according to the manufacturer’s instructions. The labeled samples were mixed and subjected to Sep-Pak C18 desalting, then the complex mixture was fractionated using high pH reverse phase chromatography, and combined into 15 fractions. Each fraction was vacuum-dried and re-suspended in 0.1% formic acid for MS analysis.
LC-MS/MS analysis, and protein quantificationLC-MS/MS detection was carried out on a hybrid quadrupole-TOF LC-MS/MS mass spectrometer (TripleTOF 5600, SCIEX) equipped with a nanospray source. Peptides were first loaded onto a C18 trap column (5 μm, 5 × 0.3 mm, Agilent Technologies) and then eluted into a C18 analytical column (75 μm × 150 mm, 3 μm particle size, 100 Å pore size, Eksigent). Mobile phase A (3% DMSO, 97% H2O, 0.1% formic acid) and mobile phase B (3% DMSO, 97% ACN, 0.1% formic acid) were used to establish a 100 min gradient comprised of: 0 min in 5% B, 65 min of 5–23% B, 20 min of 23–52% B, 1 min of 52–80% B, 80% B for 4 min, 0.1 min of 80–5% B, and a final step in 5% B for 9.9 min. A constant flow rate was set at 300 nL/min. For IDA mode analysis, each scan cycle consisted of one full-scan mass spectrum (with m/z ranging from 350 to 1500, ion accumulation time 250 ms) followed by 40 MS/MS events (m/z ranging from 100 to 1500, ion accumulation time 50 ms). The threshold for MS/MS acquisition activation was set to 120 cps for +2~+5 precusors. Former target ion exclusion was set to 18 s.
Raw data from TripleTOF 5600 was analyzed with ProteinPilot (V4.5) using the Paragon database search algorithm and the integrated false discovery rate (FDR) analysis function. Spectra files were searched against the UniProt japonica rice reference proteome database using the following parameters: Sample Type, iTRAQ 8plex (Peptide labeled); Cys Alkylation, Iodoacetamide; Digestion, Trypsin; Quantitate, Bias correction, and Background correction was enabled for Specific Processing; Search Effort was set to Rapid ID. Search results were filtered with unused score and false discovery rate threshold (FDR) at 1%. Decoy hits were removed, the remaining identifications were used for quantification. Proteins with a fold change of >1.2 or <0.83 and a p-value of <0.05 were considered to be differentially expressed (Fan et al. 2016).
Bioinformatics analysis of DEPsAll DEPs were used for hierarchical cluster analysis with the Cluster 3.0 program. The DEPs were classified and grouped into different pathways according to Gene Ontology (GO) and Kyoto Encyclopedia of Genes and Genomes (KEGG). The protein-protein interaction networks were analyzed using the STRING 10 database (https://string.embl.de).
Quantitative real time PCR and western blot analysisTo validate the MS quantification results at the transcript level, total rice seedling tissue mRNA extracted using TRIzol reagent (Invitrogen) was used for cDNA synthesis using SuperScritRIII RT First Strand Synthesis Kit (Invitrogen) according to its protocol. SYBR® Premix Ex TaqTM (Takara, China) was used for real-time RT-PCR, and the specific primers (Supplemental Table 1) for target genes amplification were designed using Primer Express 3.0 software. β-actin was used as an internal control gene. Three biological repeats were performed for each target gene in real-time RT-PCR.
Western blot analysis was performed according to Qing et al. (2016). The rabbit polyclonal antibody was raised against synthetic oligopeptides which were identified by MS, DAGDAAPPAAATTTER to make anti-A0A0N7KH91 polyclonal antibody. The peptide antibody was made commercially (GL Biochem Co., Ltd., Shanghai, China). The plant β-actin polyclonal antibody was purchased from YIFEIXUE BIO TECH. The proteins used for western blot analysis were extracted from rice seedling tissue with urea extraction buffer, separated on 15% SDS-PAGE gel, then transferred onto a polyvinylidene fluoride membrane (Millipore, USA), which was probed with the anti-A0A0N7KH91 polyclonal antibody and anti-β-actin polyclonal antibody.
Results
Physiological response to cold stressTo validate contrasting stress phenotypes of Kongyu131 and 11 other cultivars in response to cold treatment, two-week-old rice seedlings were treated at 8°Cfor 4 days and then allowed to recover for 3 days. Before cold treatment, seedlings of all varieties grew normally (Fig. 1A). After the cold stress and recovery treatment, seedlings of the indica varieties (Guanghui998, Jinweiai, 02428, Y58S and Dachangli) and several japonica varieties (Liaoxing1, Liaoxing21 and Kunmingxiaobaigu) were completely wilted, whereas most seedlings of japonica rice varieties Kongyu131, Nipponbare and Daohuaxiang were able to survive (Fig. 1B). As seen in Fig. 1C, the survival rate of Kongyu131 after cold stress treatment was 77%, and is the highest survival rate in comparison to other varieties in this experiment.

To identify proteins that respond to cold stress in Kongyu131 at the proteomic level, two-week-old seedlings grown in soil were subjected to 0, 24, 48 and 72 h of cold stress treatments. The shoot tissues of the treated seedlings were used for quantitative proteomic analysis.
Identification and quantitation of proteins with iTRAQ-based LC-MS/MS analysisMS raw data were analyzed with ProteinPilot (V4.5) to identify and quantify proteins. As shown in Fig. 2A, a total of 89,976 MS/MS spectra were identified by iTRAQ-based LC-MS/MS analysis in time courses of cold stress treated Kongyu131 shoot tissues. Among them, 29,601 peptides were found. At least one unique peptide was identified for each confident protein. A total of 5082 unique proteins were identified by iTRAQ labeling from the time courses of cold-stressed Kongyu131 (Supplemental Table 2).

Through quantitative analysis with the software, 289 unique proteins were differentially expressed with changes greater than 1.2-fold or smaller than 0.83-fold, p-value smaller than 0.05. Regulated proteins formed two major clusters (Fig. 2B). After 24 h of cold treatment, 91 differentially expressed proteins (DEPs) (58 up- and 33 down-regulated) were found (Table 1). As the cold treatment time was increased, the number slightly increased: 179 DEPs (86 up- and 93 down-regulated) at 48 h (Table 2) and 142 DEPs (98 up- and 44 down-regulated) at 72 h (Table 3). Fig. 3 shows the Venn diagram analysis of the DEPs at different time points. Overall, there were 289 unique DEPs (169 uniquely up-regulated and 125 uniquely down-regulated) during cold stress. Among the 169 up-regulated proteins, 11 proteins were found to be significantly up-regulated at three time points (Fig. 3A), and 11 proteins of the 125 down-regulated proteins were found to be significantly down-regulated at three time points (Fig. 3B). Fifty-one proteins were found to be significantly up-regulated and 23 proteins were found to be significantly down-regulated at any two time points, respectively. Five proteins were found to be both significantly up- and down-regulated during cold stress treatments: 4 proteins up-regulated after 24 h of cold stress but down-regulated at 48 h time point, and one protein down-regulated after 48 h of cold stress but up-regulated at the 72 h time point.
Table 1.List of differentially expressed proteins after cold stress treatment for 24 h
| Uniprot_ID | Gene ID | Putative function | Peptides (95%)a | Cov (95%)b | Fold change |
|---|
| Q06967 | LOC_Os03g50290 | 14-3-3-like protein GF14-F | 28 | 74.62 | 1.31 |
| Q6ER94 | LOC_Os02g33450 | 2-Cys peroxiredoxin BAS1, chloroplastic | 17 | 49.81 | 1.56 |
| Q10N97 | LOC_Os03g16960 | 33 kDa secretory protein, putative, expressed | 6 | 35.85 | 0.41 |
| O65037 | LOC_Os01g69950 | 50S ribosomal protein L27, chloroplastic | 4 | 22.05 | 1.57 |
| Q7XR19 | LOC_Os04g39700.1 | 60S ribosomal protein L6 | 13 | 54.05 | 1.54 |
| P0DKK7 | LOC_Os09g32976 | 60S ribosomal protein L7a-2 | 14 | 42.25 | 1.38 |
| Q5N6W3 | LOC_Os01g67720.1 | ABC1-like | 8 | 22.59 | 0.42 |
| Q53JF7 | LOC_Os11g06720 | Abscisic stress-ripening protein 5 | 4 | 16.67 | 0.41 |
| Q9FXT4 | LOC_Os10g35110 | Alpha-galactosidase | 11 | 24.66 | 0.62 |
| Q10A56 | LOC_Os10g05069 | Alpha-mannosidase | 20 | 22.71 | 0.62 |
| Q2QX58 | LOC_Os12g07110 | AMP-binding enzyme family protein, expressed | 19 | 27.79 | 0.60 |
| Q5WAB3 | LOC_Os06g07090.1 | AP-1 complex subunit gamma | 8 | 11.03 | 0.66 |
| Q84PA4 | LOC_Os03g17070 | ATP synthase B chain, chloroplast, putative, expressed | 21 | 45.97 | 1.66 |
| Q7G3Y4 | LOC_Os10g17280 | ATP synthase gamma chain, mitochondrial, putative, expressed | 12 | 43.21 | 1.58 |
| Q7XXS0 | LOC_Os08g37320.1 | ATP synthase subunit d, mitochondrial | 19 | 67.46 | 1.42 |
| Q7F354 | LOC_Os01g51570.1 | Beta-1,3-glucanase | 7 | 30.18 | 0.46 |
| Q10RP0 | LOC_Os03g05730 | Cell division cycle protein 48, putative, expressed | 39 | 53.40 | 1.21 |
| Q8RU06 | LOC_Os10g22520 | Cellulase containing protein, expressed | 10 | 20.39 | 0.55 |
| Q53N83 | LOC_Os11g13890 | Chlorophyll a-b binding protein, chloroplastic | 22 | 51.59 | 1.31 |
| Q84PB4 | LOC_Os08g44680.1 | Chloroplast photosystem I reaction center subunit II-like protein | 25 | 70.44 | 1.77 |
| Q69S39 | LOC_Os07g37030 | Cytochrome b6-f complex iron-sulfur subunit, chloroplastic | 12 | 46.22 | 1.79 |
| Q5WMX0 | LOC_Os05g15770.1 | DIP3 | 16 | 36.36 | 1.75 |
| Q6L4S0 | LOC_Os05g51480 | DNA damage-binding protein 1 | 14 | 13.58 | 0.64 |
| P29545 | LOC_Os07g46750 | Elongation factor 1-beta | 10 | 57.14 | 1.41 |
| Q851Y8 | LOC_Os03g63410 | Elongation factor Tu | 20 | 48.12 | 1.64 |
| Q2QN11 | LOC_Os12g39360 | Eukaryotic aspartyl protease family protein, expressed | 10 | 25.34 | 0.44 |
| Q2R8Z8 | LOC_Os11g10470 | Expressed protein | 1 | 13.86 | 5.01 |
| Q0J8M2 | LOC_Os08g01380 | Ferredoxin-1, chloroplastic | 4 | 40.29 | 0.30 |
| P41344 | LOC_Os06g01850 | Ferredoxin—NADP reductase, leaf isozyme 1, chloroplastic | 30 | 56.08 | 1.58 |
| Q6ZFJ3 | LOC_Os02g01340 | Ferredoxin—NADP reductase, leaf isozyme 2, chloroplastic | 29 | 54.37 | 1.71 |
| Q40677 | LOC_Os11g07020 | Fructose-bisphosphate aldolase, chloroplastic | 47 | 57.73 | 1.50 |
| Q10CU9 | LOC_Os03g53800 | Glycosyl hydrolase family 3 N terminal domain containing protein, expressed | 17 | 28.32 | 0.60 |
| Q10CU4 | LOC_Os03g53860 | Glycosyl hydrolase family 3 N terminal domain containing protein, expressed | 19 | 23.96 | 0.52 |
| Q84TA3 | LOC_Os03g60460 | Leucine aminopeptidase | 15 | 25.20 | 0.64 |
| Q8GS76 | LOC_Os07g44780.1 | Lipase-like protein | 1 | 3.84 | 0.65 |
| Q0D5P8 | LOC_Os07g36080 | Oxygen-evolving enhancer protein 3, chloroplastic | 22 | 58.06 | 2.33 |
| Q7F1U0 | LOC_Os07g48020.1 | Peroxidase | 17 | 51.74 | 0.50 |
| Q9FYP0 | LOC_Os01g19020.1 | Peroxidase | 10 | 31.99 | 0.47 |
| Q6AVZ8 | LOC_Os05g04380.1 | Peroxidase | 16 | 49.12 | 0.42 |
| Q0DCP0 | LOC_Os06g20150.1 | Peroxidase (Fragment) | 14 | 39.53 | 0.53 |
| Q10CE4 | LOC_Os03g57220 | Peroxisomal (S)-2-hydroxy-acid oxidase GLO1 | 41 | 69.65 | 1.56 |
| Q6YT73 | LOC_Os07g05820 | Peroxisomal (S)-2-hydroxy-acid oxidase GLO5 | 38 | 65.85 | 1.84 |
| A0A0P0WP33 | LOC_Os05g41640.1 | Phosphoglycerate kinase | 41 | 68.18 | 2.42 |
| Q8LMR0 | LOC_Os03g06200 | Phosphoserine aminotransferase | 10 | 26.76 | 1.72 |
| Q8GT95 | LOC_Os07g38130 | Polygalacturonase inhibitor 1 | 8 | 32.83 | 0.54 |
| Q6AT26 | LOC_Os05g08370 | Probable cellulose synthase A catalytic subunit 1 [UDP-forming] | 5 | 5.30 | 1.39 |
| Q53LQ0 | LOC_Os11g09280 | Protein disulfide isomerase-like 1-1 | 26 | 41.80 | 1.46 |
| Q60E59 | LOC_Os05g32220.1 | Ribosomal protein | 17 | 39.83 | 1.45 |
| A3BLC3 | LOC_Os07g38300 | Ribosome-recycling factor, chloroplastic | 23 | 57.14 | 1.49 |
| Q10M12 | LOC_Os03g21040 | Ricin B-like lectin R40C1 | 15 | 53.45 | 1.32 |
| Q0JPA6 | LOC_Os01g13210 | Salt stress root protein RS1 | 17 | 66.18 | 1.79 |
| Q9S827 | LOC_Os08g02640 | Succinate dehydrogenase [ubiquinone] iron-sulfur subunit 1, mitochondrial | 6 | 28.47 | 2.65 |
| Q0D840 | LOC_Os07g08840 | Thioredoxin H1 | 9 | 54.92 | 1.67 |
| Q6ATY4 | LOC_Os05g33280 | UPF0603 protein Os05g0401100, chloroplastic | 15 | 36.12 | 1.45 |
| A0A0N7KH91 | LOC_Os03g22490.1 | Os03g0345700 protein (Fragment) | 1 | 6.67 | 0.32 |
| Q0DJB9 | LOC_Os05g23740.1 | Os05g0303000 protein (Fragment) | 33 | 46.19 | 1.47 |
| Q0DEV8 | LOC_Os06g04150.1 | Os06g0132400 protein (Fragment) | 7 | 43.12 | 1.64 |
| A0A0P0X3W0 | LOC_Os07g13280.1 | Os07g0237100 protein (Fragment) | 5 | 13.53 | 1.82 |
| Q0JAK9 | LOC_Os04g50204.1 | OSJNBa0009P12.17 protein | 11 | 13.91 | 1.71 |
| Q7XPV4 | LOC_Os04g58710.1 | OSJNBa0088H09.2 protein | 15 | 38.22 | 0.46 |
| Q0JN91 | LOC_Os01g21250.1 | Os01g0314800 protein | 1 | 8.60 | 5.92 |
| Q943W1 | LOC_Os01g31690.1 | Os01g0501800 protein | 36 | 66.07 | 2.07 |
| Q5VPC8 | LOC_Os01g46510.1 | Os01g0653800 protein | 8 | 8.50 | 0.62 |
| Q8W0E7 | LOC_Os01g52230.1 | Os01g0720400 protein | 1 | 3.65 | 5.20 |
| Q5JKX9 | LOC_Os01g72049.1 | Os01g0949060 protein | 3 | 8.61 | 0.62 |
| Q6YU90 | LOC_Os02g01150.1 | Os02g0101500 protein | 42 | 81.61 | 1.61 |
| Q6Z702 | LOC_Os02g03260.1 | Os02g0125100 protein | 19 | 46.30 | 1.47 |
| A0A0P0VH79 | LOC_Os02g15750.1 | Os02g0257300 protein | 10 | 17.20 | 1.92 |
| Q6K4S7 | LOC_Os02g18410.1 | Os02g0285300 protein | 12 | 41.81 | 1.67 |
| Q6Z875 | LOC_Os02g21970.1 | Os02g0325100 protein | 12 | 29.12 | 1.61 |
| A0A0P0VJP6 | LOC_Os02g31160.1 | Os02g0516800 protein | 2 | 4.04 | 0.64 |
| Q69S79 | LOC_Os02g36570.1 | Os02g0575500 protein | 3 | 4.72 | 0.56 |
| Q0E032 | LOC_Os02g37060.1 | Os02g0581100 protein | 3 | 10.92 | 0.51 |
| Q6ZGJ8 | LOC_Os02g52940.1 | Os02g0768600 protein | 22 | 64.69 | 1.45 |
| Q6KA00 | LOC_Os02g57670.1 | Os02g0822600 protein | 15 | 55.08 | 1.29 |
| B9F813 | LOC_Os04g16680.1 | Os04g0234600 protein | 38 | 57.91 | 1.85 |
| Q0JD53 | LOC_Os04g35140.1 | Os04g0430700 protein | 3 | 4.89 | 0.29 |
| Q0JAF4 | LOC_Os04g51300.1 | Os04g0602100 protein | 19 | 43.63 | 1.98 |
| A0A0P0WG85 | LOC_Os04g56740.1 | Os04g0663100 protein | 15 | 16.69 | 1.63 |
| A0A0P0WKD6 | LOC_Os05g22614.1 | Os05g0291700 protein | 41 | 69.29 | 1.74 |
| Q60EA3 | LOC_Os05g42350.1 | Os05g0503300 protein | 20 | 29.49 | 1.38 |
| Q658I3 | LOC_Os06g03770.1 | Os06g0128300 protein | 5 | 6.41 | 0.52 |
| Q67W57 | LOC_Os06g43850.1 | Os06g0646500 protein | 17 | 56.00 | 1.82 |
| A0A0P0X7J0 | LOC_Os07g35520.1 | Os07g0539400 protein | 6 | 11.32 | 0.48 |
| Q0D5S1 | LOC_Os07g35560.1 | Os07g0539900 protein | 14 | 28.24 | 0.46 |
| Q6ZG03 | LOC_Os08g17390.1 | Os08g0276100 protein | 12 | 36.03 | 1.42 |
| Q6YW78 | LOC_Os08g29370.1 | Os08g0382400 protein | 26 | 47.42 | 1.77 |
| Q8LNF2 | LOC_Os10g35810 | Os10g0502000 protein | 12 | 45.34 | 1.37 |
| A0A0P0Y5F2 | LOC_Os11g46000.1 | Os11g0687200 protein | 8 | 12.37 | 1.34 |
| Q2QWN3 | LOC_Os12g08770 | Os12g0189400 protein | 13 | 53.02 | 0.67 |
| Q2QSR7 | LOC_Os12g23180 | Os12g0420200 protein | 32 | 55.05 | 1.29 |
a Peptides (95%) indicate the identified peptides having at least 95% confidence.
b Cov (95%) indicate percentage of matching amino acids from identified peptides having at least 95% confidence.
Table 2.List of differentially expressed proteins after cold stress treatment for 48 h
| Uniprot_ID | Putative function | Peptides (95%)a | Cov (95%)b | Fold change |
|---|
| Q8S6N5 | Acetyl-CoA carboxylase 1 | 32 | 15.26 | 1.47 |
| Q0J709 | ACT domain-containing protein DS12, chloroplastic | 11 | 44.17 | 2.03 |
| Q10P83 | Acyl-CoA-binding domain-containing protein 5 | 1 | 4.39 | 1.63 |
| Q7F270 | ADP-ribosylation factor 1 OS = Oryza sativa subsp. japonica OX = 39947 GN = OJ1118_B03.103 PE = 2 SV = 1 | 7 | 27.07 | 2.19 |
| Q7XYS3 | Allene oxide synthase 2 | 12 | 29.08 | 1.72 |
| Q9FXT4 | Alpha-galactosidase | 11 | 24.66 | 0.37 |
| Q10A56 | Alpha-mannosidase | 20 | 22.71 | 0.40 |
| Q2R3E0 | Alpha-mannosidase | 32 | 33.92 | 0.34 |
| Q2QX58 | AMP-binding enzyme family protein, expressed | 19 | 27.79 | 0.61 |
| Q5WAB3 | AP-1 complex subunit gamma | 8 | 11.03 | 0.75 |
| P12085 | ATP synthase subunit beta, chloroplastic | 57 | 75.10 | 2.47 |
| Q655S1 | ATP-dependent zinc metalloprotease FTSH 2, chloroplastic | 35 | 47.34 | 2.23 |
| Q2QZU5 | Auxin-repressed protein-like protein ARP1, putative, expressed | 3 | 45.60 | 0.19 |
| Q75I93 | Beta-glucosidase 7 | 12 | 24.80 | 0.48 |
| Q0JR25 | Bowman-Birk type bran trypsin inhibitor | 8 | 33.86 | 0.19 |
| A5HEI2 | Bowman-Birk type proteinase inhibitor A | 15 | 43.82 | 0.19 |
| Q5VS79 | Calmodulin-binding protein-like | 17 | 33.89 | 0.59 |
| B9EXM2 | Carbamoyl-phosphate synthase large chain, chloroplastic | 29 | 26.37 | 0.60 |
| Q75HY2 | Carboxypeptidase | 11 | 31.45 | 1.46 |
| Q10RP0 | Cell division cycle protein 48, putative, expressed | 39 | 53.40 | 1.24 |
| Q8RU06 | Cellulase containing protein, expressed | 10 | 20.39 | 0.49 |
| Q84T92 | Chalcone—flavonone isomerase | 11 | 53.65 | 2.61 |
| Q6H795 | Chaperone protein ClpD1, chloroplastic | 11 | 14.29 | 1.96 |
| Q6ZF30 | Chlorophyll a-b binding protein, chloroplastic | 10 | 51.13 | 4.53 |
| Q7XV11 | Chlorophyll a-b binding protein, chloroplastic | 15 | 48.41 | 2.29 |
| Q53N83 | Chlorophyll a-b binding protein, chloroplastic | 22 | 51.59 | 1.87 |
| Q6H748 | Chlorophyll a-b binding protein, chloroplastic | 16 | 31.97 | 1.87 |
| Q7XC09 | Chloroplast chaperonin 10, putative, expressed | 8 | 54.29 | 0.60 |
| Q84PB4 | Chloroplast photosystem I reaction center subunit II-like protein | 25 | 70.44 | 2.11 |
| Q5W6F1 | Cinnamate-4-hydroxylase | 8 | 15.00 | 2.11 |
| Q6YUR8 | Cold shock domain protein 1 | 11 | 68.88 | 0.50 |
| Q7XCS3 | Cys/Met metabolism PLP-dependent enzyme family protein, expressed | 5 | 11.42 | 2.61 |
| P12123 | Cytochrome b6 | 5 | 25.12 | 3.66 |
| Q6ZAA5 | D-3-phosphoglycerate dehydrogenase | 10 | 17.23 | 1.80 |
| Q5WMX0 | DIP3 | 16 | 36.36 | 0.63 |
| Q306J3 | Dirigent protein | 16 | 58.50 | 2.88 |
| Q69JX7 | Drought-induced S-like ribonuclease | 3 | 13.10 | 0.42 |
| Q8S3P3 | DUF26-like protein | 10 | 44.96 | 0.29 |
| O64937 | Elongation factor 1-alpha | 29 | 48.77 | 0.23 |
| Q5Z627 | Elongation factor 1-gamma 3 | 21 | 43.51 | 0.50 |
| Q6ZI53 | Elongation factor Tu | 41 | 61.88 | 0.43 |
| Q2QN11 | Eukaryotic aspartyl protease family protein, expressed | 10 | 25.34 | 0.37 |
| Q8S7Q0 | Eukaryotic translation initiation factor 3 subunit B | 17 | 24.76 | 0.63 |
| Q0DHB7 | Expansin-A4 | 1 | 3.66 | 0.27 |
| Q2R8Z8 | Expressed protein | 1 | 13.86 | 8.63 |
| Q10T66 | Expressed protein | 9 | 49.75 | 0.68 |
| Q7G649 | Expressed protein | 15 | 61.82 | 0.36 |
| P41344 | Ferredoxin—NADP reductase, leaf isozyme 1, chloroplastic | 30 | 56.08 | 1.60 |
| Q6ZFJ3 | Ferredoxin—NADP reductase, leaf isozyme 2, chloroplastic | 29 | 54.37 | 2.81 |
| Q6ZD89 | Flavone 3ʹ-O-methyltransferase 1 | 20 | 60.60 | 1.82 |
| Q5N725 | Fructose-bisphosphate aldolase 3, cytoplasmic | 28 | 72.07 | 0.74 |
| Q5VQG4 | Galactinol—sucrose galactosyltransferase | 6 | 8.94 | 2.01 |
| Q6Z2T6 | Geranylgeranyl diphosphate reductase, chloroplastic | 26 | 47.08 | 0.67 |
| Q6ZBZ2 | Germin-like protein 8-14 | 4 | 15.96 | 0.42 |
| Q10CU9 | Glycosyl hydrolase family 3 N terminal domain containing protein, expressed | 17 | 28.32 | 0.58 |
| Q10CU4 | Glycosyl hydrolase family 3 N terminal domain containing protein, expressed | 19 | 23.96 | 0.51 |
| Q7XU02 | Glycosyltransferase | 3 | 7.34 | 2.17 |
| Q5VME5 | Glycosyltransferase | 11 | 31.19 | 2.00 |
| Q2R1S1 | Harpin binding protein 1, putative, expressed | 9 | 31.11 | 1.63 |
| Q7XUC9 | Histone H4 | 12 | 58.25 | 1.89 |
| O64437 | Inositol-3-phosphate synthase 1 | 4 | 8.43 | 2.27 |
| Q84TA3 | Leucine aminopeptidase | 15 | 25.20 | 0.64 |
| Q03200 | Light-regulated protein, chloroplastic | 3 | 36.72 | 0.18 |
| P29250 | Linoleate 9S-lipoxygenase 2 | 17 | 23.79 | 1.74 |
| Q8GS76 | Lipase-like protein | 1 | 3.84 | 0.77 |
| Q2QNN5 | Lipoxygenase | 23 | 28.74 | 7.80 |
| Q7XUG1 | Malate synthase | 14 | 29.81 | 0.47 |
| Q75M18 | Methionine S-methyltransferase | 11 | 12.18 | 1.64 |
| Q2QM23 | Methyl-CpG binding domain containing protein, expressed | 13 | 56.44 | 0.39 |
| Q7XUK3 | NADPH oxidoreductase | 10 | 36.23 | 3.02 |
| Q2QYL3 | Non-specific lipid-transfer protein 3 | 7 | 48.76 | 0.16 |
| Q75M32 | Peptidyl-prolyl cis-trans isomerase | 23 | 60.40 | 0.50 |
| Q6ZH98 | Peptidyl-prolyl cis-trans isomerase | 16 | 55.23 | 0.50 |
| Q5Z9H9 | Peptidyl-prolyl cis-trans isomerase | 17 | 55.91 | 0.39 |
| Q7F1F2 | Peptidylprolyl isomerase | 22 | 36.38 | 0.72 |
| Q7XSV2 | Peroxidase | 18 | 51.16 | 0.67 |
| Q0IMX5 | Peroxidase | 9 | 26.80 | 0.61 |
| Q7XSU8 | Peroxidase | 12 | 48.53 | 0.55 |
| Q6AVZ8 | Peroxidase | 16 | 49.12 | 0.49 |
| Q7XSU7 | Peroxidase | 14 | 35.51 | 0.47 |
| Q5Z7J2 | Peroxidase | 13 | 30.86 | 0.30 |
| A0A0P0XR31 | Peroxidase (Fragment) | 12 | 32.14 | 0.55 |
| Q0DCP0 | Peroxidase (Fragment) | 14 | 39.53 | 0.40 |
| Q6YT73 | Peroxisomal (S)-2-hydroxy-acid oxidase GLO5 | 38 | 65.85 | 1.82 |
| Q6K6Q1 | Phenylalanine ammonia-lyase | 23 | 30.08 | 4.02 |
| P14717 | Phenylalanine ammonia-lyase | 44 | 55.35 | 2.88 |
| Q75W16 | Phospho-2-dehydro-3-deoxyheptonate aldolase 2, chloroplastic | 14 | 25.60 | 2.42 |
| A0A0P0WP33 | Phosphoglycerate kinase | 41 | 68.18 | 2.27 |
| Q6Z8F4 | Phosphoribulokinase | 27 | 57.32 | 1.53 |
| Q8LMR0 | Phosphoserine aminotransferase | 10 | 26.76 | 1.77 |
| P0C355 | Photosystem I P700 chlorophyll a apoprotein A1 | 19 | 16.80 | 1.51 |
| P0C364 | Photosystem II CP47 reaction center protein | 24 | 31.89 | 2.54 |
| P0C434 | Photosystem II protein D1 | 18 | 31.73 | 2.99 |
| Q8L6I2 | Plasma membrane ATPase | 20 | 21.32 | 1.58 |
| Q8GT95 | Polygalacturonase inhibitor 1 | 8 | 32.83 | 0.32 |
| Q6ZC69 | Probable adenylate kinase 2, chloroplastic | 9 | 33.45 | 1.80 |
| Q5ZCK5 | Probable calcium-binding protein CML16 | 5 | 31.49 | 2.58 |
| Q75L11 | Probable histone H2A.6 | 6 | 30.13 | 4.37 |
| Q53RB0 | Probable linoleate 9S-lipoxygenase 4 | 14 | 16.42 | 1.84 |
| Q6K439 | Probable plastid-lipid-associated protein 2, chloroplastic | 17 | 42.01 | 1.66 |
| Q5VMJ3 | Profilin LP04 | 6 | 58.78 | 0.70 |
| Q7XKF3 | Protochlorophyllide reductase A, chloroplastic | 17 | 48.06 | 0.31 |
| Q6YZX6 | Putative aconitate hydratase, cytoplasmic | 39 | 41.98 | 0.68 |
| A0A0P0WK98 | Ribosomal protein L15 (Fragment) | 9 | 33.82 | 0.59 |
| A3BLC3 | Ribosome-recycling factor, chloroplastic | 23 | 57.14 | 0.59 |
| Q10M12 | Ricin B-like lectin R40C1 | 15 | 53.45 | 0.55 |
| P31924 | Sucrose synthase 1 | 63 | 54.90 | 0.59 |
| Q7XXS4 | Thiamine thiazole synthase, chloroplastic | 23 | 42.82 | 1.61 |
| Q0D840 | Thioredoxin H1 | 9 | 54.92 | 0.49 |
| Q6ZFU6 | Thioredoxin reductase NTRB | 7 | 41.09 | 1.75 |
| Q5N9C8 | Trafficking protein particle complex subunit | 2 | 17.53 | 2.11 |
| P12149 | 30S ribosomal protein S12, chloroplastic | 2 | 12.90 | 0.54 |
| P0C485 | 30S ribosomal protein S3, chloroplastic | 10 | 32.64 | 0.58 |
| Q10N98 | 33 kDa secretory protein, putative, expressed | 6 | 32.45 | 0.10 |
| Q0IQF7 | 40S ribosomal protein S16 | 10 | 47.65 | 0.60 |
| Q8L4F2 | 40S ribosomal protein S23, putative, expressed | 5 | 48.59 | 0.54 |
| Q8LI30 | 4-alpha-glucanotransferase DPE1, chloroplastic/amyloplastic | 6 | 10.94 | 2.17 |
| Q2QU06 | 60 kDa chaperonin alpha subunit | 40 | 57.96 | 0.61 |
| Q2QNF3 | 60S ribosomal protein L2, putative, expressed | 17 | 45.98 | 0.61 |
| P35684 | 60S ribosomal protein L3 | 21 | 36.50 | 0.63 |
| A0A0N7KH91 | Os03g0345700 protein (Fragment) | 1 | 6.67 | 0.10 |
| A0A0P0VRK8 | Os02g0818000 protein (Fragment) | 6 | 28.70 | 0.23 |
| A0A0P0VUM8 | Os03g0213100 protein (Fragment) | 6 | 10.11 | 2.21 |
| Q0DSD6 | Os03g0315800 protein (Fragment) | 22 | 37.69 | 0.65 |
| A0A0P0WKQ1 | Os05g0323800 protein (Fragment) | 9 | 20.46 | 1.51 |
| A0A0P0WTX9 | Os06g0214850 protein (Fragment) | 10 | 38.92 | 1.75 |
| A0A0P0X3W0 | Os07g0237100 protein (Fragment) | 5 | 13.53 | 1.84 |
| C7JA48 | Os12g0478100 protein (Fragment) | 2 | 18.49 | 5.30 |
| Q7XVP0 | OSJNBa0023J03.8 protein | 4 | 21.45 | 3.77 |
| Q7X7H3 | OSJNBa0076N16.12 protein | 17 | 29.04 | 1.64 |
| Q7XW32 | OSJNBb0062H02.10 protein | 16 | 56.94 | 0.48 |
| Q7X6F6 | OSJNBb0079B02.3 protein | 18 | 25.23 | 0.42 |
| Q0JR27 | Os01g0124100 protein | 5 | 24.32 | 0.12 |
| Q0JQZ2 | Os01g0130400 protein | 4 | 4.72 | 0.70 |
| Q9SDK4 | Os01g0254000 protein | 6 | 35.23 | 2.03 |
| Q0JN91 | Os01g0314800 protein | 1 | 8.60 | 12.71 |
| Q943W1 | Os01g0501800 protein | 36 | 66.07 | 1.82 |
| Q5VP66 | Os01g0644000 protein | 3 | 22.31 | 0.14 |
| Q5N754 | Os01g0815800 protein | 8 | 25.93 | 0.59 |
| Q943L0 | Os01g0839900 protein | 6 | 26.32 | 0.41 |
| Q943K1 | Os01g0869800 protein | 14 | 37.31 | 2.78 |
| Q6YU90 | Os02g0101500 protein | 42 | 81.61 | 1.27 |
| Q6EUK5 | Os02g0234500 protein | 17 | 35.43 | 1.96 |
| Q6ZH84 | Os02g0593700 protein | 3 | 4.73 | 2.78 |
| Q6K9C2 | Os02g0610700 protein | 5 | 17.95 | 1.84 |
| Q6K1Q6 | Os02g0622300 protein | 11 | 41.79 | 0.72 |
| Q6Z8I7 | Os02g0752200 protein | 12 | 19.36 | 0.61 |
| Q6K3F7 | Os02g0812400 protein | 3 | 4.51 | 2.42 |
| Q10N92 | Os03g0278200 protein | 5 | 9.78 | 2.25 |
| A0A0N7KH54 | Os03g0311300 protein | 6 | 27.45 | 1.79 |
| Q10K10 | Os03g0401100 protein | 1 | 1.73 | 0.59 |
| Q94H99 | Os03g0761000 protein | 5 | 32.64 | 0.37 |
| A0A0P0W5A9 | Os03g0841900 protein | 4 | 6.98 | 1.33 |
| Q84M68 | Os03g0856500 protein | 9 | 24.60 | 0.26 |
| B9F813 | Os04g0234600 protein | 38 | 57.91 | 1.77 |
| Q7XIK5 | Os04g0613600 protein | 9 | 46.58 | 0.60 |
| B9FM04 | Os05g0104650 protein | 13 | 10.74 | 0.64 |
| Q0DK70 | Os05g0188100 protein | 4 | 42.70 | 0.33 |
| Q75IK4 | Os05g0209600 protein | 8 | 23.82 | 0.34 |
| A0A0P0WKD6 | Os05g0291700 protein | 41 | 69.29 | 1.80 |
| Q0DG76 | Os05g0549100 protein | 18 | 33.45 | 0.47 |
| Q0DG31 | Os05g0556100 protein | 18 | 28.41 | 1.54 |
| Q0DFD6 | Os05g0597100 protein | 5 | 17.17 | 0.59 |
| Q9LWT6 | Os06g0114000 protein | 57 | 67.89 | 0.44 |
| Q0DEF1 | Os06g0157000 protein | 9 | 32.84 | 0.32 |
| Q8GTK4 | Os07g0141400 protein | 25 | 60.63 | 1.67 |
| Q84PB5 | Os07g0148900 protein | 6 | 22.56 | 4.02 |
| Q6ZLQ0 | Os07g0150100 protein | 8 | 9.44 | 1.26 |
| Q6ZLB8 | Os07g0180900 protein | 31 | 60.00 | 0.66 |
| Q0D5S1 | Os07g0539900 protein | 14 | 28.24 | 0.29 |
| Q6YPF2 | Os08g0120500 protein | 23 | 34.08 | 0.52 |
| Q7EYM8 | Os08g0379400 protein | 24 | 56.41 | 2.51 |
| Q6Z8N9 | Os08g0512400 protein | 8 | 23.73 | 0.44 |
| A0A0P0XX30 | Os10g0530500 protein | 10 | 56.00 | 1.80 |
| Q2QZH3 | Os11g0687100 protein | 12 | 16.43 | 2.15 |
| A0A0P0Y5F2 | Os11g0687200 protein | 8 | 12.37 | 1.82 |
| Q0IPL3 | Os12g0189300 protein | 15 | 50.00 | 3.37 |
| Q2QWN3 | Os12g0189400 protein | 13 | 53.02 | 0.72 |
| Q2QNS7 | Os12g0555500 protein | 10 | 70.25 | 2.58 |
a Peptides (95%) indicate the identified peptides having at least 95% confidence.
b Cov (95%) indicate percentage of matching amino acids from identified peptides having at least 95% confidence.
Table 3.List of differentially expressed proteins after cold stress treatment for 72 h
| Uniprot_ID | Putative function | Peptides (95%)a | Cov (95%)b | Fold change |
|---|
| Q0J709 | ACT domain-containing protein DS12, chloroplastic | 11 | 44.17 | 2.03 |
| Q10P83 | Acyl-CoA-binding domain-containing protein 5 | 1 | 4.39 | 1.94 |
| A0A0P0Y1Y5 | Adenosylhomocysteinase (Fragment) | 30 | 55.15 | 1.27 |
| Q7XYS3 | Allene oxide synthase 2 | 12 | 29.08 | 1.72 |
| Q9FXT4 | Alpha-galactosidase | 11 | 24.66 | 0.43 |
| Q10A56 | Alpha-mannosidase | 20 | 22.71 | 0.67 |
| Q5WAB3 | AP-1 complex subunit gamma | 8 | 11.03 | 0.72 |
| P0C2Z6 | ATP synthase subunit alpha, chloroplastic | 36 | 51.68 | 1.20 |
| P0C522 | ATP synthase subunit alpha, mitochondrial | 31 | 53.24 | 1.71 |
| Q93VT8 | ATP-citrate synthase beta chain protein 1 | 25 | 46.71 | 1.43 |
| Q5Z974 | ATP-dependent zinc metalloprotease FTSH 1, chloroplastic | 34 | 40.38 | 1.32 |
| Q655S1 | ATP-dependent zinc metalloprotease FTSH 2, chloroplastic | 35 | 47.34 | 1.58 |
| Q0JR25 | Bowman-Birk type bran trypsin inhibitor | 8 | 33.86 | 0.39 |
| Q2QMX9 | Calcium-transporting ATPase 10, plasma membrane-type | 7 | 6.76 | 1.43 |
| B9EXM2 | Carbamoyl-phosphate synthase large chain, chloroplastic | 29 | 26.37 | 0.65 |
| Q75HY2 | Carboxypeptidase | 11 | 31.45 | 1.56 |
| Q10RP0 | Cell division cycle protein 48, putative, expressed | 39 | 53.40 | 1.79 |
| Q84T92 | Chalcone—flavonone isomerase | 11 | 53.65 | 2.51 |
| Q6H795 | Chaperone protein ClpD1, chloroplastic | 11 | 14.29 | 3.70 |
| Q6H748 | Chlorophyll a-b binding protein, chloroplastic | 16 | 31.97 | 2.00 |
| Q7XV11 | Chlorophyll a-b binding protein, chloroplastic | 15 | 48.41 | 2.13 |
| Q53N83 | Chlorophyll a-b binding protein, chloroplastic | 22 | 51.59 | 1.38 |
| Q6ZF30 | Chlorophyll a-b binding protein, chloroplastic | 10 | 51.13 | 3.08 |
| Q10HD0 | Chlorophyll a-b binding protein, chloroplastic | 16 | 45.25 | 2.73 |
| Q5W6F1 | Cinnamate-4-hydroxylase | 8 | 15.00 | 2.05 |
| Q6ZGV8 | Clustered mitochondria protein homolog | 8 | 7.36 | 1.53 |
| Q6YUR8 | Cold shock domain protein 1 | 11 | 68.88 | 0.48 |
| Q7XCS3 | Cys/Met metabolism PLP-dependent enzyme family protein, expressed | 5 | 11.42 | 3.16 |
| Q7XKC8 | Dihydroorotate dehydrogenase (quinone), mitochondrial | 5 | 13.22 | 0.25 |
| Q306J3 | Dirigent protein | 16 | 58.50 | 1.82 |
| Q69JX7 | Drought-induced S-like ribonuclease | 3 | 13.10 | 0.49 |
| Q2QN11 | Eukaryotic aspartyl protease family protein, expressed | 10 | 25.34 | 0.43 |
| Q7G649 | Expressed protein | 15 | 61.82 | 0.52 |
| Q2R678 | Expressed protein | 11 | 27.67 | 1.54 |
| Q10T66 | Expressed protein | 9 | 49.75 | 0.51 |
| Q2R8Z8 | Expressed protein | 1 | 13.86 | 14.32 |
| P41344 | Ferredoxin—NADP reductase, leaf isozyme 1, chloroplastic | 30 | 56.08 | 1.77 |
| Q6ZFJ3 | Ferredoxin—NADP reductase, leaf isozyme 2, chloroplastic | 29 | 54.37 | 2.23 |
| Q6ZD89 | Flavone 3ʹ-O-methyltransferase 1 | 20 | 60.60 | 1.96 |
| Q69V57 | Fructose-bisphosphate aldolase | 31 | 75.14 | 1.42 |
| Q40677 | Fructose-bisphosphate aldolase, chloroplastic | 47 | 57.73 | 1.47 |
| Q5VQG4 | Galactinol—sucrose galactosyltransferase OS = Oryza sativa subsp. japonica OX = 39947 GN = RFS PE = 1 SV = 1 | 6 | 8.94 | 2.49 |
| Q6Z2T6 | Geranylgeranyl diphosphate reductase, chloroplastic | 26 | 47.08 | 0.64 |
| P15280 | Glucose-1-phosphate adenylyltransferase small subunit 2, chloroplastic/amyloplastic/cytosolic | 22 | 41.05 | 1.33 |
| P14656 | Glutamine synthetase cytosolic isozyme 1-1 | 9 | 33.99 | 1.74 |
| Q945W2 | Glutathione S-transferase GSTU6, putative, expressed | 6 | 28.81 | 2.15 |
| Q8H8D6 | Glutathione S-transferase, N-terminal domain containing protein, expressed | 16 | 46.39 | 0.62 |
| Q0J8A4 | Glyceraldehyde-3-phosphate dehydrogenase 1, cytosolic | 28 | 62.02 | 2.81 |
| A3C6G9 | Glycine cleavage system H protein, mitochondrial | 8 | 67.68 | 0.41 |
| Q10CU9 | Glycosyl hydrolase family 3 N terminal domain containing protein, expressed | 17 | 28.32 | 0.60 |
| Q7XU02 | Glycosyltransferase | 3 | 7.34 | 2.65 |
| Q5VME5 | Glycosyltransferase | 11 | 31.19 | 1.82 |
| Q7XUC9 | Histone H4 | 12 | 58.25 | 2.96 |
| Q851P9 | Histone-like protein | 6 | 19.11 | 3.73 |
| O64437 | Inositol-3-phosphate synthase 1 | 4 | 8.43 | 2.40 |
| Q84TA3 | Leucine aminopeptidase | 15 | 25.20 | 0.65 |
| Q6K669 | Leucine aminopeptidase 2, chloroplastic | 27 | 39.63 | 1.29 |
| P38419 | Lipoxygenase 7, chloroplastic | 16 | 18.94 | 1.54 |
| Q7XZW5 | Malate dehydrogenase | 34 | 85.31 | 1.64 |
| Q2QM23 | Methyl-CpG binding domain containing protein, expressed | 13 | 56.44 | 0.52 |
| Q7XUK3 | NADPH oxidoreductase | 10 | 36.23 | 3.70 |
| Q0D5P8 | Oxygen-evolving enhancer protein 3, chloroplastic | 22 | 58.06 | 1.25 |
| Q5JMS4 | Peroxidase | 18 | 50.40 | 1.79 |
| Q6AVZ8 | Peroxidase | 16 | 49.12 | 0.44 |
| Q9FYP0 | Peroxidase | 10 | 31.99 | 0.48 |
| Q0JM38 | Peroxidase | 8 | 25.59 | 0.27 |
| Q5Z7J2 | Peroxidase | 13 | 30.86 | 0.47 |
| Q0DCP0 | Peroxidase (Fragment) | 14 | 39.53 | 0.50 |
| A0A0P0XR31 | Peroxidase (Fragment) | 12 | 32.14 | 0.57 |
| Q6YT73 | Peroxisomal (S)-2-hydroxy-acid oxidase GLO5 | 38 | 65.85 | 2.01 |
| P14717 | Phenylalanine ammonia-lyase | 44 | 55.35 | 2.70 |
| Q6K6Q1 | Phenylalanine ammonia-lyase | 23 | 30.08 | 3.98 |
| Q0DZE0 | Phenylalanine ammonia-lyase | 22 | 27.91 | 5.86 |
| Q75W16 | Phospho-2-dehydro-3-deoxyheptonate aldolase 2, chloroplastic | 14 | 25.60 | 2.49 |
| A0A0P0WP33 | Phosphoglycerate kinase | 41 | 68.18 | 1.92 |
| P0C355 | Photosystem I P700 chlorophyll a apoprotein A1 | 19 | 16.80 | 1.56 |
| P0C358 | Photosystem I P700 chlorophyll a apoprotein A2 | 20 | 20.84 | 2.56 |
| P0C364 | Photosystem II CP47 reaction center protein | 24 | 31.89 | 2.75 |
| Q8GT95 | Polygalacturonase inhibitor 1 | 8 | 32.83 | 0.43 |
| Q5ZCK5 | Probable calcium-binding protein CML16 | 5 | 31.49 | 2.05 |
| Q75L11 | Probable histone H2A.6 | 6 | 30.13 | 4.41 |
| Q6K439 | Probable plastid-lipid-associated protein 2, chloroplastic | 17 | 42.01 | 1.79 |
| Q0D5W6 | Protein translation factor SUI1 homolog | 6 | 43.48 | 2.68 |
| Q6ZHE5 | Putative D-cysteine desulfhydrase 1, mitochondrial | 13 | 34.98 | 1.34 |
| Q7XKB5 | Pyruvate kinase | 18 | 32.09 | 1.22 |
| P31924 | Sucrose synthase 1 | 63 | 54.90 | 1.33 |
| Q93X08 | UTP—glucose-1-phosphate uridylyltransferase | 35 | 60.55 | 1.39 |
| Q06967 | 14-3-3-like protein GF14-F | 28 | 74.62 | 1.43 |
| Q6ER94 | 2-Cys peroxiredoxin BAS1, chloroplastic | 17 | 49.81 | 1.45 |
| P0C488 | 30S ribosomal protein S4, chloroplastic | 11 | 42.29 | 2.03 |
| Q8LI30 | 4-alpha-glucanotransferase DPE1, chloroplastic/amyloplastic | 6 | 10.94 | 2.09 |
| Q2QLY5 | 5-methyltetrahydropteroyltriglutamate—homocysteine methyltransferase 1 | 40 | 43.99 | 2.03 |
| P49210 | 60S ribosomal protein L9 | 11 | 55.26 | 1.54 |
| Q2R480 | 6-phosphogluconate dehydrogenase, decarboxylating 2, chloroplastic | 17 | 37.20 | 1.43 |
| A0A0N7KH91 | Os03g0345700 protein (Fragment) | 1 | 6.67 | 0.12 |
| A0A0P0VRK8 | Os02g0818000 protein (Fragment) | 6 | 28.70 | 0.29 |
| A0A0P0VTG7 | Os03g0165300 protein (Fragment) | 4 | 8.65 | 0.18 |
| A0A0P0VUM8 | Os03g0213100 protein (Fragment) | 6 | 10.11 | 2.38 |
| Q0DEU8 | Os06g0133800 protein (Fragment) | 52 | 64.45 | 1.50 |
| A0A0P0Y445 | Os11g0602500 protein (Fragment) | 13 | 37.32 | 1.71 |
| C7JA48 | Os12g0478100 protein (Fragment) | 2 | 18.49 | 11.91 |
| Q7XPV4 | OSJNBa0088H09.2 protein | 15 | 38.22 | 0.68 |
| Q7XVF8 | OSJNBb0118P14.7 protein | 5 | 15.38 | 2.00 |
| Q94EG1 | Os01g0178000 protein | 7 | 24.37 | 0.69 |
| Q5VR43 | Os01g0180300 protein | 51 | 55.48 | 0.61 |
| Q9SDK4 | Os01g0254000 protein | 6 | 35.23 | 1.57 |
| Q9FP25 | Os01g0303000 protein | 14 | 62.90 | 0.44 |
| Q0JN91 | Os01g0314800 protein | 1 | 8.60 | 8.32 |
| Q6YU90 | Os02g0101500 protein | 42 | 81.61 | 1.58 |
| Q6YUV4 | Os02g0189000 protein | 6 | 32.88 | 0.51 |
| Q6EUK5 | Os02g0234500 protein | 17 | 35.43 | 1.67 |
| Q6ZH84 | Os02g0593700 protein | 3 | 4.73 | 4.83 |
| Q6Z8I7 | Os02g0752200 protein | 12 | 19.36 | 0.62 |
| Q0DWG3 | Os02g0816300 protein | 4 | 3.93 | 0.40 |
| Q10RI4 | Os03g0158500 protein | 5 | 8.77 | 2.17 |
| Q10N92 | Os03g0278200 protein | 5 | 9.78 | 2.25 |
| Q9AUQ4 | Os03g0712700 protein | 32 | 51.03 | 1.42 |
| Q8S7H8 | Os03g0778100 protein | 11 | 37.29 | 2.29 |
| B9F813 | Os04g0234600 protein | 38 | 57.91 | 1.89 |
| Q0JAF4 | Os04g0602100 protein | 19 | 43.63 | 1.77 |
| Q75IR7 | Os05g0163000 protein | 15 | 26.73 | 1.46 |
| Q0DK70 | Os05g0188100 protein | 4 | 42.70 | 0.42 |
| Q75IK4 | Os05g0209600 protein | 8 | 23.82 | 0.57 |
| Q6F322 | Os05g0490700 protein | 9 | 13.84 | 1.33 |
| Q0DG76 | Os05g0549100 protein | 18 | 33.45 | 0.51 |
| Q9SNN5 | Os06g0130800 protein | 8 | 30.83 | 0.69 |
| Q7XXQ8 | Os06g0232000 protein | 6 | 16.80 | 0.36 |
| Q69WH2 | Os06g0332800 protein | 6 | 44.27 | 0.43 |
| Q93W07 | Os06g0568200 protein | 23 | 50.82 | 1.24 |
| Q67W57 | Os06g0646500 protein | 17 | 56.00 | 2.03 |
| Q5YM05 | Os06g0720400 protein | 10 | 22.75 | 1.58 |
| Q8GTK4 | Os07g0141400 protein | 25 | 60.63 | 1.57 |
| Q84PB5 | Os07g0148900 protein | 6 | 22.56 | 4.66 |
| A0A0P0X7J0 | Os07g0539400 protein | 6 | 11.32 | 0.40 |
| Q0D5S1 | Os07g0539900 protein | 14 | 28.24 | 0.63 |
| Q0D3Z0 | Os07g0658300 protein | 1 | 1.03 | 0.72 |
| Q6ZFI6 | Os08g0502700 protein | 29 | 58.21 | 1.82 |
| Q650W6 | Os09g0565200 protein | 13 | 36.65 | 0.54 |
| Q2QZH3 | Os11g0687100 protein | 12 | 16.43 | 1.67 |
| A0A0P0Y5F2 | Os11g0687200 protein | 8 | 12.37 | 1.72 |
| Q0IPL3 | Os12g0189300 protein | 15 | 50.00 | 2.51 |
| Q2QSR7 | Os12g0420200 protein | 32 | 55.05 | 1.33 |
a Peptides (95%) indicate the identified peptides having at least 95% confidence.
b Cov (95%) indicate percentage of matching amino acids from identified peptides having at least 95% confidence.

To further understand the functions of DEPs, GO analysis was performed. 253 protein IDs of 289 unique DEPs were assigned functions in the GO analysis. The DEPs were significantly enriched in 13/14/11 biological processes at 24/48/72 h cold stress treatment, 10/10/8 cellular components at 24/48/72 h cold stress treatment, and 7/8/6 molecular function subgroups at 24/48/72 h cold stress treatment. The metabolic process, cellular process and response to stimulus groups were prominent in the biological process subgroup, indicating that the metabolic processes are more quickly affected under cold stress (Fig. 4A). The cell part, organelle, organelle part, membrane part and protein-containing complex groups were highly localized within the cellular component subgroup (Fig. 4B). Among the DEPs, the enriched GO terms concerning molecular function showed that DEPs were mainly associated with catalytic activity and binding, followed by the structural molecule activity, antioxidant activity and molecular function regulator (Fig. 4C).

DEPs of 24 h, 48 h and 72 h cold treatment were mapped to the reference pathway in the KEGG database for functional analysis. The metabolic pathways, photosynthesis, phenylpropanoid biosynthesis, carbon metabolism and carbon fixation in photosynthetic organisms were significantly enriched in three time points of the cold stress treatment (Fig. 5). There were some different pathways enriched in different cold tress time points. For example, oxidative phosphorylation, glucosinolate biosynthesis, vitamin B6 metabolism were specifically enriched at 24 h cold stress treatment (Fig. 5A); linoleic acid metabolism, cyanoamino metabolism, thiamine metabolism and zeatin biosynthesis were specifically enriched at 48 h cold stress treatment (Fig. 5B); cysteine and methionine metabolism, galactose metabolism pentose phosphate pathway and starch/sucrose metabolism were specifically enriched at 72 h cold stress treatment (Fig. 5C). As the cold stress time increased, enriched pathways were more and more stable, with ten of the pathways affected in both the 48 h and 72 h cold stress time points (Fig. 5).

The protein-protein interaction networks of DEPs from three time points of cold stress treatment containing biological processes, cellular components and molecular function were constructed based on the Search Tool for the Retrieval of Interacting Genes/Proteins 11.0 (STRING 11.0) database. By removing unconnected proteins, the resulting network of 24 h cold response proteins contained 64 protein nodes and 360 edges (Fig. 6A), the resulting network of 48 h cold response proteins contained 121 protein nodes and 546 edges (Fig. 6B), and the resulting network of 72 h cold response proteins contained 90 protein nodes and 402 edges (Fig. 6C). In biological processes, DEPs that function in metabolic process, cellular process, response to stimulus and biological regulation are highly up-regulated during cold stress; in terms of cellular components, DEPs that function in extracellular region, membrane, protein-containing complex and cell parts are up-regulated during cold stress; in terms of molecular function, DEPs that function in catalytic activity, binding and molecular function regulator are highly up-regulated during cold stress.

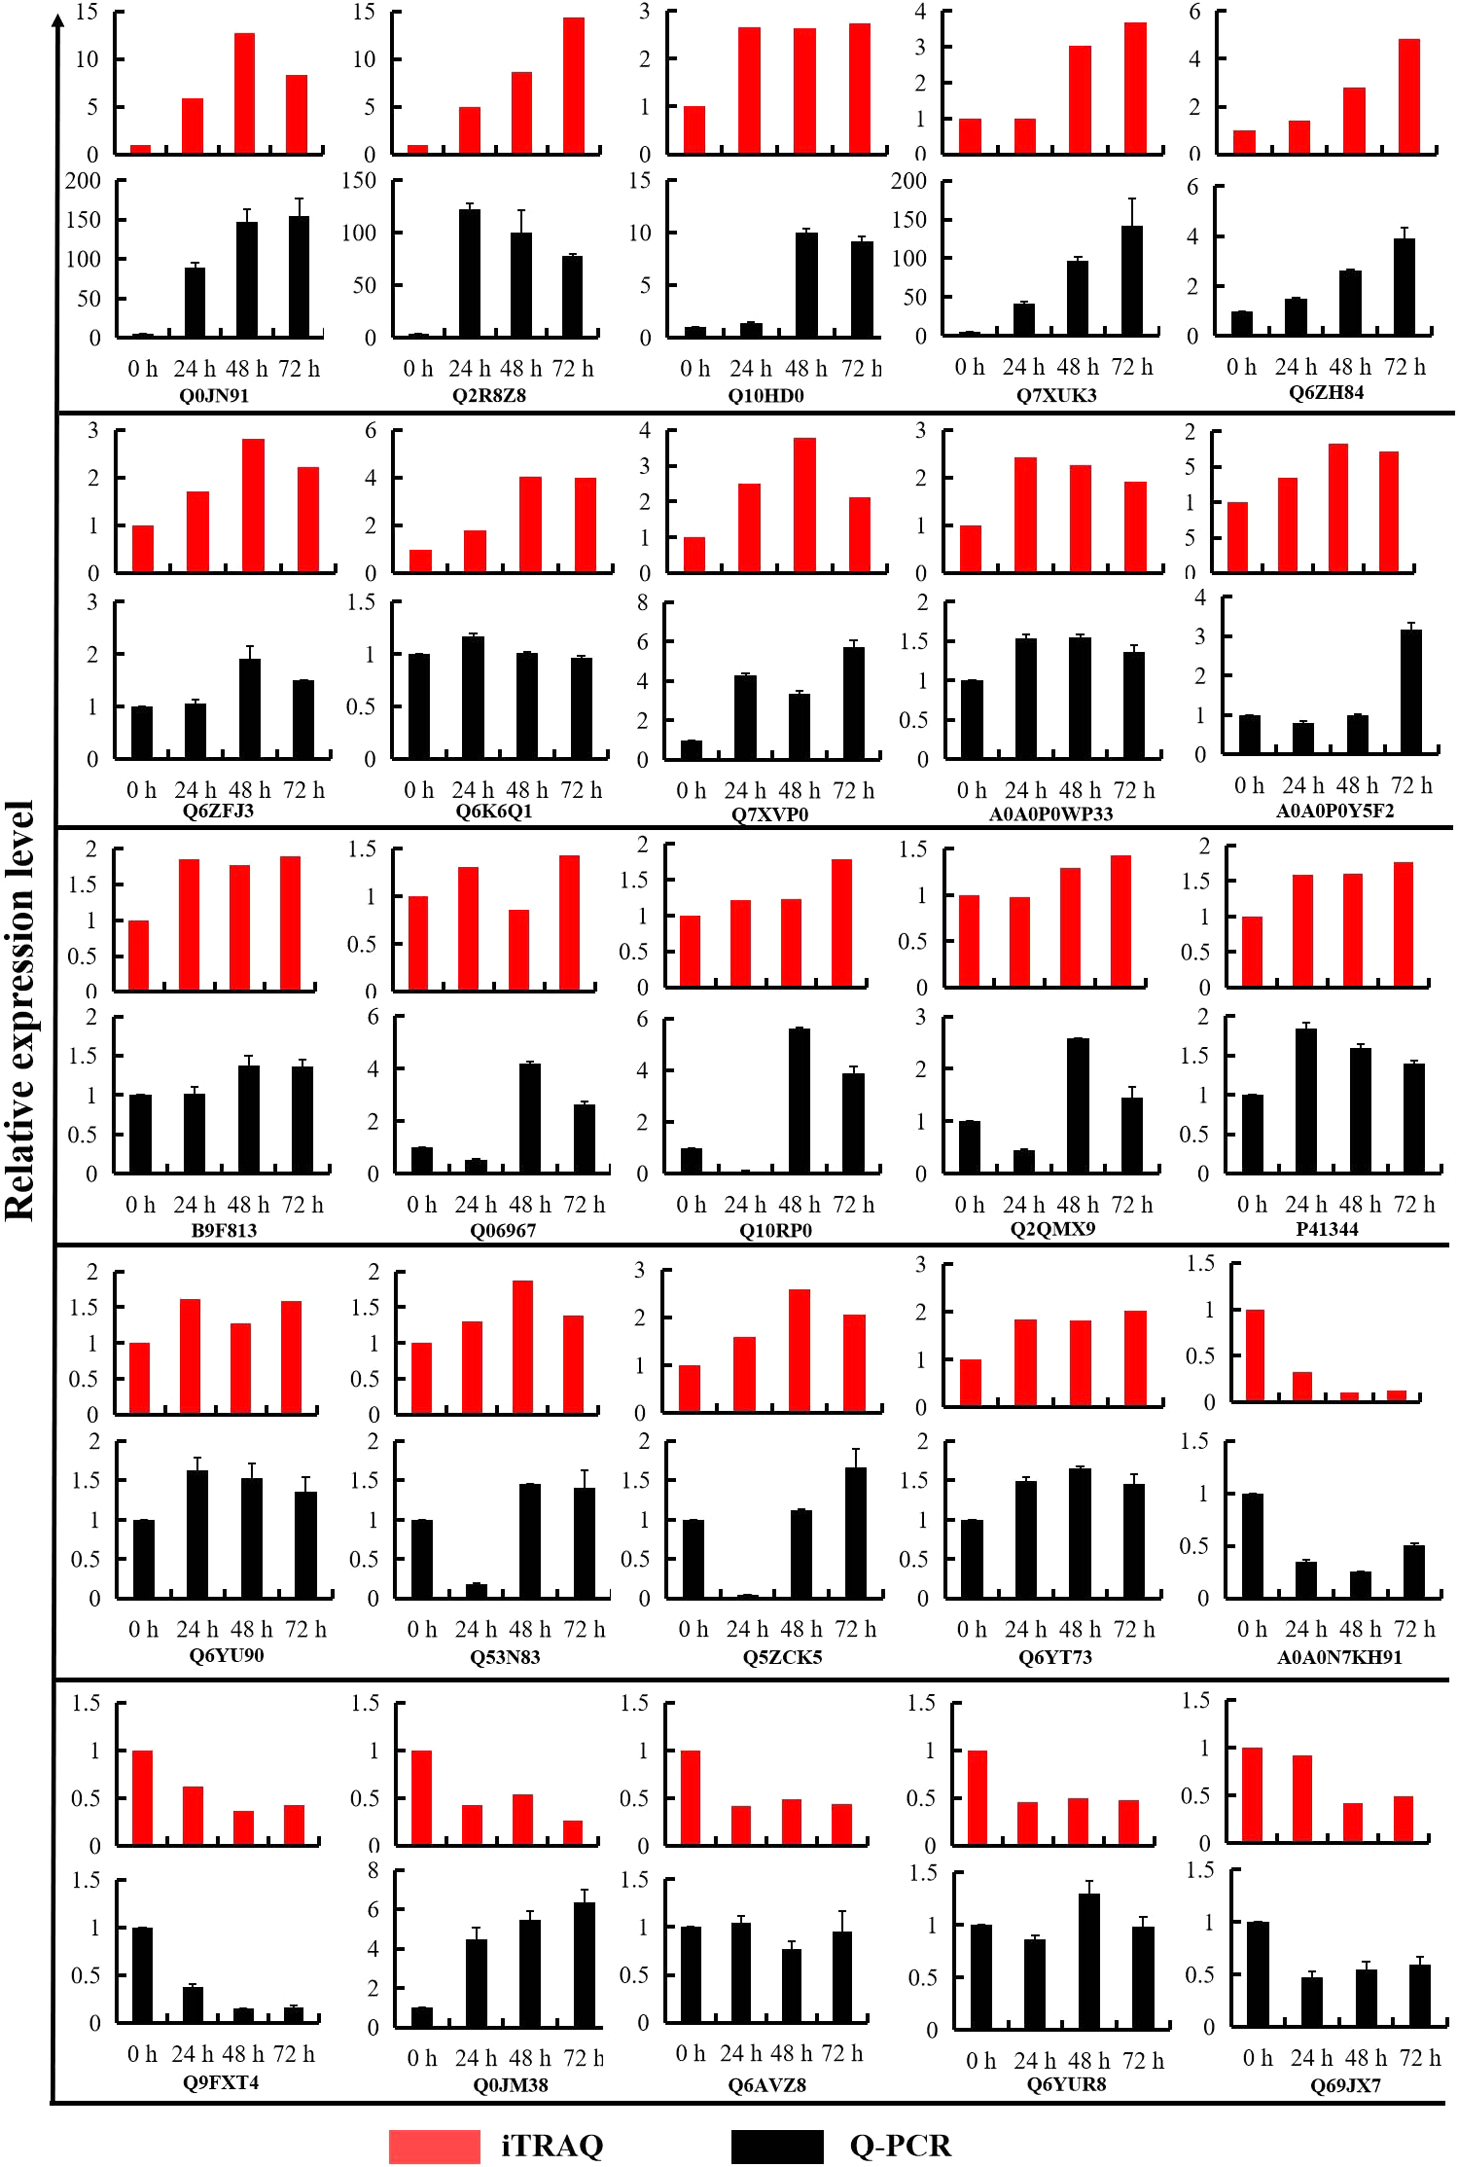
19 up-regulated DEPs and 6 down-regulated DEPs were selected for Q-PCR analysis, to validate the relationship of expression profiles between mRNA and protein level. We compared the transcription levels of 24 h, 48 h and 72 h cold stress treatments with the iTRAQ data. As shown in Fig. 7, Q-PCR data indicated that the mRNA levels of 19 up-regulated DEPs increased under cold stress, the regulation trends of four DEPs (Q7XUK3, Q6ZH84, Q6ZFJ3, A0A0P0WP33) at three time points of cold treatment were consistent with the iTRAQ quantification data. The mRNA levels of four out of six down-regulated DEPs decreased under cold stress, and the regulation trends of two DEPs (A0A0N7KH91 and Q9FXT4) at three time points of cold treatment were consistent with the iTRAQ quantification data (Fig. 7). The relative mRNA levels of some proteins were inconsistent with the iTRAQ data, maybe the expression of these genes is controlled by posttranscriptional regulation processes involving translation initiation, mRNA and protein stability (Tian et al. 2004).
To further validate the protein regulation levels of DEPs identified by the iTRAQ labeling analysis, one down-regulated protein A0A0N7KH91 was selected for confirmation by western blot analysis with a specific peptide antibody raised against the protein, and using β-actin antibody as control. Fig. 8 showed that A0A0N7KH91 protein also down-regulated during cold stress treatment from 24 h to 72 h. This result further confirmed the iTRAQ labeling analysis data.
Discussion
In this work, we performed quantitative proteomic analysis of japonica rice seedlings subjected to time course cold stress treatments to obtain the dynamic proteins expression patterns responsive to low temperature. Using iTRAQ labeling coupled with LC-MS/MS analysis, 5802 proteins were identified and were used for quantification from the rice tissues. As a result, we found 91/179/142 cold responsive proteins at 24/48/72 h cold stress treatments with the fold change >1.2 or <0.83 with a p-value <0.05 for the differentially regulated proteins (Tables 1–3), and the number of cold responsive proteins increased when the treatment time increased. This result is consistent with a previous quantitative proteomic analysis of indica rice that also used a time course of cold stress treatment (Wang et al. 2018a).
Increasing proteomics studies on rice cold stress treatment are being used to explore cold response proteins for understanding plant cold-tolerance mechanism. Some proteins that were identified previously to be cold response proteins have been further confirmed in our study using the quantitative proteomic method. These proteins mainly include: sucrose synthase (Cui et al. 2005, Maraña et al. 1990), phenylalanine ammonia-lyse (Cui et al. 2005, Leyva et al. 1995, Sanchez-Ballesta et al. 2000), GSTs (Binh and Oono 1992, Cui et al. 2005, Marrs 1996, Roxas et al. 1997), 14-3-3 like protein GF14-F/Drought induced protein 3/Peroxidase/Phosphoserine aminotransferase (Wang et al. 2018a), ATP synthase (Cen et al. 2018, Cui et al. 2005, Ji et al. 2017, Wang et al. 2018a, Yan et al. 2006), cold shock domain protein (Chaikam and Karlson 2008), drought-induced S-like ribonuclease (Neilson et al. 2011), DUF26-like protein/Photosystem related proteins/Non-specific lipid-transfer protein (Cen et al. 2018, Wang et al. 2018a), and malate dehydrogenase (Lee et al. 2009, Yan et al. 2006).
Based on an analysis of the physiological functions of cold responsive proteins in previous studies, some relative to cold genes identified in the present work may serve to resist cold stress. 14-3-3 proteins can regulate target proteins involved in responses to biotic and abiotic stress through protein interactions (Chen et al. 2006, Cooper et al. 2003), and it also may enhance tolerance to abiotic stress by ion channels regulation and hormone signaling pathways participation (Zhao et al. 2021). 14-3-3-like protein GF14c can target to plasma, thylakoid and vacuolar membranes and associated ATPase synthase complexes involved in stress responses (Baunsgaard et al. 1998, Cooper 2001, Sehnke et al. 2000). 14-3-3-like protein GF14-F (Q06967) was shown to be up-regulated during cold stress in this study, and probably functions in cold resistant in the cold tolerance rice cultivar Kongyu131. Calcium-transporting ATPase genes differentially expressed under cold, salt and drought stresses are involved in abiotic stress signaling (Singh et al. 2014), the calcium-transporting ATPase 10 protein (Q2QMX9) up-regulated after 72 h cold stress treatment might trigger a stress signaling pathway. Chaperone protein ClpD1 is involved in heat and osmotic stress response, and up-regulation of this protein is correlated with increased drought tolerance in rice (Wu et al. 2016). Thus, the up-regulation of chaperone protein (Q6H795) both at 48 h and 72 h of cold stress treatment might play a role in resisting cold stress in this experiment. 6-phosphogluconate dehydrogenase activity increased in rice seedlings during various abiotic stresses treatments, and might function as a regulator to control the efficiency of the pathway under abiotic stresses (Hou et al. 2007). Thus, 6-phosphogluconate dehydrogenase (Q2R480) up-regulated maybe regulate the pathway efficiency under cold stress in this experiment. Cold shock domain proteins can have inducible expression under cold stress conditions for cold acclimation, as seen in Arabidopsis and winter wheat (Fusaro et al. 2007, Karlson and Imai 2003, Karlson et al. 2002). Cold shock domain proteins do not accumulated during low temperature stress treatment in rice (Chaikam and Karlson 2008), and in the present study, the cold shock domain protein 1 (Q6YUR8) down-regulated both at 48 h and 72 h cold stress treatments (Tables 1–3). Thus, the protein might have different regulation in different rice varieties, which have different resistant levels to cold stress. These correlative data support the notion that the protein might involved in the cold acclimation response.
Interesting, in the 289 DEPs, only 11 proteins continued to be up-regulated and 11 proteins continued to be down-regulated from 24 h to 72 h of cold stress treatment. These continuously regulated proteins during cold stress could play and important role for rice cold resistance. Three proteins (cell division cycle protein, GLO1 and GLO5) have been reported relative to cold stress in previous studies. Cell division cycle protein 48 (CDC48) is associated with leaf senescence and plant survival in rice (Huang et al. 2016), and a single base substitution in yeast CDC48 can change yeast sensitivity to cold stress and cause cell death (Madeo et al. 1997). A homolog of AtCDC48, AtOM66 which is located on the outer mitochondrial membrane in Arabidopsis plays a role in regulating cell death in response to biotic and abiotic stresses (Zhang et al. 2014). In the present study, CDC48 protein (Q10RP0) up-regulation may play role in enhancing survival of Kongyu131 by determining the progression of cell death during cold stress treatment. In a previous study, Glycolate oxidase (GLO) potentially interacted with catalase (CAT) to regulate H2O2 levels in rice under environmental stress or stimuli (Zhang et al. 2016). In the present study, GLO1 (Q10CE4) and GLO5 (Q6YT73) proteins up-regulation may affect H2O2 levels in Kongyu131 to enhance cold resistance. Although other DEPs identified in the work were not reported to function in cold stress response, these up- or down-regulated proteins under cold stress can now be annotated as “cold-regulated proteins”. The physiological functions of these DEPs will need to by fully characterized in future studies to enhance our understanding of cold stress responses in plants at the molecular level.
In conclusion, this study is the first to adopt iTRAQ-based quantitative proteomics approach to identify cold response proteins in cold-tolerance japonica rice cultivar Kongyu131. A total of 289 DEPs were identified in time courses cold stress treatment. Partial DEPs related to cold genes were also identified in this study, 14-3-3 proteins, cold shock domain protein, calcium-transporting ATPase, 6-phosphogluconate dehydrogenase, CDC48 protein and GLO1/5. Some unknown function DEPs were first be identified in this study, specially continue up-regulated proteins (Q0JN91, Q6YU90, B9F813, A0A0P0Y5F2) and continue down-regulated proteins (A0A0N7KH91, Q0D5S1) from 24 h to 72 h cold stress treatment may play an important role during cold tolerance of Kongyu131. Some DEPs were not identified in previous studies can provide candidate genes for biological function study to better understand the cold-tolerance mechanism of rice responses to cold stress. Uncover the function of these genes may provide candidate genes for cold-tolerance rice molecular breeding in future.
Author Contribution Statement
D.Q., G.D. (Gaoxing Dai) and G.D. (Guofu Deng) contributed to experimental design. D.Q. and K.L. contributed to the protein extraction, peptide preparation, iTRAQ labeling experiments and analyzed the quantitative proteomics data; Y.P. and L.G. contributed to Q-PCR experiment; Y.P., H.L., W.C., C.L. and J.H. contributed to the rice cold stress treatment experiment; W.Z., J.G., J.L. and H.W. contributed to the western blot experiment; D.Q., G.D. (Guofu Deng) and G.D. (Gaoxing Dai) wrote the manuscript; G.D. (Gaoxing Dai) contributed to modification of the manuscript.
Acknowledgments
This work was supported by the National Natural Science Foundation of China (grant no. 31960059, 31960401, U20A2032), Guangxi Natural Science Foundation (grant no. 2017GXNSFAA198266, 2018GXNSFAA050128), Guangxi Science and Technology Base and Special Talents (grant no. GuiKe AD18281069, GuiKe AD18050002, GuiKe AD17129064), Science-Technology Development Funding of Guangxi Academy of Agricultural Science (grant no. 31960059, 2021JM23, GuiNongKe2020YM124), Guangxi Talent High Land of High Quality Breeding Research (grant no. Talent High Land QN-27). We thank Dr. Caren Chang (University of Maryland) for proofreading the manuscript.
Literature Cited
- Agrawal, G.K. and R. Rakwal (2011) Rice proteomics: A move toward expanded proteome coverage to comparative and functional proteomics uncovers the mysteries of rice and plant biology. Proteomics 11: 1630–1649.
- Baunsgaard, L., A.T. Fuglsang, T. Jahn, H.A. Korthout, A.H. de Boer and M.G. Palmgren (1998) The 14-3-3 proteins associate with the plant plasma membrane H(+)-ATPase to generate a fusicoccin binding complex and a fusicoccin responsive system. Plant J 13: 661–671.
- Binh, L.T. and K. Oono (1992) Molecular cloning and characterization of genes related to chilling tolerance in rice. Plant Physiol 99: 1146–1150.
- Cen, W., J. Liu, S. Lu, P. Jia, K. Yu, Y. Han, R. Li and J. Luo (2018) Comparative proteomic analysis of QTL CTS-12 derived from wild rice (Oryza rufipogon Griff.), in the regulation of cold acclimation and de-acclimation of rice (Oryza sativa L.) in response to severe chilling stress. BMC Plant Biol 18: 163.
- Chaikam, V. and D. Karlson (2008) Functional characterization of two cold shock domain proteins from Oryza sativa. Plant Cell Environ 31: 995–1006.
- Chen, F., Q. Li, L. Sun and Z. He (2006) The rice 14-3-3 gene family and its involvement in responses to biotic and abiotic stress. DNA Res 13: 53–63.
- Chen, L., Y. Zhao, S. Xu, Z. Zhang, Y. Xu, J. Zhang and K. Chong (2018) OsMADS57 together with OsTB1 coordinates transcription of its target OsWRKY94 and D14 to switch its organogenesis to defense for cold adaptation in rice. New Phytol 218: 219–231.
- Cooper, B. (2001) Collateral gene expression changes induced by distinct plant viruses during the hypersensitive resistance reaction in Chenopodium amaranticolor. Plant J 26: 339–349.
- Cooper, B., J.D. Clarke, P. Budworth, J. Kreps, D. Hutchison, S. Park, S. Guimil, M. Dunn, P. Luginbühl, C. Ellero et al. (2003) A network of rice genes associated with stress response and seed development. Proc Natl Acad Sci USA 100: 4945–4950.
- Cui, S., F. Huang, J. Wang, X. Ma, Y. Cheng and J. Liu (2005) A proteomic analysis of cold stress responses in rice seedlings. Proteomics 5: 3162–3172.
- Fan, S., D. Zhang, C. Lei, H. Chen, L. Xing, J. Ma, C. Zhao and M. Han (2016) Proteome analyses using iTRAQ labeling reveal critical mechanisms in alternate bearing malus prunifolia. J Proteome Res 15: 3602–3616.
- Fusaro, A.F., S.N. Bocca, R.L.B. Ramos, R.M. Barrôco, C. Magioli, V.C. Jorge, T.C. Coutinho, C.M. Rangel-Lima, R.D. Rycke and D. Inzé (2007) AtGRP2, a cold-induced nucleo-cytoplasmic RNA-binding protein, has a role in flower and seed development. Planta 225: 1339–1351.
- González-Schain, N., I. Roig-Villanova and M.M. Kater (2019) Early cold stress responses in post-meiotic anthers from tolerant and sensitive rice cultivars. Rice (N Y) 12: 94.
- Guo, G. and N. Li (2011) Relative and accurate measurement of protein abundance using 15N stable isotope labeling in Arabidopsis (SILIA). Phytochemistry 72: 1028–1039.
- Guo, X., D. Liu and K. Chong (2018) Cold signaling in plants: Insights into mechanisms and regulation. J Integr Plant Biol 60: 7–18.
- Hashimoto, M. and S. Komatsu (2007) Proteomic analysis of rice seedlings during cold stress. Proteomics 7: 1293–1302.
- Hou, F.Y., J. Huang, S.L. Yu and H.S. Zhang (2007) The 6-phosphogluconate dehydrogenase genes are responsive to abiotic stresses in rice. J Integr Plant Biol 49: 655–663.
- Huang, Q.N., Y.F. Shi, X.B. Zhang, L.X. Song, B.F. Feng, H.M. Wang, X. Xu, X.H. Li, D. Guo and J.L. Wu (2016) Single base substitution in OsCDC48 is responsible for premature senescence and death phenotype in rice. J Integr Plant Biol 58: 12–28.
- Huo, C., B. Zhang, H. Wang, F. Wang, M. Liu, Y. Gao, W. Zhang, Z. Deng, D. Sun and W. Tang (2016) Comparative study of early cold-regulated proteins by two-dimensional difference gel electrophoresis reveals a key role for phospholipase dalpha1 in mediating cold acclimation signaling pathway in rice. Mol Cell Proteomics 15: 1397–1411.
- Imin, N., T. Kerim, J.J. Weinman and B.G. Rolfe (2006) Low temperature treatment at the young microspore stage induces protein changes in rice anthers. Mol Cell Proteomics 5: 274–292.
- Ji, L., P. Zhou, Y. Zhu, F. Liu, R. Li and Y. Qiu (2017) Proteomic analysis of rice seedlings under cold stress. Protein J 36: 299–307.
- Jin, Y.M., R. Piao, Y.F. Yan, M. Chen, L. Wang, H. He, X. Liu, X.A. Gao, W. Jiang and X.F. Lin (2018) Overexpression of a new zinc finger protein transcription factor OsCTZFP8 improves cold tolerance in rice. Int J Genomics 2018: 1–13.
- Karlson, D., K. Nakaminami, T. Toyomasu and R. Imai (2002) A cold-regulated nucleic acid-binding protein of winter wheat shares a domain with bacterial cold shock proteins. J Biol Chem 277: 35248–35256.
- Karlson, D. and R. Imai (2003) Conservation of the cold shock domain protein family in plants. Plant Physiol 131: 12–15.
- Khush, G.S. (2005) What it will take to feed 5.0 billion rice consumers in 2030. Plant Mol Biol 59: 1–6.
- Lee, D.G., N. Ahsan, S.H. Lee, J.J. Lee, J.D. Bahk, K.Y. Kang and B.H. Lee (2009) Chilling stress-induced proteomic changes in rice roots. J Plant Physiol 166: 1–11.
- Leyva, A., J.A. Jarillo, J. Salinas and J.M. Martinez-Zapater (1995) Low temperature induces the accumulation of Phenylalanine Ammonia-Lyase and Chalcone Synthase mRNAs of Arabidopsis thaliana in a light-dependent manner. Plant Physiol 108: 39–46.
- Li, J., Y. Zeng, Y. Pan, L. Zhou, Z. Zhang, H. Guo, Q. Lou, G. Shui, H. Huang, H. Tian et al. (2021) Stepwise selection of natural variations at CTB2 and CTB4a improves cold adaptation during domestication of japonica rice. New Phytol 231: 1056–1072.
- Liu, C., S. Ou, B. Mao, J. Tang, W. Wang, H. Wang, S. Cao, M.R. Schläppi, B. Zhao, G. Xiao et al. (2018) Early selection of bZIP73 facilitated adaptation of japonica rice to cold climates. Nat Commun 9: 3302.
- Luo, W., Q. Huan, Y. Xu, W. Qian, K. Chong and J. Zhang (2021) Integrated global analysis reveals a vitamin E-vitamin K1 sub-network, downstream of COLD1, underlying rice chilling tolerance divergence. Cell Rep 36: 109397.
- Ma, Y., X. Dai, Y. Xu, W. Luo, X. Zheng, D. Zeng, Y. Pan, X. Lin, H. Liu, D. Zhang et al. (2015) COLD1 confers chilling tolerance in rice. Cell 160: 1209–1221.
- Madeo, F., E. Fröhlich and K.U. Fröhlich (1997) A yeast mutant showing diagnostic markers of early and late apoptosis. J Cell Biol 139: 729–734.
- Manishankar, P. and J. Kudla (2015) Cold tolerance encoded in one SNP. Cell 160: 1045–1046.
- Maraña, C., F. García-Olmedo and P. Carbonero (1990) Differential expression of two types of sucrose synthase-encoding genes in wheat in response to anaerobiosis, cold shock and light. Gene 88: 167–172.
- Marrs, K.A. (1996) The functions and regulation of glutathione S-transferases in plants. Annu Rev Plant Physiol Plant Mol Biol 47: 127–158.
- Neilson, K.A., M. Mariani and P.A. Haynes (2011) Quantitative proteomic analysis of cold-responsive proteins in rice. Proteomics 11: 1696–1706.
- Nijat, I., K. Tursun, G.R. Barry and J.W. Jeremy (2004) Effect of early cold stress on the maturation of rice anthers. Proteomics 4: 1873–1882.
- Pradhan, S.K., S.R. Barik, A. Sahoo, S. Mohapatra, D.K. Nayak, A. Mahender, J. Meher, A. Anandan and E. Pandit (2016) Population structure, genetic diversity and molecular marker-trait association analysis for high temperature stress tolerance in rice. PLoS One 11: e0160027.
- Qing, D., Z. Yang, M. Li, W.S. Wong, G. Guo, S. Liu, H. Guo and N. Li (2016) Quantitative and functional phosphoproteomic analysis reveals that ethylene regulates water transport via the C-terminal phosphorylation of aquaporin PIP2;1 in Arabidopsis. Mol Plant 9: 158–174.
- Ross, P.L., Y.N. Huang, J.N. Marchese, B. Williamson, K. Parker, S. Hattan, N. Khainovski, S. Pillai, S. Dey, S. Daniels et al. (2004) Multiplexed protein quantitation in Saccharomyces cerevisiae using amine-reactive isobaric tagging reagents. Mol Cell Proteomics 3: 1154–1169.
- Roxas, V.P., R.K. Smith, E.R. Allen and R.D. Allen (1997) Overexpression of glutathione S-transferase/glutathione peroxidase enhances the growth of transgenic tobacco seedlings during stress. Nat Biotechnol 15: 988–991.
- Sanchez-Ballesta, M.T., M.T. Lafente, L. Zacarias and A. Granell (2000) Involvement of phenylalanine ammonia-lyase in the response of Fortune mandarin fruits to cold temperature. Physiol Plant 108: 382–389.
- Sehnke, P.C., R. Henry, K. Cline and R.J. Ferl (2000) Interaction of a plant 14-3-3 protein with the signal peptide of a thylakoid-targeted chloroplast precursor protein and the presence of 14-3-3 isoforms in the chloroplast stroma. Plant Physiol 122: 235–242.
- Singh, A., P. Kanwar, A.K. Yadav, M. Mishra, S.K. Jha, V. Baranwal, A. Pandey, S. Kapoor, A.K. Tyagi and G.K. Pandey (2014) Genome-wide expressional and functional analysis of calcium transport elements during abiotic stress and development in rice. FEBS J 281: 894–915.
- Sun, J., L. Yang, J. Wang, H. Liu, H. Zheng, D. Xie, M. Zhang, M. Feng, Y. Jia, H. Zhao et al. (2018) Identification of a cold-tolerant locus in rice (Oryza sativa L.) using bulked segregant analysis with a next-generation sequencing strategy. Rice (N Y) 11: 24.
- Tian, Q., S.B. Stepaniants, M. Mao, L. Weng, M.C. Feetham, M.J. Doyle, E.C. Yi, H.Y. Dai, V. Thorsson, J. Eng et al. (2004) Integrated genomic and proteomic analyses of gene expression in mammalian cells. Mol Cell Proteomics 3: 960–969.
- Wang, D., J. Liu, C. Li, H. Kang, Y. Wang, X. Tan, M. Liu, Y. Deng, Z. Wang, Y. Liu et al. (2016) Genome-wide association mapping of cold tolerance genes at the seedling stage in rice. Rice (N Y) 9: 61.
- Wang, J., J. Wang, X. Wang, R. Li and B. Chen (2018a) Proteomic response of hybrid wild rice to cold stress at the seedling stage. PLoS One 13: e0198675.
- Wang, K., Z. Yang, D. Qing, F. Ren, S. Liu, Q. Zheng, J. Liu, W. Zhang, C. Dai, M. Wu et al. (2018b) Quantitative and functional posttranslational modification proteomics reveals that TREPH1 plays a role in plant touch-delayed bolting. Proc Natl Acad Sci USA 115: E10265–E10274.
- Wu, Y., M. Mirzaei, D. Pascovici, J. Chick, B.J. Atwell and P.A. Haynes (2016) Quantitative proteomic analysis of two different rice varieties reveals that drought tolerance is correlated with reduced abundance of photosynthetic machinery and increased abundance of ClpD1 protease. J Proteomics 143: 73–82.
- Yan, S.P., Q.Y. Zhang, Z.C. Tang, W.A. Su and W.N. Sun (2006) Comparative proteomic analysis provides new insights into chilling stress responses in rice. Mol Cell Proteomics 5: 484–496.
- Zhang, B., O. Van Aken, L. Thatcher, I. De Clercq, O. Duncan, S.R. Law, M.W. Murcha, M. van der Merwe, H.S. Seifi, C. Carrie et al. (2014) The mitochondrial outer membrane AAA ATPase AtOM66 affects cell death and pathogen resistance in Arabidopsis thaliana. Plant J 80: 709–727.
- Zhang, M., J. Ye, Q. Xu, Y. Feng, X. Yuan, H. Yu, Y. Wang, X. Wei and Y. Yang (2018) Genome-wide association study of cold tolerance of Chinese indica rice varieties at the bud burst stage. Plant Cell Rep 37: 529–539.
- Zhang, Z., Y. Xu, Z. Xie, X. Li, Z.H. He and X.X. Peng (2016) Association-dissociation of glycolate oxidase with catalase in rice: A potential switch to modulate intracellular H2O2 levels. Mol Plant 9: 737–748.
- Zhang, Z., J. Li, Y. Pan, J. Li, L. Zhou, H. Shi, Y. Zeng, H. Guo, S. Yang, W. Zheng et al. (2017) Natural variation in CTB4a enhances rice adaptation to cold habitats. Nat Commun 8: 14788.
- Zhao, J., S. Zhang, J. Dong, T. Yang, X. Mao, Q. Liu, X. Wang and B. Liu (2017) A novel functional gene associated with cold tolerance at the seedling stage in rice. Plant Biotechnol J 15: 1141–1148.
- Zhao, X., F. Li and K. Li (2021) The 14-3-3 proteins: regulators of plant metabolism and stress responses. Plant Biol 23: 531–539.

