Abstract
A total of four populations of reciprocal backcross recombinant inbred lines were produced from a cross between a wild accession of Oryza rufipogon W630 and two major cultivars, O. sativa Japonica Nipponbare and Indica IR36. Using these populations, quantitative trait locus (QTL) analysis for eight morphological traits (culm length, panicle length, days to heading, panicle shape, pericarp color, hull color, seed shattering and seed awning) was carried out, and the putative QTL regions were compared among the populations. The QTLs with strong allele effects were commonly detected for culm length, panicle shape, pericarp color and hull color in all four populations, and their peak locations were close to the major genes of sd1, Spr3, Rc and Bh4, respectively. For panicle length and days to heading, some QTL regions overlapped between two or three populations. In the case of seed shattering and seed awning, strong wild allele effects at major loci were observed only in the populations with cultivated backgrounds. Since the wild and cultivated alleles have never been evaluated in the reciprocal genetic backgrounds, the present results provide new information on gene effects in breeding and domestication studies.
Introduction
The genus Oryza consists of two cultivated species and more than 20 wild species (Vaughan 1994). Among them, the Asian wild species of O. rufipogon Griff. is an ancestral species of the common rice, O. sativa L. (Oka 1988). As this wild species readily crosses with the cultivated rice, many studies have identified useful genes and domestication-related genes using the segregating populations.
For example, dominant genes for grassy stunt virus resistance and blast resistance were transferred to rice cultivars from O. nivara, the annual form of O. rufipogon, (Ballini et al. 2007, Khush and Ling 1974), which are applied in rice breeding programs. Regarding domestication-related traits, seed-shattering behavior was found to be mainly controlled by a wild rice allele at sh4 (Li et al. 2006), and seed awning was associated with three major loci of An-1, LABA1 and RAE2 (Bessho-Uehara et al. 2016, Hua et al. 2015, Luo et al. 2013). These traits are controlled by dominant genes in wild rice and can be phenotypically identified in the genetic background of cultivated rice. On the other hand, quantitative traits such as yield and plant size are associated with many genes, and their manner of inheritance is very complicated. Previously, wild alleles at some loci were estimated for high yield by QTL analysis (Xiao et al. 1996), however, wild responsible genes have not been identified so far. These results indicate that wild allele effects are different according to the traits and related loci.
In the genetic background of wild rice, allele replacement does not always affect wild phenotypes. In the case of seed-shattering behavior, cultivated loss-of-function alleles at sh4 did not cause non-shattering phenotypes in wild rice (Ishikawa et al. 2010). Also, at seed awning loci An-1, LABA1 and RAE2, cultivated alleles did not strongly influence awn length reduction in wild rice (Amarasinghe et al. 2020a, Ikemoto et al. 2017). Some other minor loci are probably associated with these traits in the genetic background of wild rice, suggesting that the allele effects may differ between the respective genetic backgrounds of wild rice and cultivated rice.
Gene introgression is the incorporation of a gene of one species into the gene pool of another. This process is usually generated by backcrossing with one parental species after interspecific hybridization. In rice breeding, gene introgression from wild species is important for transferring useful traits into rice cultivars (Jena 2010). In domestication studies, the performance of cultivated loss-of-function alleles in the wild genetic background is useful for understanding the domestication process (Konishi et al. 2006, Li et al. 2006). Therefore, it is necessary to clarify the association between phenotypic traits and loci in the different genetic backgrounds. In this study, we produced reciprocal backcross populations between O. rufipogon and two major rice cultivars, O. sativa Japonica Nipponbare and Indica IR36, and QTL analysis was carried out to examine the wild and cultivated allele effects on several qualitative and quantitative traits. Since the wild and cultivated allele effects have never been evaluated in the reciprocal genetic backgrounds, the present results will provide new information for both studies on breeding and domestication.
Materials and Methods
Plant materials
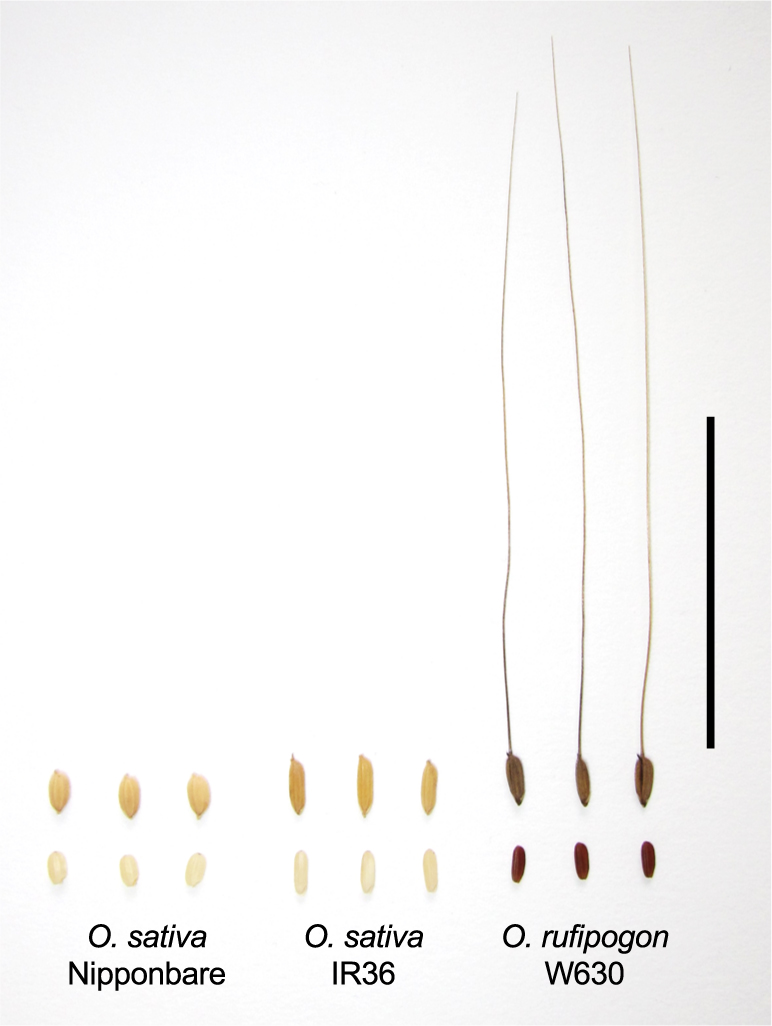
Two cultivars of O. sativa Japonica Nipponbare and Indica IR36, and a wild accession of O. rufipogon W630 were used in this study. Nipponbare and IR36 are popular Japonica and Indica rice cultivars, respectively. O. rufipogon W630 is an annual accession originated from Myanmar. It produces awned spikelets on the spreading panicles and disperses the mature seeds (Fig. 1) (Amarasinghe et al. 2020b). Its pericarp and hull colors are red and black, respectively, while the two cultivars have straw-colored seeds with white pericarp (Fig. 2). The wild accession was kindly provided by the National Institute of Genetics, Japan.

The interspecific F1 plants were first produced between the wild accession and the two cultivars. They were reciprocally backcrossed twice to both parents, and the following four combinations of backcross recombinant inbred lines (BRILs) were developed by the single-seed-descendant method (Fig. 3). In this study, abbreviations of “N”, “IR” and “As” were given for Nipponbare, IR36 and Asian wild rice, O. rufipogon W630, respectively. In addition, “AsN” indicates Asian wild rice, O. rufipogon W630, backcrossed with O. sativa Nipponbare. Namely, the first and the last abbreviations show the donor and the recurrent parents, respectively.
AsN population: 159 lines at BC2F8 generation between W630 (donor parent) and Nipponbare (recurrent parent)
NAs population: 143 lines at BC2F6 generation between Nipponbare (donor parent) and W630 (recurrent parent)
AsIR population: 170 lines at BC2F8 generation between W630 (donor parent) and IR36 (recurrent parent)
IRAs population: 146 lines at BC2F7 generation between IR36 (donor parent) and W630 (recurrent parent)
Trait evaluation
All four BRIL populations were grown in the paddy field of Kobe University, Japan. Their seedlings were transplanted in the first week of June. For AsN and AsIR populations with cultivated genetic backgrounds, they were planted in the plot with seven plants per row (20 cm between plants, 25 cm between rows). On the other hand, the seedlings of NAs and IRAs populations were planted at wider spacing of six plants per row (25 cm between plants, 30 cm between rows) because of their prostrate growth. After maturation, the following eight quantitative and qualitative traits were examined.
Culm length: Length from ground to the panicle neck of the main stem (cm).
Panicle length: Panicle length of the main stem (cm).
Days to heading: Days from seed soaking to heading of the first panicle.
Panicle shape: Scale of 0–2 (0: closed, 1: intermediate, 2: open).
Pericarp color: Scale of 0–2 (0: white, 1: intermediate, 2: red).
Hull color: Scale of 0–2 (0: straw, 1: intermediate, 2: black).
Seed shattering: Scale of 0–2 (0: non-shattering, 1: intermediate, 2: shattering) for AsN, NAs and IRAs populations. Average breaking tensile strength (gram-force: gf) value to detach a grain from the pedicel using a digital force gauge (FGP 0.5, Nidec-Shimpo Co., Japan) for AsIR population.
Seed awning: Scale of 0–3 (0: <1 mm, 1: 1–5 mm, 2: 5–15 mm, 3: 15 mm<) examined for average awn length of 1st spikelet on the top primary branch (n = 5).
QTL analysis
In each population, young leaves were collected from the BRIL plants, from which their genomic DNA samples were isolated by a potassium acetate method (Dellaporta et al. 1983). In total, 177 polymorphic simple sequence repeat (SSR) markers between O. sativa Nipponbare and O. rufipogon W630 were used to examine BRIL genotypes in AsN and NAs populations (Supplemental Tables 1, 2). On the other hand, 163 and 156 polymorphic SSR markers between O. sativa IR36 and O. rufipogon W630 were used for AsIR and IRAs populations, respectively (Supplemental Tables 3, 4). Of these markers, 141 markers were common among the four populations. Primer sequences of the SSR markers were obtained from the Gramene database (Liang et al. 2008). After PCR, the amplified products were electrophoresed in 4% polyacrylamide denaturing gel. The microsatellite banding patterns were visualized using the silver staining method (Panaud et al. 1996).
Based on the marker and trait data, QTL analysis was carried out with molecular linkage map information after Thanh et al. (2010). For the metric trait data, a putative QTL was estimated by composite interval mapping with WinQTL Cartographer software version 2.5 (Wang et al. 2007). The optimal log of odds (LOD) threshold values were calculated by 1000 permutation tests. For the ordinal data (scored by scales), a single-marker regression analysis was carried out with QGene version 4.3 (Joehanes and Nelson 2008), and a putative QTL was estimated based on the threshold LOD value of 3.0.
Results
Percentages of introgressed chromosomal segments in the BRIL populations
The four BRIL populations were generated from the BC2F1 plants by the single-seed-descendant method (Fig. 3). Theoretically, the BRILs have 1/8 (12.5%) of the donor genome in the genetic background of the recurrent parent. Based on the marker genotypes at microsatellite loci across the 12 rice chromosomes (177, 177, 163 and 156 loci for AsN, NAs, AsIR and IRAs populations, respectively), the donor chromosomal segments in each line were estimated (Supplemental Tables 1–4). In the genetic background of the cultivated rice, the percentages of wild segments among lines ranged from 0.0% to 23.3% (average = 11.0%) and from 0.0% to 22.6% (average = 10.0%) in the AsN and AsIR populations, respectively (Supplemental Table 5). Some lines did not have donor alleles in the marker survey, but they showed different phenotypes from the recurrent parent. Therefore, they were included in the QTL analysis. On the other hand, the percentages of cultivated segments ranged from 1.1% to 31.3% (average = 11.5%) and from 1.3% to 30.5% (average = 14.9%) in the NAs and IRAs populations, respectively (Supplemental Table 5). These values are close to the theoretical percentage of 12.5%. In addition, donor alleles were detected at all SSR marker loci without gaps (Supplemental Tables 1–5). Several marker loci were found to have much less donor alleles (<2.5%), but their common chromosomal regions were not detected among four populations. Instead, RM273 on chromosome 4 showed the highest ratios of cultivated alleles in the wild genetic backgrounds; 24.5% in NAs and 42.8% in IRAs populations. At the same locus, the wild allele ratios were relatively low in AsN (5.0%) and AsIR (5.9%), suggesting that an advantageous chromosomal region for cultivated alleles might exist near the RM273 locus. The average homozygosity values were higher than 98.5% (Supplemental Table 5), indicating that the BRILs are almost fixed lines in the four populations.
Phenotypic variation in the BRIL populations
Fig. 4 shows the frequency distributions of culm length in the four BRIL populations. The distributions were discontinuous and almost bell-shaped. Several plants with a culm length greater than 120 cm were observed in the AsIR population. In all four populations, many lines had the values outside the range of the parent culm lengths. Discontinuous distributions were observed for panicle length and days to heading (Supplemental Figs. 1, 2). Transgressive variation was also detected in all the populations.
Panicle shape, pericarp color and hull color clearly differed between wild and cultivated rice plants. These domestication-related traits were measured in the scale of 0–2 (0: cultivar type, 1: intermediate type, 2: wild type) (Table 1). In the AsN and AsIR populations with cultivated genetic background, most of the lines showed cultivar phenotypes. Conversely, wild phenotypes were frequently observed in the NAs and IRAs populations with wild background.
Table 1.
Segregation of five morphological traits (panicle shape, pericarp color, hull color, seed shattering and seed awing) with ordinal scales in four backcross recombinant inbred lines, AsN, NAs, AsIR and IRAs populations
| Trait |
Population |
No. of lines |
Total |
| 0 |
1 |
2 |
3 |
n.d.a |
| Panicle shape |
AsN |
116 |
6 |
37 |
|
0 |
159 |
|
NAs |
13 |
0 |
126 |
|
4 |
143 |
|
AsIR |
134 |
14 |
22 |
|
0 |
170 |
|
IRAs |
32 |
0 |
114 |
|
0 |
146 |
| Pericarp color |
AsN |
145 |
2 |
12 |
|
0 |
159 |
|
NAs |
10 |
13 |
119 |
|
1 |
143 |
|
AsIR |
141 |
12 |
17 |
|
0 |
170 |
|
IRAs |
20 |
5 |
121 |
|
0 |
146 |
| Hull color |
AsN |
155 |
4 |
0 |
|
0 |
159 |
|
NAs |
5 |
43 |
93 |
|
2 |
143 |
|
AsIR |
154 |
6 |
10 |
|
0 |
170 |
|
IRAs |
3 |
65 |
77 |
|
1 |
146 |
| Seed shattering |
NAs |
0 |
1 |
141 |
|
1 |
143 |
|
IRAs |
0 |
2 |
144 |
|
0 |
146 |
| Seed awning |
NAs |
0 |
0 |
0 |
143 |
0 |
143 |
|
AsIR |
63 |
48 |
41 |
18 |
0 |
170 |
|
IRAs |
0 |
0 |
0 |
146 |
0 |
146 |
Previously, we analyzed seed shattering and seed awning characters using the AsN population (Ikemoto et al. 2017, Ishikawa et al. 2010). These traits were further examined in other three populations (Table 1). In the NAs and IRAs populations with wild genetic background, almost all the lines showed wild phenotypes for seed shattering and seed awning. In the AsIR population, seed shattering was measured based on the average breaking tensile strength using 60 spikelets (20 spikelets from three panicles of each line) about seven weeks after flowering, and their average values were calculated (Supplemental Fig. 3). Seed awning was evaluated in the scale of 0–3 based on the awn length. A total of 63 lines were awnless (<1 mm), whereas the other 107 lines had seeds with different awn lengths (Table 1).
QTL analysis for eight morphological traits in the BRIL populations
Based on the marker and trait data, QTL analysis was carried out with the linkage map information after Thanh et al. (2010). For the metric trait data, composite interval mapping was used to detect putative QTLs (Table 2). In the analysis of culm length, three, two, one and three QTLs were estimated for the AsN, NAs, AsIR and IRAs populations, respectively. Among them, one QTL on chromosome 1 was commonly detected with high LOD values. Regarding panicle length, one QTL was detected in each of the AsN and AsIR populations having the cultivated genetic background. On the other hand, five and four QTLs were estimated in the wild NAs and IRAs populations, respectively. Only a QTL detected on chromosome 7 in the NAs population had a LOD higher than 10. For days to heading, one to five QTLs were estimated in the four populations, however the positions of QTLs with the highest LOD values were different in each population. These QTLs were detected on chromosomes 3, 1, 8 and 6 in the AsN, NAs, AsIR and IRAs populations, respectively. For seed shattering in the AsIR population, two QTLs were estimated on chromosomes 3 and 4.
Table 2.
Putative QTLs for the four traits (culm length, panicle length, days to heading and seed shattering) with metric data detected in four backcross recombinant inbred lines, AsN, NAs, AsIR and IRAs populations
| Trait |
Population |
Chr. |
Location |
Nearest marker |
LOD |
PVa |
Additive effectb |
Reference |
| Culm length (cm) |
AsN |
1 |
RM315 - RM104 |
RM431 |
11.2 |
19.3 |
9.6 |
|
|
|
4 |
RM255 - RM559 |
RM5506 |
9.6 |
17.2 |
7.2 |
|
|
|
5 |
RM440 - RM538 |
RM173 |
9.4 |
17.6 |
8.3 |
|
|
NAs |
1 |
RM315 - RM104 |
RM431 |
5.3 |
18.2 |
6.9 |
|
|
|
7 |
RM51 - RM125 |
RM82 |
7.2 |
17.6 |
–6.2 |
|
|
AsIR |
1 |
RM315 - RM431 |
RM431 |
50.8 |
75.2 |
26.3 |
|
|
IRAs |
1 |
RM84 - RM272 |
RM1 |
5.0 |
8.8 |
–6.4 |
|
|
|
1 |
RM315 - RM104 |
RM431 |
20.7 |
42.3 |
20.4 |
|
|
|
7 |
RM51 - RM125 |
RM481 |
8.3 |
19.9 |
–10.2 |
|
| Panicle length (cm) |
AsN |
5 |
RM440 - RM538 |
RM421 |
5.3 |
13.8 |
1.7 |
|
|
NAs |
1 |
RM212 - RM315 |
RM265 |
3.3 |
6.9 |
1.1 |
|
|
|
3 |
RM7 - RM282 |
RM251 |
3.3 |
8.2 |
1.3 |
|
|
|
4 |
RM252 - RM241 |
RM241 |
3.2 |
5.6 |
–0.8 |
|
|
|
6 |
RM162 - RM412 |
RM528 |
5.3 |
16.5 |
1.6 |
|
|
|
7 |
RM451 - RM125 |
RM427 |
12.3 |
36.2 |
–2.7 |
|
|
AsIR |
1 |
RM315 - RM104 |
RM431 |
9.6 |
21.9 |
3.8 |
|
|
IRAs |
1 |
RM272 - RM23 |
RM243 |
7.1 |
15.2 |
–1.6 |
|
|
|
1 |
RM315 - RM104 |
RM315 |
5.9 |
14.0 |
2.9 |
|
|
|
7 |
RM51 - RM125 |
RM481 |
9.3 |
15.5 |
–2.0 |
|
|
|
10 |
RM474 - RM244 |
RM222 |
5.2 |
11.3 |
1.6 |
|
| Days to heading |
AsN |
2 |
RM221 - RM240 |
RM6 |
4.1 |
5.1 |
2.8 |
Thanh et al. (2010) |
|
|
3 |
RM135 - RM227 |
RM571 |
26.8 |
44.1 |
9.0 |
Thanh et al. (2010) |
|
|
8 |
RM3819 - RM44 |
RM25 |
11.4 |
18.3 |
5.4 |
Thanh et al. (2010) |
|
|
10 |
RM484 - RM228 |
RM228 |
7.0 |
9.0 |
4.0 |
Thanh et al. (2010) |
|
NAs |
1 |
RM272 - RM580 |
RM259 |
13.7 |
36.9 |
–5.8 |
|
|
|
6 |
RM587 - RM253 |
RM225 |
8.9 |
17.6 |
–8.2 |
|
|
|
12 |
RM463 - RM235 |
RM235 |
3.7 |
6.7 |
2.1 |
|
|
AsIR |
8 |
RM3819 - RM44 |
RM25 |
29.0 |
58.7 |
13.7 |
|
|
IRAs |
1 |
RM272 - RM243 |
RM259 |
5.5 |
7.7 |
–2.3 |
|
|
|
3 |
RM55 - RM227 |
RM571 |
4.8 |
5.2 |
–2.5 |
|
|
|
6 |
RM133 - RM253 |
RM204 |
19.3 |
26.0 |
–12.3 |
|
|
|
6 |
RM253 - RM3 |
RM539 |
17.3 |
23.7 |
5.1 |
|
|
|
8 |
RM38 - RM44 |
RM25 |
10.9 |
18.1 |
5.0 |
|
| Seed shattering (gf) |
AsIR |
3 |
RM411 - RM55 |
RM168 |
4.0 |
7.2 |
–8.2 |
|
|
|
4 |
RM255 - RM559 |
RM131 |
21.3 |
44.2 |
–16.9 |
|
a Percentage of the phenotypic variance explained by the QTL.
b Additive effect of the wild allele.
For the traits with ordinal data, a single-marker regression analysis was carried out to detect the level of linkage between the traits and markers (Table 3). In the analysis of panicle shape, pericarp color and hull color, at least one QTL was detected in each population. Of these, QTLs with the highest LOD values in the four populations were common for panicle shape (chromosome 4), pericarp color (chromosome 7) and hull color (chromosome 4). Regarding seed shattering and seed awning, two QTLs each were detected in the AsN and AsIR populations. No QTLs were estimated in the NAs and IRAs populations, because almost all the lines showed wild phenotypes.
Table 3.
Putative QTLs for the five traits (panicle shape, pericarp color, hull color, seed shattering and seed awning) with ordinal data detected in four backcross recombinant inbred lines, AsN, NAs, AsIR and IRAs populations
| Trait |
Population |
Chr. |
Location |
Nearest marker |
LOD |
PVa |
Reference |
| Panicle shape |
AsN |
4 |
RM241 - RM559 |
RM5506 |
48.6 |
75.5 |
Ishii et al. (2013) |
|
NAs |
2 |
RM53 - RM8 |
RM8 |
5.8 |
17.4 |
|
|
|
4 |
RM255 - RM559 |
RM5506 |
35.3 |
68.9 |
|
|
AsIR |
4 |
RM273 |
RM273 |
3.7 |
9.5 |
|
|
|
4 |
RM303 - RM559 |
RM5506 |
28.4 |
53.7 |
|
|
IRAs |
4 |
RM273 - RM559 |
RM5506 |
33.3 |
65.0 |
|
|
|
9 |
RM205 |
RM205 |
3.1 |
9.4 |
|
| Pericarp color |
AsN |
1 |
RM259 |
RM259 |
3.3 |
9.1 |
|
|
|
4 |
RM273 - RM241 |
RM273 |
4.8 |
12.9 |
|
|
|
7 |
RM125 - RM346 |
RM125 |
19.2 |
42.7 |
|
|
NAs |
1 |
RM9 - RM246 |
RM5 |
6.3 |
18.6 |
|
|
|
4 |
RM417 |
RM417 |
4.1 |
12.5 |
|
|
|
7 |
RM125 - RM2 |
RM125 |
13.7 |
35.8 |
|
|
AsIR |
7 |
RM481 - RM2 |
RM125 |
47.9 |
72.6 |
|
|
IRAs |
7 |
RM51 - RM346 |
RM125 |
40.9 |
72.5 |
|
| Hull color |
AsN |
4 |
RM142 - RM241 |
RM252 |
10.7 |
26.7 |
|
|
|
7 |
RM82 - RM125 |
RM125 |
8.4 |
21.6 |
|
|
NAs |
4 |
RM185 - RM303 |
RM273 |
26.9 |
58.4 |
|
|
AsIR |
4 |
RM273 - RM303 |
RM273 |
12.0 |
27.7 |
|
|
|
7 |
RM214 |
RM214 |
3.0 |
7.8 |
|
|
IRAs |
4 |
RM273 - RM131 |
RM273 |
29.2 |
60.4 |
|
|
|
10 |
RM258 |
RM258 |
3.2 |
9.5 |
|
| Seed shattering |
AsN |
1 |
RM212 - RM315 |
RM315 |
6.6 |
15.2 |
Ishikawa et al. (2010) |
|
|
4 |
RM349 - RM131 |
RM131 |
5.3 |
12.3 |
Ishikawa et al. (2010) |
| Seed awning |
AsN |
4 |
RM437B - RM401 |
RM401 |
3.4 |
9.5 |
Ikemoto et al. (2017) |
|
|
8 |
RM223 - RM502 |
RM256 |
11.7 |
28.8 |
Ikemoto et al. (2017) |
|
AsIR |
4 |
RM401 |
RM401 |
3.1 |
8.0 |
|
|
|
4 |
RM273 - RM241 |
RM252 |
5.0 |
12.6 |
|
a Percentage of the phenotypic variance explained by the QTL.
In the AsN population, QTL analysis for days to heading, panicle shape, seed shattering and seed awning was re-examined using the data sets of Thanh et al. (2010), Ishii et al. (2013), Ishikawa et al. (2010) and Ikemoto et al. (2017), respectively.
Discussion
In this study, putative QTLs were estimated for eight morphological traits using four BRIL populations between O. rufipogon and two typical rice cultivars, O. sativa Nipponbare and IR36. Since these four populations were derived from a single wild accession of W630, the candidate QTL regions are worth comparing to evaluate wild and cultivated allele effects in the different genetic backgrounds. The QTLs may be divided into two groups, as these candidate regions are assumed to be only in one population or are commonly overlapped in different populations.
For culm length, a total of nine QTLs were estimated in the four populations (Table 2). Of these, one on chromosome 1 was commonly detected with high LOD values in all populations (Fig. 5). In the candidate region, sd1 locus is located near the peaks. At this locus, rice cultivars were reported to have obtained alleles controlling plant architecture in domestication (Asano et al. 2011). In addition, IR36 has a loss-of-function allele causing semi-dwarfism (Sasaki et al. 2002). Therefore, the cultivated and wild allele effects were strongly reflected in both genetic backgrounds. On chromosome 7, the candidate regions were overlapped in the NAs and IRAs populations. The cultivated alleles probably contribute short culm structure in the wild genetic background. Similarly, two QTL regions for panicle length on chromosomes 1 and 7 were shared between the populations (Fig. 5). This suggests that the sd1 alleles may have influence on panicle length. The QTLs on chromosome 7 showed higher LOD values than those on chromosome 1, and the region was close to that detected for culm length. The cultivated alleles related to plant growth in the wild background may exist at this locus.
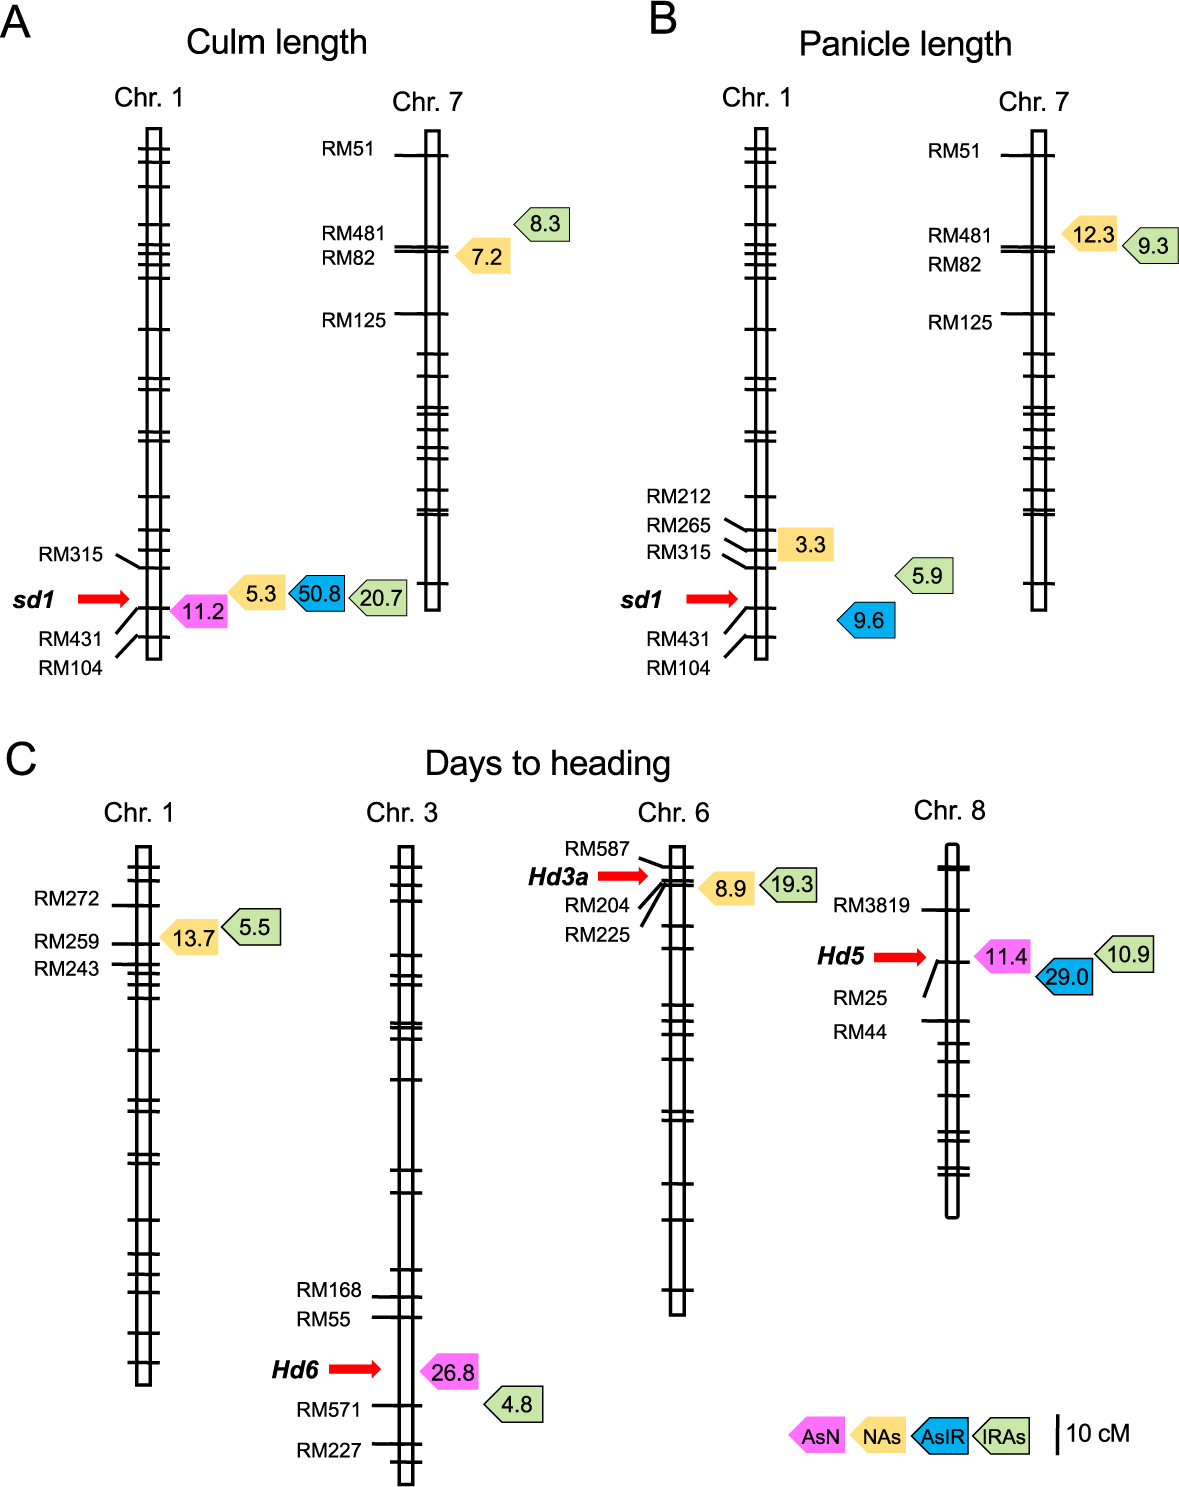
Many genes and loci have been reported for heading date in rice (Itoh et al. 2018, Nonoue et al. 2019). In this study, a total of 13 QTL regions were estimated on seven chromosomes in four populations (Table 2). Among them, four were overlapped in more than two populations (Fig. 5). Near the peaks of their LOD score, three known genes for heading date were identified: Hd6, Hd3a and Hd5 on chromosomes 3, 6 and 8, respectively (Kojima et al. 2002, Takahashi et al. 2001, Wei et al. 2010). Notably, QTLs with the highest LOD values in each population were estimated in the different chromosomal regions (Table 2, Fig. 5). These suggest that heading date is associated with many loci, and that their allele effects are different depending on the genetic backgrounds.
Several QTLs were associated with panicle shape, pericarp color and hull color, and the QTLs that explained the highest percentages of phenotypic variance were detected with common or closely linked markers (Table 3). Near the markers, Spr3, Rc and Bh4 loci were found on chromosomes 4, 7 and 4, respectively (Fig. 6). In the previous studies, wild rice was reported to have functional alleles at these loci, while cultivated rice had null or weak alleles (Ishii et al. 2013, Sweeney et al. 2006, Zhu et al. 2011). These results indicate that the phenotypes of these three traits were mostly determined by the presence or absence of the functional alleles regardless of genetic background.
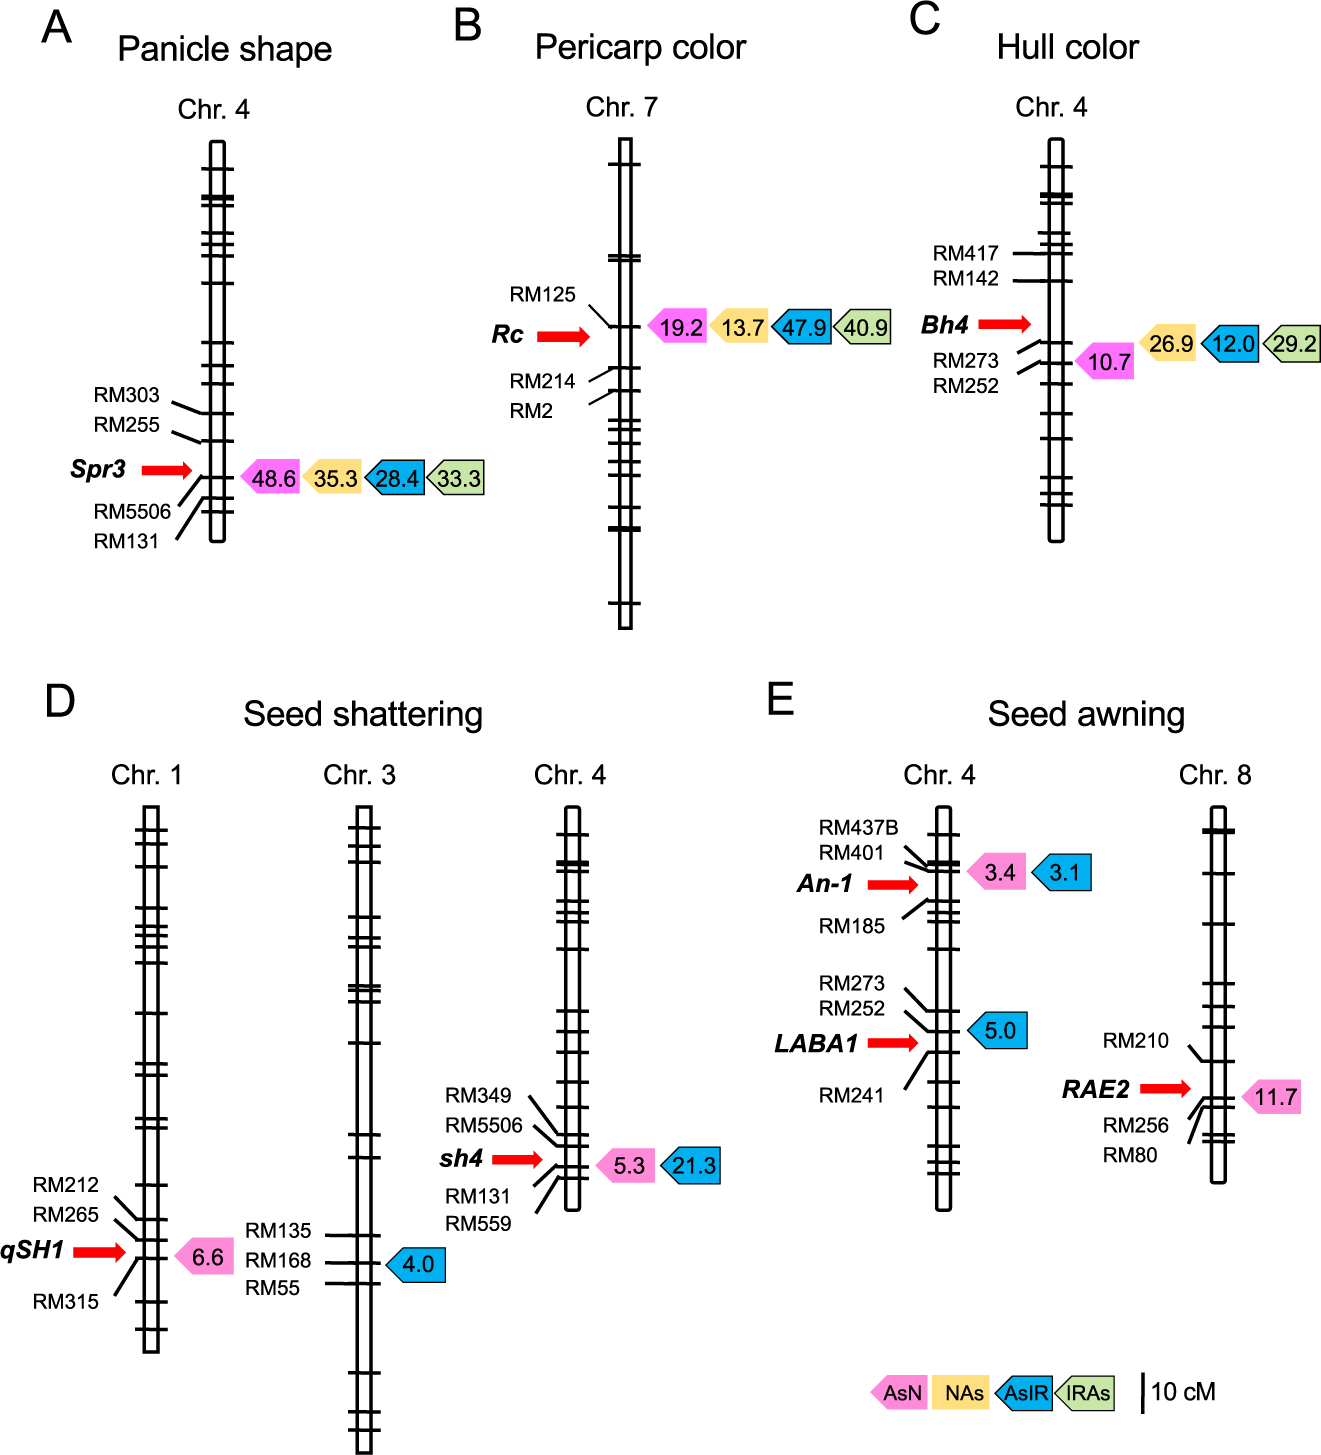
In the case of seed shattering and seed awning, loss-of-function mutations at some major loci are associated with cultivated phenotypes, i.e., non-seed shattering and awnless seed. This explains why typical cultivated phenotypes were hardly observed in the NAs and IRAs populations with wild genetic background. On the other hand, a few QTLs were detected in the genetic background of cultivated rice (Table 3). In rice, two major genes (qSH1 and sh4) and three major genes (An-1, LABA1 and RAE2) were identified for seed shattering and seed awning, respectively (Bessho-Uehara et al. 2016, Hua et al. 2015, Konishi et al. 2006, Li et al. 2006, Luo et al. 2013). Of these, sh4 and An-1 loci were detected in both AsN and AsIR populations (Fig. 6). The qSH1 and RAE2 loci were found only in the AsN population, whereas the LABA1 was estimated in the AsIR population. This may be due to the fact that the Nipponbare and IR36 alleles are functional at LABA1 and at qSH1 and RAE2, respectively (Amarasinghe et al. 2020a, Hua et al. 2015, Ishikawa et al. 2017).
In this study, QTLs for eight morphological traits were estimated using four BRIL populations derived from the reciprocal crosses between O. rufipogon and two typical rice cultivars, O. sativa Japonica Nipponbare and Indica IR36. By comparing the putative QTL regions, the wild and cultivated allele effects were investigated in both genetic backgrounds. In rice breeding, gene introgression from wild is important to transfer useful traits to cultivated Japonica as well as Indica gene pools. In domestication studies, the performance of Japonica and Indica loss-of-function alleles in the same wild genetic background is quite helpful to clarify their domestication process. Such comprehensive information can not be obtained from a single-cross population. Therefore, the present results on gene effects will be informative for both breeding and domestication studies.
Author Contribution Statement
TI conceived and designed the research. PDTP, AN, CY, PTT and TN performed the field experiments. PDTP, AN, CY, PTT and YPJA analyzed the genotypic data. TI and RI provided the direction for the study and prepared the manuscript. All authors read and approved the final manuscript.
Acknowledgments
We thank the National Institute of Genetics (National Bioresource Project), Japan, for providing the seeds of wild rice.
Literature Cited
- Amarasinghe, Y.P.J., R. Kuwata, A. Nishimura, P.D.T. Phan, R. Ishikawa and T. Ishii (2020a) Evaluation of domestication loci associated with awnlessness in cultivated rice, Oryza sativa. Rice 13: 26.
- Amarasinghe, Y.P.J., M. Otsuka, S. Lim, R. Ishikawa and T. Ishii (2020b) The role of wild rice (Oryza rufipogon) awns in seed dispersal. Seed Sci Res 30: 319–324.
- Asano, K., M. Yamasaki, S. Takuno, K. Miura, S. Katagiri, T. Ito, K. Doi, J. Wu, K. Ebana, T. Matsumoto et al. (2011) Artificial selection for a green revolution gene during japonica rice domestication. Proc Natl Acad Sci USA 108: 11034–11039.
- Ballini, E., R. Berruyer, J.B. Morel, M.H. Lebrun, J.L. Nottéghem and D. Tharreau (2007) Modern elite rice varieties of the ‘Green Revolution’ have retained a large introgression from wild rice around the Pi33 rice blast resistance locus. New Phytol 175: 340–350.
- Bessho-Uehara, K., D.R. Wang, T. Furuta, A. Minami, K. Nagai, R. Gamuyao, K. Asano, R.B. Angeles-Shim, Y. Shimizu, M. Ayano et al. (2016) Loss of function at RAE2, a previously unidentified EPFL, is required for awnlessness in cultivated Asian rice. Proc Natl Acad Sci USA 113: 8969–8974.
- Dellaporta, S.L., J. Wood and J.B. Hicks (1983) A plant DNA minipreparation: Version II. Plant Mol Biol Report 1: 19–21.
- Hua, L., D.R. Wang, L. Tan, Y. Fu, F. Liu, L. Xiao, Z. Zhu, Q. Fu, X. Sun, P. Gu et al. (2015) LABA1, a domestication gene associated with long, barbed awns in wild rice. Plant Cell 27: 1875–1888.
- Ikemoto, M., M. Otsuka, P.T. Thanh, P.D.T. Phan, R. Ishikawa and T. Ishii (2017) Gene interaction at seed-awning loci in the genetic background of wild rice. Genes Genet Syst 92: 21–26.
- Ishii, T., K. Numaguchi, K. Miura, K. Yoshida, P.T. Thanh, T.M. Htun, M. Yamasaki, N. Komeda, T. Matsumoto, R. Terauchi et al. (2013) OsLG1 regulates a closed panicle trait in domesticated rice. Nat Genet 45: 462–465.
- Ishikawa, R., P.T. Thanh, N. Nimura, T.M. Htun, M. Yamasaki and T. Ishii (2010) Allelic interaction at seed-shattering loci in the genetic backgrounds of wild and cultivated rice species. Genes Genet Syst 85: 265–271.
- Ishikawa, R., A. Nishimura, T.M. Htun, R. Nishioka, Y. Oka, Y. Tsujimura, C. Inoue and T. Ishii (2017) Estimation of loci involved in non-shattering of seeds in early rice domestication. Genetica 145: 201–207.
- Itoh, H., K.C. Wada, H. Sakai, K. Shibasaki, S. Fukuoka, J. Wu, J. Yonemaru, M. Yano and T. Izawa (2018) Genomic adaptation of flowering-time genes during the expansion of rice cultivation area. Plant J 94: 895–909.
- Jena, K.K. (2010) The species of the genus Oryza and transfer of useful genes from wild species into cultivated rice, O. sativa. Breed Sci 60: 518–523.
- Joehanes, R. and J.C. Nelson (2008) QGene 4.0, an extensible Java QTL-analysis platform. Bioinformatics 24: 2788–2789.
- Khush, G.S. and K.C. Ling (1974) Inheritance of resistance to grassy stunt virus and its vector in rice. J Hered 65: 134–136.
- Kojima, S., Y. Takahashi, Y. Kobayashi, L. Monna, T. Sasaki, T. Araki and M. Yano (2002) Hd3a, a rice ortholog of the Arabidopsis FT gene, promotes transition to flowering downstream of Hd1 under short-day conditions. Plant Cell Physiol 43: 1096–1105.
- Konishi, S., T. Izawa, S.Y. Lin, K. Ebana, Y. Fukuta, T. Sasaki and M. Yano (2006) An SNP caused loss of seed shattering during rice domestication. Science 312: 1392–1396.
- Li, C., A. Zhou and T. Sang (2006) Rice domestication by reducing shattering. Science 311: 1936–1939.
- Liang, C., P. Jaiswal, C. Hebbard, S. Avraham, E.S. Buckler, T. Casstevens, B. Hurwitz, S. McCouch, J. Ni, A. Pujar et al. (2008) Gramene: a growing plant comparative genomics resource. Nucleic Acids Res 36: D947–D953.
- Luo, J., H. Liu, T. Zhou, B. Gu, X. Huang, Y. Shangguan, J. Zhu, Y. Li, Y. Zhao, Y. Wang et al. (2013) An-1 encodes a basic helix-loop-helix protein that regulates awn development, grain size, and grain number in rice. Plant Cell 25: 3360–3376.
- Nonoue, Y., K. Hori, N. Ono, T. Shibaya, E. Ogiso-Tanaka, R. Mizobuchi, S. Fukuoka and M. Yano (2019) Detection of heading date QTLs in advanced-backcross populations of an elite indica rice cultivar, IR64. Breed Sci 69: 352–358.
- Oka, H.I. (1988) Origin of cultivated rice. Japan Scientific Societies Press, Tokyo, p. 254.
- Panaud, O., X. Chen and S.R. McCouch (1996) Development of microsatellite markers and characterization of simple sequence length polymorphism (SSLP) in rice (Oryza sativa L.). Mol Gen Genet 252: 597–607.
- Sasaki, A., M. Ashikari, M. Ueguchi-Tanaka, H. Itoh, A. Nishimura, D. Swapan, K. Ishiyama, T. Saito, M. Kobayashi, G.S. Khush et al. (2002) Green revolution: a mutant gibberellin-synthesis gene in rice. Nature 416: 701–702.
- Sweeney, M.T., M.J. Thomson, B.F. Pfeil and S. McCouch (2006) Caught red-handed: Rc encodes a basic helix-loop-helix protein conditioning red pericarp in rice. Plant Cell 18: 283–294.
- Takahashi, Y., A. Shomura, T. Sasaki and M. Yano (2001) Hd6, a rice quantitative trait locus involved in photoperiod sensitivity, encodes the alpha subunit of protein kinase CK2. Proc Natl Acad Sci USA 98: 7922–7927.
- Thanh, P.T., P.D.T. Phan, R. Ishikawa and T. Ishii (2010) QTL analysis for flowering time using backcross population between Oryza sativa Nipponbare and O. rufipogon. Genes Genet Syst 85: 273–279.
- Vaughan, D.A. (1994) The wild relatives of rice. International Rice Research Institute, Manila, p. 137.
- Wang, S., C.J. Basten, P. Gaffney and Z.B. Zeng (2007) Windows QTL Cartographer 2.5. Bioinformatics Research Center, North Carolina State University, USA. https://statgen.ncsu.edu/qtlcart/WQTLCart.htm
- Wei, X., J. Xu, H. Guo, L. Jiang, S. Chen, C. Yu, Z. Zhou, P. Hu, H. Zhai and J. Wan (2010) DTH8 suppresses flowering in rice, influencing plant height and yield potential simultaneously. Plant Physiol 153: 1747–1758.
- Xiao, J., S. Grandillo, S.N. Ahn, S.R. McCouch, S.D. Tanksley, J. Li and L. Yuan (1996) Genes from wild rice improve yield. Nature 384: 223–224.
- Zhu, B.F., L. Si, Z. Wang, Y. Zhou, J. Zhu, Y. Shangguan, D. Lu, D. Fan, C. Li, H. Lin et al. (2011) Genetic control of a transition from black to straw-white seed hull in rice domestication. Plant Physiol 155: 1301–1311.