Abstract
Japanese red or white common bean (Phaseolus vulgaris L.) cultivars, used to make sweetened boiled beans, are called “kintoki” beans. Kintoki beans are planted to precede winter wheat for crop rotation in Hokkaido, northern Japan. Therefore, early maturity is an important trait for them. The aim of this study was to map the genomic region associated with days to maturity in kintoki beans by genome-wide association study (GWAS). Significant single nucleotide polymorphisms associated with days to maturity were detected on chromosome 1 (Pv01) by GWAS in 3 years, and the candidate region for early maturity was mapped to a 473-kb region. Sequencing analysis indicated that Phvul.001G221100, a phytochrome A3 gene, is likely to be responsible for early maturity in kintoki cultivars: the insertion of a cytosine in exon 1 at position 47 644 850 on Pv01 causes a frameshift that creates an early stop codon. Our findings suggest that the loss-of-function mutation of Phvul.001G221100 is derived from a leading cultivar, ‘Taisho-Kintoki’, and is originated from a spontaneous mutation in the oldest kintoki cultivar, ‘Hon-Kintoki’. The DNA markers targeting the functional insertion of phytochrome A3 will be useful for marker-assisted selection in kintoki bean breeding.
Introduction
Common bean (Phaseolus vulgaris L.) is an important crop and is a major source of protein and essential nutrients. Japanese red or white bean cultivars used to make sweetened boiled beans are called “kintoki” beans. Hokaido, northern Japan, is a main kintoki beans production area (3930 ha in 2023), and accounts for more than 90% of the production of kintoki beans in Japan. It was in 1901, the breeding program of kintoki beans started in Hokkaido, and many kintoki bean cultivars have been released. Among them, ‘Taisho-Kintoki’ is a leading cultivar in Hokkaido. Its seed coat color is red-purple and it is preferred for processing (Koyama and Ushirogi 1957, Yamashita et al. 2014). Taisho-Kintoki began as an early-maturing plant in a miscellaneous ‘Hon-Kintoki’ population, the oldest kintoki cultivar planted in 1900’s to 1920’s, and was isolated by pure line breeding in 1957 (Koyama and Ushirogi 1957). Kintoki beans usually mature earlier than azuki beans and soybeans, and are planted to precede winter wheat for crop rotation in Hokkaido. Therefore, early maturity is an important trait for kintoki beans.
Maturity genes are known to be associated with floral regulation genes. For example, in soybean, time of flowering and maturity are controlled by E genes, which have various roles in maturity and photoperiod sensitivity (Miladinović et al. 2018). Genes E3 and E4 were isolated from soybean and characterized as phytochrome A genes (Liu et al. 2008, Watanabe et al. 2009). Phytochromes are well known as photoreceptors and affect the photoperiodic control of flowering (Johnson et al. 1994, Reed et al. 1994). Phytochrome A responds to very low fluence and high irradiance; other phytochromes respond to red/far-red–reversible low fluence (Whitelam et al. 1998). E3 controls flowering under long-day conditions, and the recessive e3 allele causes insensitivity to long daylength (Buzzell 1971). The effects of E3 on days to flowering (DtF) and other traits in near-isogenic soybean lines were reported (Cober et al. 1996, Kawasaki et al. 2018, Yamada et al. 2012). In common bean, several classical genetic studies revealed that photoperiod insensitivity in Mesoamerican and Andean cultivars is conferred by recessive alleles at a major locus on chromosome 1, termed Photoperiod (Ppd; Wallace et al. 1993). Phvul.001G221100, a phytochrome A3 gene and an ortholog of the soybean maturity gene E3, is a strong candidate for Ppd (Weller et al. 2019). The major loci controlling photoperiod sensitivity were also detected on chromosome 4 and 9, and nucleotide sequence analysis revealed the presence of polymorphisms between the parents of the mapping population for CONSTANS-like 2 (Phvul.004G046601), FLOWERING LOCUS D (Phvul.009G018700), and AGAMOUS-like 8 (Phvul.009G203400), as well as the ortholog to the soybean maturity gene E1 (Phvul.009G204600) (González et al. 2016, 2021).
Genome-wide association studies (GWAS) can provide useful information in identifying loci associated with a particular trait. A reference genome for G19833 (Schmutz et al. 2014), an inbred landrace line of common bean derived from the Andean pool, supports the use of GWAS to identify associations between single nucleotide polymorphisms (SNPs) and phenotypic traits such as days to maturity (DtM) and DtF (Kamfwa et al. 2015, Keller et al. 2020, Moghaddam et al. 2016, Raggi et al. 2019), yield and yield components (Kamfwa et al. 2015, Keller et al. 2020, Moghaddam et al. 2016), morphological and color characters (García-Fernández et al. 2021), mineral content (Gunjača et al. 2021), cooking time (Diaz et al. 2021), and resistance to soybean cyst nematode (Shi et al. 2021). In particular, a significant SNP associated with DtM and DtF was located in the first intron of Phvul.001G221100 in the population of Mesoamerican and Andean cultivars (Kamfwa et al. 2015).
The aims of this study were to identify significant SNPs associated with DtM in kintoki beans by GWAS, to search for the responsible genes by sequencing analysis, and to develop DNA markers linked to the genes for marker-assisted selection (MAS).
Materials and Methods
Plant materials
The 172 cultivars and breeding lines used in this study were grouped into red kintoki bean (n = 128), white kintoki bean (n = 27), red kidney bean (n = 13), and other (n = 4) (Supplemental Table 1). All 159 breeding lines were bred at the Tokachi Agricultural Experiment Station (TAES), Memuro, Hokkaido, and ranged in generation from F6 to F12. The following 10 cultivars were used for confirming a mutation and validation of SSR markers. ‘Taisho-Kintoki’ is a leading red kintoki cultivar in Hokkaido (Koyama and Ushirogi 1957, Yamashita et al. 2014). Four early-maturing cultivars are derived from it: ‘Fukura-Kintoki’ (Ebe et al. 2005a), ‘Akibare’, ‘Kita-Rosso’ (Saito et al. 2022), and ‘Tokei-B524’. ‘Kachidoki’ (Nakagawa et al. 2020), ‘Fukumasari’ (Sato et al. 1996), ‘Hokkai-Kintoki’ (Narikawa et al. 1980), ‘Fuku-Shirokintoki’ (Inuzuka et al. 1975), and ‘Fuku-Uzura’ (Ebe et al. 2005b) belong to the middle maturity group. Taisho-Kintoki, Fukura-Kintoki, Akibare, Tokei-B524, Kachidoki, Fukumasari, and Hokkai-Kintoki are red kintoki type; Fuku-Shirokintoki is white kintoki type; and Fuku-Uzura is Uzura type, with a pale tan seed coat with dark red-purple spots. All of the above cultivars are used for sweetened boiled beans, except Kita-Rosso, which is a red kidney type used for salad or soup. Two ‘Hon-Kintoki’ accessions, Hon-Kintoki-42001 and -42075, were collected by TAES in 1905 and 1982, respectively.
Evaluation of days to maturity and flowering
The field test in 2021 was performed in Sarabetsu, a leased field owned by a farmer (42°66ʹN, 143°19ʹE). Those in 2022 and 2023 were performed at TAES (42°89ʹN, 140°07ʹE). Seeds were sown on 21 May 2021, 26 May 2022, and 25 May 2023. Each plot consisted of two or four 2.5-m rows spaced 60 cm apart, with 20 cm between hills and two plants per hill, at a plant density of 16.7 m–2. Each cultivar or line had one to five plots. The time of flowering was defined as when >50% of the plants in the plot were flowering. The time of maturity was defined as when >80% of the plants defoliated and turned yellow, with pods rattling when shaken. DtF and DtM were calculated from the date of sowing. DtM was evaluated in all 3 years and DtF in 2022 and 2023. Pearson’s correlation coefficient of DtM between years was determined.
DNA extraction
DNA for ddRAD-seq and Illumina sequencing was extracted from young leaves by using a DNeasy Plant Mini Kit (Qiagen, Hilden, Germany) and NucleoBond HMW DNA (Takara, Japan), respectively. DNA for Sanger sequencing, and simple sequence repeat (SSR) and amplification refractory mutation system (ARMS) marker analysis was extracted from young leaves by a modified CTAB method (Suzuki et al. 2012).
SNP detection by ddRAD-seq
Restriction-site-associated DNA (RAD) libraries were constructed for high-throughput DNA sequencing following the concept of the Flexible ddRAD-seq method (Ando et al. 2018). In brief, 100 ng of genomic DNA was fragmented by double digestion with EcoRI-HF and HindIII-HF (New England Biolabs, Ipswich, MA, USA). Fragmented DNA was ligated with custom fork adapters and size-selected using AMPure XP magnetic beads (Beckman Coulter, Brea, CA, USA). The custom adapter sequences were shown in Supplemental Table 2. After PCR amplification and mixing of each library in equal molar amounts, the RAD library mixture was sequenced by 2× 150-bp paired-end sequencing on a NextSeq 1000 sequencer (Illumina, San Diego, CA, USA). Raw reads containing adapters were trimmed in Trimmomatic v. 0.39 software (Bolger et al. 2014). The SNPs were profiled in ipyrad v. 0.9.84 software (Eaton and Overcast 2020). The Phaseolus vulgaris v. 2.1 reference genome sequence (https://phytozome-next.jgi.doe.gov/) was used for SNP mapping. The data have been deposited with links to BioProject accession number PRJDB18347 in the DNA Data Bank of Japan (DDBJ) BioProject database.
Marker imputation and principal component analysis
Statistical analysis was conducted in R v. 4.2.2 software. As random forest imputation is useful for genotype imputation (Jarquín et al. 2014, Rutkoski et al. 2013), we performed marker imputation in the MissForest R package (Stekhoven and Bühlmann 2012). Principal component analysis (PCA) was conducted using the R prcomp function.
Genome-wide association study for days to maturity and flowering
GWAS was performed in the rrBLUP R package (Endelman 2011), using the average values of DtM or DtF in each year. We used the P + K model (n.PC = 6) to control for population structure effects and relatedness. P and K indicate principal components and kinship, respectively. The R p.adjust function detected significant SNPs at a false discovery rate (FDR) of 0.05 (Benjamini and Hochberg 1995). Manhattan and Q–Q plots were created in the qqman R package (Turner 2018). Linkage disequilibrium (LD) blocks were estimated according to the Dʹ value by the method of Gabriel et al. (2002). LD analysis was performed in the Trio R package (Schwender et al. 2014).
Illumina sequencing of Taisho-Kintoki
Genomic DNA of Taisho-Kintoki (1 μg) was sheared to an average size of 300 bp in an Adaptive Focused Acoustics sonicator (Covaris, Woburn, MA, USA). The genomic DNA library was constructed by using a Kapa Hyper Prep Kit (Kapa Biosystems, Wilmington, DE, USA). Fragmented DNA ligated with index adapters without PCR was size-selected in the 400–600-bp region by AMPure XP magnetic beads (Beckman Coulter). The DNA library mixture was sequenced by 2× 300-bp paired-end sequencing on a MiSeq sequencer (Illumina).
Raw read data were processed in CLC Genomics Workbench 23 software (Qiagen). After adapter trimming and quality filtering, the clean read data were mapped to the reference sequence in P. vulgaris v. 2.1. After local realignment of the mapped reads, duplicate PCR reads were discarded. Variant calling based on SNPs and indels was performed in the CLC Genomics Workbench “Fixed Ploidy Variant Detection” tool. The data have been deposited with links to BioProject accession number PRJDB18347 in the DDBJ BioProject database.
Sanger sequencing
Sanger sequencing used forward primer Seq_m47644k (Table 1). PCR used Tks Gflex DNA polymerase (Takara, Japan) with an annealing temperature of 60 °C. After purification of the PCR product by ethanol precipitation, the sequencing reaction was conducted with a BigDye Terminator v. 3.1 Cycle Sequencing Kit (Thermo Fisher Scientific, Waltham, MA, USA). The DNA sequence was determined by ABI Prism 3500 Genetic Analyzer (Thermo Fisher Scientific). Sequence chromatograms were confirmed in the Poly Peak Parser R package (Hill et al. 2014).
Table 1.Primer sequences used in this study
| Marker |
Start position (forward primer) |
Forward primer |
Reverse primer |
| SSR_m47470k |
47 469 891 |
TGAACATTGGTCTTCCGTTA |
AATCTGCCATTGGATTGTTT |
| SSR_m47528k |
47 528 421 |
TCTTGTATACCAAACTCTAAGTAA |
TAGCTACACGATTAAATGGTATT |
| SSR_m47621k |
47 621 111 |
ACTTGTGAAGTGTTGAATGGT |
ACCTAACTCGTTGTGAACAC |
| SSR_m47782k |
47 782 026 |
AAGTAATGAGTCACGTATATTTCAATC |
TATAACTATTATGAGTTGTAGGTGTC |
| SSR_m47913k |
47 913 321 |
AGAAATGTTATTCAAAGAGCTATA |
TGCAAGTTGTTATTCATGCTA |
| Seq_m47644k |
47 644 763 |
CTGCTACTCTTGGTGATATAACT |
GCATATGTGCTTATCTCCA |
| ARMS_m47644ka |
47 644 285 |
GTTATGGCGGTTGTAGTCAATG (outer) |
TCGAATTTCTGCGGCTGT (Kachidoki allele-specific) |
| 47 644 836 |
TCGATCTCACACGGCACG (Taisho-Kintoki allele-specific) |
AGTCACTGCTTCCAGATCCTG (outer) |
a ARMS-PCR was conducted using four primers. Underlined nucleotides indicate mismatches.
PCR using primer sequences of five SSR markers (SSR_m47470k, SSR_m47528k, SSR_m47621k, SSR_m47782k, and SSR_m47913k; Table 1) used AmpliTaq Gold 360 DNA polymerase (Thermo Fisher Scientific) with an annealing temperature of 56 °C. The amplification products were analyzed on an ABI Prism 3500 Genetic Analyzer (Thermo Fisher Scientific) by GeneMapper software against a GeneScan-600 LIZ size standard as described (Suzuki et al. 2012, 2015). To validate the effects of the SSR markers, we used 29 breeding lines (F5 in 2023) derived from a cross between Kachidoki and Akibare for genotyping and phenotyping. For genotyping, the Akibare or Kachidoki alleles were determined with SSR_m47470k and SSR_m47913k. Lines with heterozygous or recombinant alleles were excluded. For phenotyping, the field test was conducted in 2023. Each plot consisted of a 2.5-m row (60 cm from neighboring rows), 15 cm between plants, at a plant density of 11.1 m–2. Student’s t-test was used to determine the significance of differences between genotypes.
Development of ARMS marker and estimating the genetic effects
ARMS-PCR using primer sequences of ARMS_m47644k used Tks Gflex DNA polymerase with an annealing temperature of 60 °C (Table 1). The PCR products were analyzed using 2% agarose gel electrophoresis. A linear regression analysis was used to calculate the coefficients of determination (R2). The analysis was conducted using the R lm function. Estimated genetic effects were calculated as follows: (estimated genetic effects) = (average DtM with the Taisho-Kintoki allele) – (average DtM with the Kachidoki allele).
Results
SNP detection by ddRAD-seq and PCA
ddRAD-seq detected 41 748 genome-wide SNPs in the 172 cultivars and breeding lines after low-quality SNPs (missing >0.5) were removed. Missing data were imputed by random forest regression. After filtering for minor allele frequency (MAF >0.05), 7339 SNPs were retained. A plot of principal component 1 (PC1) against PC2 showed three clusters of red kintoki bean, white kintoki bean, and red kidney bean (Fig. 1). The sum of PC1 to PC6 explained 65.1%, enough to account for population structure. Thus, GWAS for DtM and DtF in each year was conducted using the P + K model (n.PC = 6) to control for population structure effects and relatedness.
Genome-wide association study for days to maturity and flowering
There were significant positive correlations of DtM between years (Table 2). Highly positive correlations between DtM and DtF in 2022 (r = 0.820) and 2023 (r = 0.690) suggest that the gene responsible for early maturity is a floral regulatory gene. GWAS for DtM and DtF was conducted in each year (Fig. 2, Supplemental Fig. 1). Two or three significant SNPs associated with DtM were detected on chromosome 1 (Pv01) in each year (Table 3). Two significant SNPs associated with DtF were also detected on Pv01 in 2022, but none in 2023 (Table 3). DtM ranged from 90 to 106 in 2021 (Fig. 3A), from 94 to 114 in 2022 (Fig. 3B), and from 82 to 95 in 2023 (Fig. 3C). The phenotypic range is likely to affect GWAS scores.
Table 2.Correlation coefficients of days to maturity and flowering between pairs of trial years
|
DtM2021 |
DtM2022 |
DtM2023 |
DtF2022 |
DtF2023 |
| DtM2021 |
|
|
|
|
|
| DtM2022 |
0.668*** |
|
|
|
|
| DtM2023 |
0.648** |
0.870*** |
|
|
|
| DtF2022 |
0.634*** |
0.820*** |
0.658*** |
|
|
| DtF2023 |
0.501* |
0.563*** |
0.690*** |
0.597*** |
|
* P < 0.05; ** P < 0.01; *** P < 0.001.

Table 3.GWAS scores of days to maturity (DtM) and days to flowering (DtF) in the 45.7–50.6-Mb region on Pv01
| SNP position on chromosome 1 |
LD block numbera |
Score (–log10P)b |
| DtM 2021 |
DtM 2022 |
DtM 2023 |
DtF 2022 |
| 45 781 409 |
12 |
0.22 |
0.50 |
0.69 |
0.32 |
| 46 548 974 |
12 |
1.68 |
2.57 |
1.03 |
0.57 |
| 46 817 081 |
– |
0.82 |
1.97 |
1.24 |
0.21 |
| 47 085 595 |
13 |
1.88 |
2.54 |
1.52 |
0.98 |
| 47 100 084 |
13 |
1.38 |
2.59 |
2.26 |
0.74 |
| 47 419 094 |
– |
0.81 |
3.42 |
0.70 |
2.46 |
| 47 479 438 |
14 |
7.84 |
11.88 |
5.09 |
5.24 |
| 47 479 506 |
14 |
8.03 |
12.58 |
5.08 |
5.83 |
| 47 892 313 |
– |
1.98 |
8.45 |
1.09 |
3.87 |
| 50 630 505 |
15 |
0.06 |
0.63 |
0.06 |
0.36 |
| 50 630 540 |
15 |
0.05 |
0.62 |
1.52 |
0.35 |
| 50 630 551 |
15 |
0.06 |
0.63 |
0.01 |
0.37 |
| 50 630 646 |
15 |
0.05 |
0.63 |
0.03 |
0.36 |
a Linkage disequilibrium (LD) blocks were estimated according to the Dʹ value using the method of Gabriel et al. (2002). Sixteen LD blocks were found on Pv01.
b White number on a black background means significant (FDR, P = 0.05).

GWAS suggested that SNP_47479438 and SNP_47479506 were tightly linked to a gene responsible for early maturity. No recombination occurred between them in the 172 cultivars and lines (Supplemental Table 1). The physical gap was found in the region between the SNP_47892313 and SNP_50630505 (Table 3), but this region included the 161 SNPs with a low MAF, not used for GWAS (Supplemental Table 3). Thus, we think this region may be the highly conserved in kintoki cultivars, and early maturity gene is unlikely to be located.
We found 16 LD blocks containing between 2 and 113 SNPs (total, 208 SNPs) on Pv01. SNP_47479438 and SNP_47479506 belong to LD block 14, indicating that the gene lies between positions 47 419 094 and 47 892 313 on Pv01 (Table 3, Supplemental Fig. 2). This candidate 473-kb region holds 53 protein-coding genes in Phytozome (P. vulgaris v. 2.1). This region includes Phvul.001G221100 (47 642 032–47 647 745), a phytochrome A3 gene, which is an ortholog of the soybean maturity gene E3 (Watanabe et al. 2009) and a strong candidate for Ppd in common bean (Weller et al. 2019). E3 affected DtF in soybean in many locations and DtM in one location (Yamada et al. 2012). The protein sequence similarity between Phvul.001G221100 and E3 is 94.7% in Phytozome. The other 52 genes are not associated with maturity or floral regulation, according to gene annotation. Therefore, we focused on Phvul.001G221100 as a candidate gene for early maturity in kintoki cultivars.
Sequencing of the candidate 473-kb region in Taisho-Kintoki
Whole-genome resequencing of Taisho-Kintoki resulted in a total of ~13.6 Gb. The total contig length of the reference genome G19833 is reported as 531 Mb in Phytozome (P. vulgaris v. 2.1), and thus the genome sequence of Taisho-Kintoki has ~25.6× sequence coverage. Comparative analysis between G19833 and Taisho-Kintoki revealed 270 mutations in the candidate 473-kb region, and two non-synonymous SNPs were found in Phvul.001G221100 and Phvul.001G223000 (Supplemental Table 4). Taisho-Kintoki had an insertion of a C at position 47 644 850 in exon 1 of Phvul.001G221100 in all 11 reads, and this frameshift created a stop codon 11 codons downstream (Fig. 4). We defined this insertion as a loss-of-function mutation of Phvul.001G221100.

A non-synonymous SNP was also found in Phvul.001G223000 (Supplemental Table 4). This gene codes protein transport protein SEC24 in Phytozome. Sanger sequencing in the proximal region of exon 1 of Phvul.001G223000 identified a non-synonymous SNP at position 47 811 067 in both Hon-Kintoki and Taisho-Kintoki (Supplemental Fig. 3). Thus, this SNP is unlikely to be associated with early maturity in Taisho-Kintoki.
Confirming the insertion mutation in exon 1 of Phvul.001G221100
Sanger sequencing of ~300-nt sequences in the proximal region of exon 1 of Phvul.001G221100 in ten cultivars (Fig. 5A) identified an insertion of a C at position 47 644 850 in all five cultivars in the early maturity group but in none of the five cultivars in the middle maturity group (Fig. 5B). These results indicate that the loss-of-function mutation due to the C insertion is likely to be important for early maturity.
Validation of the effect of the SSR markers tightly linked to Phvul.001G221100
We validated the effects of five SSR markers (SSR_m47470k, SSR_m47528k, SSR_m47621k, SSR_m47782k, and SSR_m47913k; Table 1) in the same ten cultivars. All five markers were polymorphic between early and middle maturity groups, and the marker genotypes were the same in the early maturity group (Table 4). We also validated the effects of the markers SSR_m47470k and SSR_m47913k in 29 breeding lines derived from Kachidoki (middle) × Akibare (early). The average was significantly shorter in the lines with the Akibare alleles than in those with the Kachidoki alleles (P < 0.001, Fig. 6). These results indicate that these SSR markers, tightly linked to Phvul.001G221100, will be useful for MAS in kintoki bean breeding.
Table 4.SNP and SSR marker genotypes of ten cultivars used for genotyping
| Maturity group |
Cultivar or line |
Ave. maturitya (days) |
SSR_m47470k (bp) |
SNP_47479438 |
SNP_47479506 |
SSR_m47528k (bp) |
SSR_m47621k (bp) |
Insertion_47644850d |
SSR_m47782k (bp) |
SNP_47892313 |
SSR_m47913k (bp) |
| Early |
Taisho-Kintoki |
91.7 |
303 |
A |
C |
256 |
336 |
C |
191 |
C |
215 |
|
Fukura-Kintoki |
90.8 |
303 |
NAb |
NAc |
256 |
336 |
C |
191 |
C |
215 |
|
Akibare |
91.5 |
303 |
A |
C |
256 |
336 |
C |
191 |
C |
215 |
|
Kita-Rosso |
94.3 |
303 |
A |
C |
256 |
336 |
C |
191 |
C |
215 |
|
Tokei-B524 |
92.0 |
303 |
A |
C |
256 |
336 |
C |
191 |
C |
215 |
| Middle |
Kachidoki |
97.5 |
311 |
T |
G |
284 |
320 |
– |
197 |
T |
201 |
|
Fukumasari |
97.2 |
311 |
T |
G |
279 |
320 |
– |
195 |
T |
201 |
|
Hokkai-Kintoki |
99.5 |
307 |
T |
G |
273 |
320 |
– |
197 |
T |
201 |
|
Fuku-Shirokintoki |
97.5 |
311 |
T |
G |
282 |
320 |
– |
195 |
T |
201 |
|
Fuku-Uzura |
98.7 |
311 |
T |
G |
284 |
320 |
– |
195 |
T |
201 |
a Average days to maturity in 2021–2023.
b Not available. The imputed SNP genotype was A.
c Not available. The imputed SNP genotype was C.
d An insertion mutation in exon 1 of Phvul.001G221100. The genotypes were determined by Sanger sequencing.

We developed the ARMS marker identifying an insertion of a C at position 47 644 850 (Table 1). The ten cultivars were genotyped using the ARMS marker, and the results were identical to those of Sanger sequencing (Fig. 7A). We named the allele with an insertion of a C at position 47 644 850 (ALT) as the Taisho-Kintoki allele, and the reference allele (REF) as the Kachidoki allele. The 172 cultivars and breeding lines were genotyped using this marker (Supplemental Table 1), and the effects of this gene were estimated by a linear regression analysis (Table 5). The genetic effects on maturity were estimated to be from 4.8 to 7.3 days, and coefficients of determination for the difference in alleles were from 40.5 to 66.3% in each year. These results indicate that this gene will be highly effective.
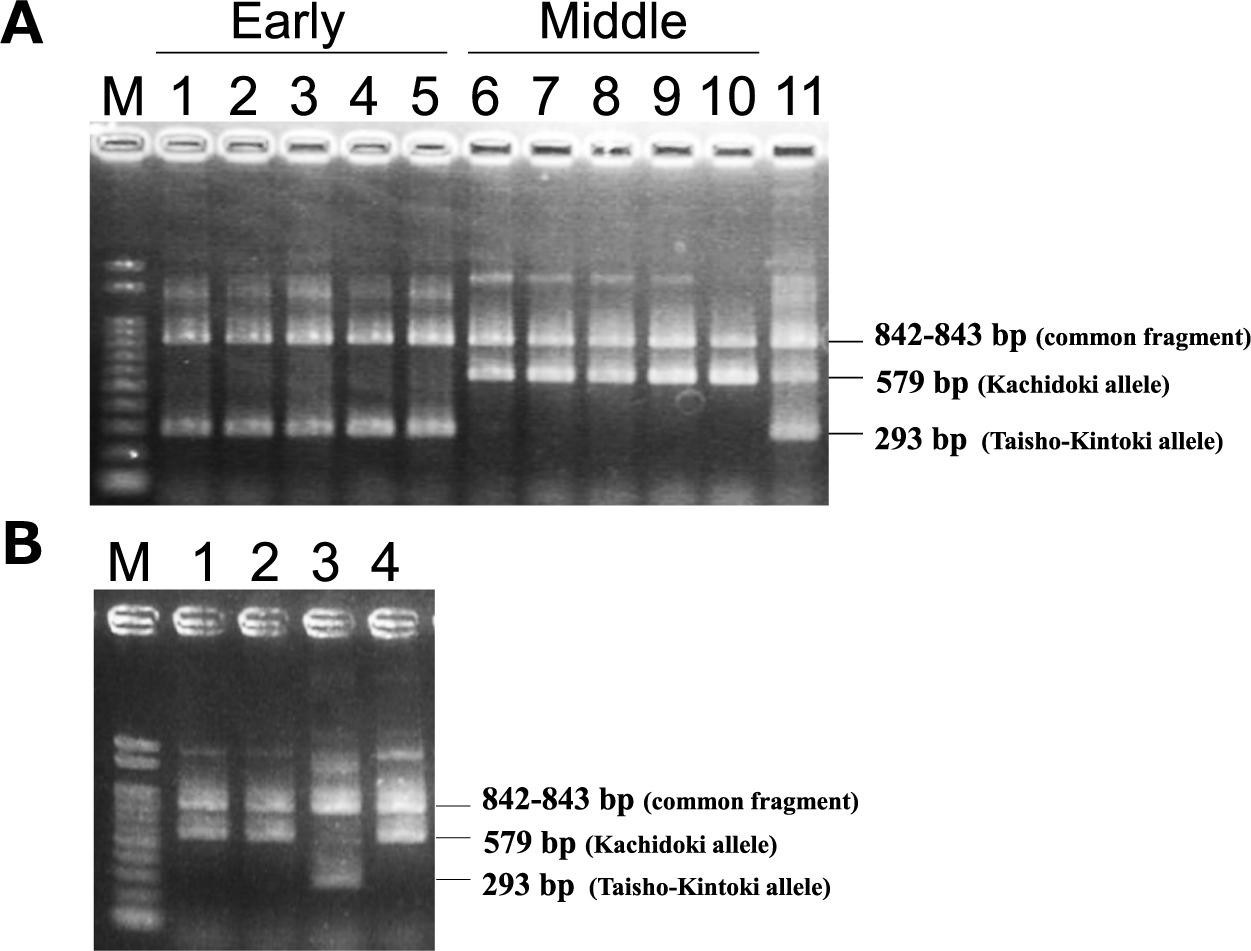
Table 5.The effects of the Taisho-Kintoki allele on days to maturity in the GWAS population
| Year |
Estimated genetic effect (days)a |
R2 (%) |
| 2021 |
–5.6 |
40.5 |
| 2022 |
–7.3 |
66.3 |
| 2023 |
–4.8 |
57.0 |
| Combined three-year data |
–5.9 |
70.0 |
a The effect of the Taisho-Kintoki allele on days to maturity.
To estimate the origin of an insertion of a C at position 47 644 850, two Hon-Kintoki accessions were genotyped using the ARMS marker (Fig. 7B). Both accessions had the Kachidoki alleles, indicating that this insertion is originated from a spontaneous mutation in Hon-Kintoki.
Discussion
Early maturity in kintoki cultivars is an important trait for crop rotation. We detected significant SNPs associated with DtM on Pv01 by GWAS in 3 years, and mapped the candidate region for early maturity to a 473-kb region (Fig. 2, Table 3). Sequencing analysis suggested that Phvul.001G221100, a phytochrome A gene, is responsible for early maturity in kintoki cultivars, and that a C insertion causing a loss-of-function mutation is important (Figs. 4, 5, Table 4). The four early-maturing cultivars—Fukura-Kintoki, Akibare, Kita-Rosso, and Tokei-B524—had the identical variant (Fig. 5) and the same five SSR marker genotypes as in Taisho-Kintoki (Table 4), and have Taisho-Kintoki in their pedigrees. Taisho-Kintoki began as an early-maturing plant in a miscellaneous Hon-Kintoki population in 1935 and was isolated by pure line breeding in 1957 (Koyama and Ushirogi 1957). In this study, two Hon-Kintoki accessions had no insertions at position 47 644 850 (Fig. 7B). Therefore, the loss-of-function mutation of Phvul.001G221100 in Taisho-Kintoki originated from a spontaneous mutation in Hon-Kintoki, and new early-maturing cultivars such as Akibare (released in 2019) are likely to have inherited the mutation based on selection for the early maturity phenotype.
There are two prior reports of significant SNPs associated with DtM or DtF detected in the proximal region of Phvul.001G221100. Kamfwa et al. (2015) reported a significant SNP in the first intron of Phvul.001G221100 in a population of Mesoamerican and Andean cultivars, and suggested Phvul.001G221100 as a candidate gene for early maturity. As kintoki cultivars account for 89.5% in the population used in this study (Supplemental Table 1), the population structure in this study may be different from that in Kamfwa et al. (2015). Weller et al. (2019) sequenced Phvul.001G221100 in a population of Mesoamerican and Andean cultivars; they found 61 polymorphic sites across the Phvul.001G221100 coding sequence and defined 23 haplotypes. The Andean domesticated cultivar ‘Midas’ had a C insertion at position 47 644 850, identical to that in Taisho-Kintoki (Fig. 4; Weller et al. 2019). Midas is a snap bean cultivar with white seeds, and the pedigree of Midas is not available. Further studies will be needed to explain why Midas and Taisho-Kintoki have the identical variant despite their different origins.
Liu et al. (2008) found multiple homologs of the phytochrome A gene in the soybean genome and reported E4 as a paralog of E3. Interestingly, there are multiple homologs of phytochrome A in the common bean genome (P. vulgaris v. 2.1). Phvul.007G206800 on Pv07 is a phytochrome A gene; its protein sequence similarity to soybean E4 is 97.8%, and thus Phvul.007G206800 is likely to be an ortholog of E4. No significant SNPs were associated with DtM and DtF on Pv07 in the population used here, but Phvul.007G206800 could affect maturity in other populations. To clarify the mechanisms of phytochromes in common bean, further studies of the functions of Phvul.007G206800 are required.
DtM and DtF are affected by climatic and environmental conditions. 2023 was warmer than 2021 and 2022. In such conditions, the phenotypic range of maturity narrows in kintoki cultivars, and it is hard to evaluate maturity precisely; for example, that of DtM in the Kachidoki × Akibare lines was only 6 days in 2023 (Fig. 6), and that in the GWAS population was 14 days in 2023, smaller than in 2021 and 2022 (Fig. 3). We believe that MAS using the ARMS marker identifying the loss-of-function mutation of Phvul.001G221100 (Fig. 7, Table 1), which is unaffected by climatic and environmental conditions, will prove effective for improving maturity.
In summary, we identified significant SNPs associated with DtM and DtF on Pv01. Phvul.001G221100, a phytochrome A3 gene, is likely to be responsible for early maturity in kintoki cultivars, and the SSR and ARMS markers linked to it will be useful for MAS in kintoki bean breeding.
Author Contribution Statement
NY, KT, and YN designed the research. KT and AH conducted the ddRAD-seq and resequence experiments. NY conducted the SSR marker and Sanger sequence experiments. NY, KN, and HS conducted the field experiments. NY, KT, KN, HS, AH, and YN analyzed the data. NY and KT wrote the manuscript. All authors read and approved the manuscript.
Acknowledgments
This study was supported by the NODAI Genome Research Center, Tokyo University of Agriculture, and the Japan Pulse Foundation.
Literature Cited
- Ando, T., T. Matsuda, K. Goto, K. Hara, A. Ito, J. Hirata, J. Yatomi, R. Kajitani, M. Okuno, K. Yamaguchi et al. (2018) Repeated inversions within a pannier intron drive diversification of intraspecific colour patterns of ladybird beetles. Nat Commun 9: 3843.
- Benjamini, Y. and Y. Hochberg (1995) Controlling the false discovery rate: a practical and powerful approach to multiple testing. Journal of the Royal Statistical Society: Series B (Methodological) 57: 289–300.
- Bolger, A.M., M. Lohse and B. Usadel (2014) Trimmomatic: a flexible trimmer for Illumina sequence data. Bioinformatics 30: 2114–2120.
- Buzzell, R.I. (1971) Inheritance of a soybean flowering response to fluorescent-daylength conditions. Can J Genet Cytol 13: 703–707.
- Cober, E.R., J.W. Tanner and H.D. Voldeng (1996) Genetic control of photoperiod response in early-maturing, near-isogenic soybean lines. Crop Sci 36: 601–605.
- Diaz, S., D. Ariza-Suarez, R. Ramdeen, J. Aparicio, N. Arunachalam, C. Hernandez, H. Diaz, H. Ruiz, H.P. Piepho and B. Raatz (2021) Genetic architecture and genomic prediction of cooking time in common bean (Phaseolus vulgaris L.). Front Plant Sci 11: 622213.
- Eaton, D.A.R. and I. Overcast (2020) ipyrad: interactive assembly and analysis of RADseq datasets. Bioinformatics 36: 2592–2594.
- Ebe, S., H. Sato, K. Mikami, K. Murata, I. Chiba, Y. Shinada and H. Shimada (2005a) A new common bean variety ‘Fukura-kintoki’ with early maturity, large seed size and high yield. Bull Hokkaido Prefect Agric Exp Stn 89: 1–12 (in Japanese with English summary).
- Ebe, S., H. Sato, K. Murata, I. Chiba, Y. Shinada and S. Iida (2005b) A new common bean variety ‘Fuku-uzura’ with determinate dwarf plant type, high yield and early maturity. Bull Hokkaido Prefect Agric Exp Stn 88: 25–35 (in Japanese with English summary).
- Endelman, J.B. (2011) Ridge regression and other kernels for genomic selection with R Package rrBLUP. Plant Genome 4: 250–255.
- Gabriel, S.B., S.F. Schaffner, H. Nguyen, J.M. Moore, J. Roy, B. Blumenstiel, J. Higgins, M. DeFelice, A. Lochner, M. Faggart et al. (2002) The structure of haplotype blocks in the human genome. Science 296: 2225–2229.
- García-Fernández, C., A. Campa, A.S. Garzón, P. Miklas and J.J. Ferreira (2021) GWAS of pod morphological and color characters in common bean. BMC Plant Biol 21: 184.
- González, A.M., F.J. Yuste-Lisbona, S. Saburido, S. Bretones, A.M. De Ron, R. Lozano and M. Santalla (2016) Major contribution of flowering time and vegetative growth to plant production in common bean as deduced from a comparative genetic mapping. Front Plant Sci 7: 1940.
- González, A.M., F.J. Yuste-Lisbona, J. Weller, J.K. Vander Schoor, R. Lozano and M. Santalla (2021) Characterization of QTL and environmental interactions controlling flowering time in Andean common bean (Phaseolus vulgaris L.). Front Plant Sci 11: 599462.
- Gunjača, J., K. Carović-Stanko, B. Lazarević, M. Vidak, M. Petek, Z. Liber and Z. Šatović (2021) Genome-wide association studies of mineral content in common bean. Front Plant Sci 12: 636484.
- Hill, J.T., B.L. Demarest, B.W. Bisgrove, Y. Su, M. Smith and H.J. Yost (2014) Poly peak parser: method and software for identification of unknown indels using sanger sequencing of polymerase chain reaction products. Dev Dyn 243: 1632–1636.
- Inuzuka, T., T. Ushirogi and T. Narikawa (1975) A new kidney bean variety ‘Fuku-shirokintoki’. Bull Hokkaido Prefect Agric Exp Stn 33: 68–77 (in Japanese with English summary).
- Jarquín, D., K. Kocak, L. Posadas, K. Hyma, J. Jedlicka, G. Graef and A. Lorenz (2014) Genotyping by sequencing for genomic prediction in a soybean breeding population. BMC Genomics 15: 740.
- Johnson, E., M. Bradley, N.P. Harberd and G.C. Whitelam (1994) Photoresponses of light-grown phyA mutants of Arabidopsis (phytochrome A is required for the perception of daylength extensions). Plant Physiol 105: 141–149.
- Kamfwa, K., K.A. Cichy and J.D. Kelly (2015) Genome-wide association study of agronomic traits in common bean. Plant Genome 8: plantgenome2014.09.0059.
- Kawasaki, Y., R. Yamazaki, K. Katayama, T. Yamada and H. Funatsuki (2018) Effects of maturity genes E2 and E3 on yield formation in soybean cultivar Enrei in warm region, Fukuyama in Japan. Plant Prod Sci 21: 387–397.
- Keller, B., D. Ariza-Suarez, J. de la Hoz, J.S. Aparicio, A.E. Portilla-Benavides, H.F. Buendia, V.M. Mayor, B. Studer and B. Raatz (2020) Genomic prediction of agronomic traits in common bean (Phaseolus vulgaris L.) under environmental stress. Front Plant Sci 11: 1001.
- Koyama, Y. and T. Ushirogi (1957) A new common bean variety “Taisho-Kintoki”. Hokunou 24: 1–10 (in Japanese).
- Liu, B., A. Kanazawa, H. Matsumura, R. Takahashi, K. Harada and J. Abe (2008) Genetic redundancy in soybean photoresponses associated with duplication of the phytochrome A gene. Genetics 180: 995–1007.
- Miladinović, J., M. Ćeran, V. Đorđević, S. Balešević-Tubić, K. Petrović, V. Đukić and D. Miladinović (2018) Allelic variation and distribution of the major maturity genes in different soybean collections. Front Plant Sci 9: 1286.
- Moghaddam, S.M., S. Mamidi, J.M. Osorno, R. Lee, M. Brick, J. Kelly, P. Miklas, C. Urrea, Q. Song, P. Cregan et al. (2016) Genome-wide association study identifies candidate loci underlying agronomic traits in a Middle American diversity panel of common bean. Plant Genome 9: plantgenome2016.02.0012.
- Nakagawa, K., Y. Saito, M. Okuyama, S. Ebe, H. Shimada and H. Sato (2020) A new common bean variety ‘Kachidoki’. Bull Hokkaido Prefect Agric Exp Stn 104: 31–41 (in Japanese with English summary).
- Narikawa, T., T. Miura, S. Iida, M. Nakano, T. Ushirogi and T. Inuzuka (1980) A new common bean variety “Hokkai-kintoki”. Bull Hokkaido Prefect Agric Exp Stn 43: 72–79 (in Japanese with English summary).
- Raggi, L., L. Caproni, A. Carboni and V. Negri (2019) Genome-wide association study reveals candidate genes for flowering time variation in common bean (Phaseolus vulgaris L.). Front Plant Sci 10: 962.
- Reed, J.W., A. Nagatani, T.D. Elich, M. Fagan and J. Chory (1994) Phytochrome A and phytochrome B have overlapping but distinct functions in Arabidopsis development. Plant Physiol 104: 1139–1149.
- Rutkoski, J.E., J. Poland, J.L. Jannink and M.E. Sorrells (2013) Imputation of unordered markers and the impact on genomic selection accuracy. G3 (Bethesda) 3: 427–439.
- Saito, Y., H. Sato, K. Nakagawa, M. Okuyama and H. Shimada (2022) A new common bean variety “Kita Rosso”. Bull Hokkaido Prefect Agric Exp Stn 106: 27–37 (in Japanese with English summary).
- Sato, H., Y. Shinada, S. Iida, M. Hara and I. Chiba (1996) A new kidney bean variety ‘Fukumasari’. Bull Hokkaido Prefect Agric Exp Stn 70: 37–48 (in Japanese with English summary).
- Schmutz, J., P.E. McClean, S. Mamidi, G.A. Wu, S.B. Cannon, J. Grimwood, J. Jenkins, S. Shu, Q. Song, C. Chavarro et al. (2014) A reference genome for common bean and genome-wide analysis of dual domestications. Nat Genet 46: 707–713.
- Schwender, H., Q. Li, C. Neumann, M.A. Taub, S.G. Younkin, P. Berger, R.B. Scharpf, T.H. Beaty and I. Ruczinski (2014) Detecting disease variants in case-parent trio studies using the Bioconductor software package trio. Genet Epidemiol 38: 516–522.
- Shi, A., P. Gepts, Q. Song, H. Xiong, T.E. Michaels and S. Chen (2021) Genome-wide association study and genomic prediction for soybean cyst nematode resistance in USDA Common Bean (Phaseolus vulgaris) core collection. Front Plant Sci 12: 624156.
- Stekhoven, D.J. and P. Bühlmann (2012) MissForest—nonparametric missing value imputation for mixed-type data. Bioinformatics 28: 112–118.
- Suzuki, T., M. Sato and T. Takeuchi (2012) Evaluation of the effects of five QTL regions on Fusarium head blight resistance and agronomic traits in spring wheat (Triticum aestivum L.). Breed Sci 62: 11–17.
- Suzuki, T., M.N. Murai, T. Hayashi, S. Nasuda, Y. Yoshimura and T. Komatsuda (2015) Resistance to wheat yellow mosaic virus in Madsen wheat is controlled by two major complementary QTLs. Theor Appl Genet 128: 1569–1578.
- Turner, S.D. (2018) qqman: an R package for visualizing GWAS results using Q–Q and Manhattan plots. J Open Source Software 3: 731.
- Wallace, D.H., K.S. Yourstone, P.N. Masaya and R.W. Zobel (1993) Photoperiod gene control over partitioning between reproductive and vegetative growth. Theor Appl Genet 86: 6–16.
- Watanabe, S., R. Hideshima, Z. Xia, Y. Tsubokura, S. Sato, Y. Nakamoto, N. Yamanaka, R. Takahashi, M. Ishimoto, T. Anai et al. (2009) Map-based cloning of the gene associated with the soybean maturity locus E3. Genetics 182: 1251–1262.
- Weller, J.L., J.K.V. Schoor, E.C. Perez-Wright, V. Hecht, A.M. González, C. Capel, F.J. Yuste-Lisbona, R. Lozano and M. Santalla (2019) Parallel origins of photoperiod adaptation following dual domestications of common bean. J Exp Bot 70: 1209–1219.
- Whitelam, G.C., S. Patel and P.F. Devlin (1998) Phytochromes and photomorphogenesis in Arabidopsis. Philos Trans R Soc Lond B Biol Sci 353: 1445–1453.
- Yamada, T., M. Hajika, N. Yamada, K. Hirata, A. Okabe, N. Oki, K. Takahashi, K. Seki, K. Okano, Y. Fujita et al. (2012) Effects on flowering and seed yield of dominant alleles at maturity loci E2 and E3 in a Japanese cultivar, Enrei. Breed Sci 61: 653–660.
- Yamashita, Y., T. Takeuchi, M. Okuyama, J. Sasaki, K. Onodera, M. Sato, C. Souma and S. Ebe (2014) Development and validation of DNA markers linked to Sdvy-1, a common bean gene conferring resistance to the yellowing strain of Soybean dwarf virus. Breed Sci 64: 404–408.


