Abstract
This paper presents an isotropic-confining triaxial system particularly designed for three-dimensional (3-D) volume change measurement of unsaturated compacted bentonite when being wetted. The specimen size was set to be small (diameter less than 30 mm and height of 10 mm) to reduce testing duration, which, as a result, introduces many difficulties to design the apparatus and to measure volume change with sufficient accuracy. In the triaxial system, two volume change measurement methods were applied, local deformation measurement by using laser displacement transducers (LDTs) and global measurement method with a differential pressure transducer (DPT) to monitor volume change of cell water. Another two methods to measure final volume change, the final water content method and the pycnometer method, were also newly proposed. Technical details to improve measurement accuracy were described. Testing results suggest that the measurement accuracy in terms of absolute volume change variation was of 0.09-0.12 ml, which is better than many currently available techniques.
1. INTRODUCTION
It is often a frustrated experience to conduct tests on compacted bentonite, such as tests for swelling pressure, swelling deformation, hydraulic conductivity, diffusivity etc. due to the long testing duration (these tests may last from weeks to years). To collect sufficient data in limited time, inexpensive testing tools with appropriate accuracy are desired academically and practically. The paper presents such a system for swelling deformation test.
Swelling deformation of unsaturated compacted bentonite induced by wetting has been studied extensively in the past for better understanding the bentonite barrier designed for the geological disposal project to deal with high-level radioactive waste1-8). In most of these studies, one dimensional (1−D) tests were conducted, where bentonite specimens were confined in rigid rings radially and axial deformation was measured under various testing conditions. Recently, a question was raised from industrial collaborators on such a test: is this 1−D volumetric strain the same as three-dimensional (3−D) case? Few works were found to measure 3−D swelling deformation of compacted bentonite using the triaxial apparatus9-10), though many works have been done to measure swelling pressure anisotropy11-14) maybe because the testing method is easy and duration is much shorter to measure pressure. However, 3−D swelling deformation measurements are certainly necessary to answer both practical (e.g. how compacted bentonite/sand blocks deform to fill gaps in the disposal pit) and academic questions (e.g. difference between 1- and 3-D volumetric deformation, constitutive model dependency on volumetric deformation development).
Many methods for volume change measurement in the triaxial apparatus have been developed especially for unsaturated specimen. Laloui et al. 15) and Hoyos et al.16) well documented those methods. A popular type is the double − cell method, where an open-end inner cell was installed surrounding the specimen and volume change of the specimen can be deducted from the liquid level change of the inner cell17-23). The advantage of this type is that the global volume change can be obtained with relatively easy operation and good accuracy. Another popular type was the direct measurement of the soil specimen, in which specimen axial and radial deformation are directly measured by different types of transducers, such as, strain gauge type sensor, linear variable differential transducer (LVDT), laser displacement transducer (LDT), Hall effect semiconductor, particle image velocimetry (PIV) technique24-28). In the early days, transducers needed to be directly contacting to the specimen surface (more exactly, the membrane surface) to measure local deformation, while with the use of laser transducer or PIV technique, non-contacting and global volume change are now possible.
To measure the volume change of compacted bentonite specimen in a prompt manner, it was decided to newly develop an inexpensive isotropic-confining triaxial system particularly for the very small specimen (diameter smaller than 30 mm and height of 10 mm). On this system, two volume change methods were applied and another two methods to measure final volume change after the test were also introduced. The technical difficulties affecting measurement accuracy and their countermeasures were described in detail. The accuracy (measurement variation) of these four methods was about 2.4 − 4% in terms of volumetric strain with the corresponding absolute volume change of 0.09 − 0.13 ml. The latter value is of a better level comparing to current most available methods applying to the standard size specimen15).
2. TESTING SYSTEM
(1) Isotropic-confining triaxial system
Fig. 1 shows a schematic drawing of the isotropic-confining triaxial system. The apparatus was designed to be compact and simple with a total height of 230 mm and 140 in diameter. The diameters of the top cap and the pedestal is 30 mm, and the specimen diameter used in this study was either 20 mm or 25 mm (height: 10 mm) reserving space for radial deformation. The membrane filter with a pore size of 0.45 μm was glued on the pedestal and the top cap as the media for water transportation (no porous metals or stones were used). This membrane filter was previously used for suction measurement29-30), and recently used instead of filter paper because of its much smoother surface and less compressibility7). Water path was designed only in the pedestal, where the water path diameter was narrowed to 1 mm at the top (see the zoom-in figure) to avoid membrane filter damage during swelling. Water path in the top cap was not designed since tubes connected to this path unavoidably introduces the extra axial force obstructing swelling deformation (this force will be larger for small apparatus). The natural rubber membrane with a diameter of 30 mm and thickness of 0.3 mm was used to isolate the specimen from the cell liquid (i.e. distilled water) and the two ends of the rubber membrane were sealed by four rubber bands. The shaft (diameter: 6 mm) connecting to the top cap was guided by a bearing installed inside of the cell, which simplifies apparatus design though only isotropic confining condition can be applied. The inner diameter of the cell (i.e. the acrylic pipe) was minimized to 70 mm, on which a 20 mm-thick acrylic plate was used to cover the cell.

(2) Volumetric deformation monitoring system
Two ways were applied to monitor the specimen volume change, the local measurement using several LDTs, and the global measurement from the movement of cell water by a differential pressure transducer (DPT). For the former one, three commercial LDTs was employed, one LDT (resolution 0.01 mm, capacity: 30 mm) measures axial movement of shaft and two LDTs (resolution 0.001 mm, capacity: 10 mm) targets on the rubber membrane for radial deformation. For the two radial LDTs, one monitors bottom (~2 mm from the pedestal) and another one focuses at the middle part (~5 mm from the pedestal). The average of the two radial LDTs measurements was taken as the radial deformation for volume calculation. The calibration factor of the LDTs changes when laser passes through acrylic wall or/and cell water due to difference of refraction indices for different materials. Calibration tests were conducted using a stepped cone shown in Fig. 2, where LDTs were initially fixed to the predetermined positions, then the cone was moved vertically using gauge blocks stepwise under different calibration conditions. Fig. 3 depicts calibration results for LDTs, where the calibration factor, comparing to the original factor in the air, slightly decreases when the laser passes through acrylic material, and increases for the axial LDT but decrease further for the radial LDT when passing through acrylic material and the cell water (two radial LDTs were checked several times, not shown herein, and the trend was always the same). The setting positions for the LDTs were fixed during all tests conducted in this study to avoid calibration factor change.


For the global measurement, a double-wall burette was connected to the cell water, and the burette water level change was monitored by the DPT (Fig. 1). With the condition that the cell was fully filled with water, any specimen deformation, theoretically, induces water level change of the double-wall burette. This method was similar as the double−wall system proposed by Wheeler31). Though this method was said to be difficult to handle, the measurement system design is much simpler than the case using the double − cell method. The calibration of the DPT was very straightforward (not shown), while the effect of room temperature was not small. Fig. 4 presents the burette water level change monitored by the DPT where no in/outflow from the burette. The change was expressed in terms of the volumetric strain (εv) with respect to a specimen with diameter of 20 mm and height of 10 mm. Clearly, εv varies within ~1% following temperature (T). The room was adjusted by an air conditioner at ~23 °C, while during the work of this study, T sometimes varied largely due to season weather change (data in Fig. 4 is an extreme case).

(3) Testing procedure
A calcium type bentonite, Kunibond, mined from Japan was used for all tests of this study. Physical properties of Kunibond are shown in Table 1, where testing details are noted below the table. A specimen was prepared by static compaction using an oil jack, after which specimen dimensions and mass were measure to get initial dry density (ρdi). Then the rubber membrane was fixed to the pedestal, the specimen was placed on the pedestal, the top cap was guided to touch with the specimen surface, and then the top end of the rubber membrane was fixed. Herein, the length of the rubber membrane between the top cap and the pedestal was set longer than the specimen height, so that axial deformation of the specimen would not be obstructed by the rubber membrane. It is not easy to install the specimen in such a very narrow space; specimen positioning and rubber membrane adjustment may be repeated several times. After this stage, pore air was exhausted by applying vacuum (~-100 kPa) from valve 3 while closing valve 2 (Fig. 1). Thereafter, the acrylic pipe and plate were fixed and water was filled into the cell from a water tank (valve 5) until overflow from valve 4, during which air in the cell was exhausted as most as possible. Cell air could not be completely removed, though many attempts were made, for instance, coating hydrophobic film to parts in the cell, applying vacuum, simplifying the part design etc. Air was particularly easily trapped in tiny spaces (e.g. in the bearing, small holes etc.), which was also a measurement error source as shown in later sections. Then, valve 5 was closed and valve 1 was open to cell water to the double-wall burette and a cell pressure of 20 kPa was applied from the burette (in this study, only 20 kPa case was tested). This state was kept for about a day in most cases to stabilize cell water, then the specimen was wetted by opening valve 2 and closing valve 3. When the swell deformation reached the equilibrium, the cell was dismantled and the specimen dimensions using a caliper and final water content (wf) by 110 °C oven dry were measured. The above procedure was the basic condition, further procedures for some specimens were made as mentioned in later sections and Table 2.

(4) Measurement methods for final volume change
Specimen diameter after the test was measured by a caliper at the bottom and middle positions roughly matching positions of LDTs and the were averaged as the final diameter for final volume calculation. It was not easy to accurately measure the diameter after the test since the specimen surface was very soft. Thus, two other ways, pycnometer method and water content method, were also used to estimate final volume change. The pycnometer method is illustrated in Fig. 5. The method is similar as the pycnometer method to measure particle density, while instead of filling water into the pycnometer, herein an organic, nonpolar solution, decahydronaphthalene (“decalin” for short), was used inspired by works in De Wit & Arens35) and Mackenzie36). Since water and decalin are immiscible and interlayer space of montmorillonite in bentonite is inaccessible to decalin (i.e. non-swelling in decalin), with the assumption that pore air (if any) inside the sample was also inaccessible, sample volume by Eqn. (1), and thus the dry density by Eqn. (2) can be obtained.

In these equations,
Mall: Total mass including decalin, sample and pycnometer.
M: Mass of the sample
Mpyc: Mass of pycnometer
V: Sample volume
Vpyc: Volume of pycnometer
w: Gravimetric water content
ρd: Dry density
ρdcl: Decalin density
The commercial decalin from FUJIFILM Wako chemicals (purity of > 95% with no further treatment) was used. The Vpyc was measured by filling distilled water only into pycnometer and measuring the mass. The ρdcl was measured by filling decalin only into pycnometer and measure the mass and temperature. All mass measurements were accurate to 0.1 mg or 0.01 mg. The relation between temperature and ρdcl is shown in Fig. 6. The temperature effect on ρdcl must be considered for reliable results, since decalin usually occupied most volume of in Vpyc in the tests. By knowing ρdcl, the bentonite specimen after wetting was cut into several blocks, part of which were used for the pycnometer test (photo in Fig. 5) and the rest were for wf measurement.
For the water content method, it simply uses Eqn. (3).
In Eqn. 3,
Gs: Specific gravity
Ms: Solid mass of the sample
Mw: Mass of pore water
Sr: Degree of saturation
Vs: Solid volume of the sample
Vw: Volume of pore water
ρs: Particle (solid) density
ρw: Free water density (=1.0 Mg/m3 in this study)
ρwp: Pore water density
By assuming full saturation (i.e. Sr =100%), ρd is obtained by Eqn. 4.
Pore water density (ρwp) must be properly considered, since it may exceed 1.0 Mg/m3 significantly in bentonites as uncovered by Wang37). With the same method, where bentonite specimens were fully saturated under the deformation constrained condition, ρwp of Kunibond was measured (Fig. 7). The results suggest that ρwp of Kunibond change linearly with ρd and the change is faster than that of the sodium bentonite in Wang37). In the pycnometer method, when ρd is known from Eqn. (2), ρwp can also be obtained by Eq. 5 with the assumption of full saturation.
The ρwp data calculated by Equation 5 for specimens after wetting tested in the triaxial system (Table 2) are also plotted in Fig. 7, which indicate that ρwp at the end of test is close to 1.0 Mg/m3. Thus, in ρd calculation by water content method (Equation 4), ρwp =1.0 Mg/m3 was used.
3. TEST RESULTS
Specimens tested by the triaxial system are summarized in Table 2 together with test results at the final stage.
(1) Global measurement by DPT
Basic testing procedure described above was applied to specimens No. 1-2 and typical results are shown in Fig. 8 (a). The εv measured by LDTs (εv_LDT) first sharply increases and then approaches equilibrium at wetting time (t) of 2.7 days. On the other hand, εv measured by the DPT (εv_DPT) first reaches a maximum at t of 0.9 day then decreases over time. The εv measured directly by the caliper after the test (εv_CLP) was indicated by a horizontal line. It is clear that final εv_LDT is slightly larger than εv_CLP, while final εv_DPT is ~20% smaller than it. The main reason of the much smaller εv_DPT was found to be the penetration of cell water into the specimen through two ends of the rubber membrane. This penetration causes the apparent increase of εv_LDT before wetting the specimen (i.e. during cell water stabilization) as indicated in the insert figure Fig. 8 (a). Because of this issue, inside surface at two ends of the rubber membrane was smeared with grease for specimens No. 3-8.

With the end grease, the typical results suggest a much better consistency of three εv measurements (Fig. 8 (b)). However, it was later found that this consistency can only last for a few days, and later εv_DPT slowly decreases over time (Fig. 8 (c)). The slow reduction was mainly induced by the cell water diffusion (or leakage) through the membrane body. The diffusion issue was particularly troublesome for long term tests (e.g. consolidation test for clay). Poulos38) recommended to use two natural rubber membranes or butyl rubber membrane to mitigate it. Leroueil et al.39) changed different cell liquids and recommended silicone oil instead of water. For conditions in this study, butyl rubber membrane or two membranes would be too stiff to be used, or silicone oil, trial tests (not shown) showed it would not be a good liquid for volume measurement since volume change of silicone oil induced by temperature change was about 30 times higher than that of water. Thus, instead of the above methods, outer surface of the rubber membrane was smeared with grease throughout. This can be easily done by applying a small back pressure to expand the membrane outward after fix the specimen to the apparatus (the grease smeared to the inside surface of two ends of the rubber membrane should be done after this process, otherwise, two ends may easily move by the membrane expansion).
By smearing the grease, εv_DPT reduction was not observed in a duration of 2 weeks as shown in Fig. 8 (d), however, final εv_DPT was still about 15% smaller than εv_CLP. The main reason was expected to be cell trapped air dissolution into cell water and the system creep. To deal with this issue, the cell water stabilization period was extended to 8 days for specimen No. 9 (insert figure of Fig. 8 (e)). Though until then, εv_DPT does not completely equilibrate, after supplying water to the specimen, εv_DPT finally reached equilibrium with 2.4% smaller than εv_CLP. Note that because of annual equipment maintenance, there was a period for cell pressure and data recording lose, while after then, swelling deformation seems to recover to expected paths.
Except the above testing conditions, two more tests without filling cell water (i.e. no DPT measurement) were conducted. It was found that cell air can much more easily to pass through the rubber membrane than cell water regardless of smearing grease or not. As a result, as shown in Fig. 9, rubber membrane expanses (separates from the specimen) and the specimens could not be fully saturated. This result suggests that cell water (liquid) is necessary for relatively long-term test regardless of measurement methods.
(2) Local measurement by LDTs
Fig. 8 indicates that final εv_LDT is often larger than εv_CLP, which seems to be mainly induced by relatively larger measurements of radial LDTs. Typical LDTs measurements are shown in Fig. 10 in terms of axial strain (εa_LDT), radial strain at the bottom (εr_LDT_B) and at the middle (εr_LDT_M). The corresponding measurements by the caliper after the wetting (εa_CLP, εr_CLP_B and εr_CLP_M) was also indicated by horizontal lines. Apparently, radial strain difference is larger than axial strain. Fig. 11 compares the εa and εv measured by caliper and the LDTs for all specimens tested in this study, which indicates that for most specimen εa_LDT is 0.5% larger εa_CLP and εr_LDT is 1.7% larger than εr_CLP in maximum.


The radial strain difference may be partially induced by the rounding of rubber membrane at two ends of the specimen (Fig. 9 shows an extreme case of this issue). Since specimen diameter is smaller than the pedestal, the membrane was stretched inward by the cell pressure and initially applied negative back pressure. It was found that the membrane often slightly rebound being separated from the specimen surface at the specimen ends. To mitigate this issue, specimen diameter was changed from 20 mm to 25 mm from specimen No. 7 so that specimen diameter was close to that of the pedestal after wetting. However, this should not be the only reason since radial LDT at middle also gave larger value. Another possible reason is thickness change of the rubber membrane. Fig. 12 shows two sets of data measured by the two radial LDTs, in one set, laser was targeted on the rubber membrane fixed to the stepped cone in Fig. 2 and in another one, it was directly on the steel surface of the stepped cone. Clearly, εr targeted on the rubber membrane has an increasing trend, meanwhile εr variation targeted directly on the stepped cone was very small. This explanation, however, would also be partially or occasionally correct, since in many cases, εv_LDT did not always increase during cell water stabilization period (e.g. Fig. 8 (b), (c) or (d)). Additionally, 1.7% axial strain corresponds to a thickness change of 0.17 mm, which seems too large to the 0.3 mm thick membrane. Calibration with laser targeted on the membrane were also conducted, which did not show big difference from that targeted on steel surface.

(3) Comparison between different methods
In Fig. 13, εv_CLP is compared to final values of εv_DPT and εv_LDT, and values based on final w method (εv_w) and pycnometer method (εv_pcn) for all tests in this study (numbers beside the data point are specimen No.). As explained above, most εv_DPT values were much smaller than εv_CLP values because of membrane end leakage, membrane diffusion and cell air dissolution issues. By taking countermeasures, a difference of 2.4% from εv_CLP was achieved (specimen No. 8) by this method. For εv_LDT, interestingly, many data are on the +4% line from the 1:1 line regardless of testing conditions. For the value of specimen No. 8, the smaller value was induced by smaller εa measurement by the axial LDT (Fig. 11).

The εv_w and εv_pcn are very close to εv_CLP with a maximum difference of about 3% except εv_pcn of specimen No. 1. For this specimen, the difference may be a procedure induced error, where a 10 ml pycnometer was used, of which the opening was too small to put sample into it easily and more time was used to adjust the testing procedure. For the rest of the tests, a 25 ml pycnometer was used. Nevertheless, the correlations between εv_CLP, εv_w and εv_pcn are better than initially expected suggesting water content and pycnometer method can be good ways to measure εv of saturated or nearly saturated bentonite.
4. DISCUSSION
Table 3 summarizes feature of the four volume change measurement methods applied to the triaxial system in this study. The method accuracy was indicated by the maximum variations of absolute volume change (α in ml) and εv (β in %) comparing to the caliper measured value (surely, there was also error in the caliper measurement). The β seems quite large comparing to that of most currently available methods applied to standard size specimens (e.g. diameter 50 mm, height 100 mm) reported in Laloui et al.15), however, α of this study is smaller than most of them. Additionally, the same accuracy level as this study would be easily achieved for standard size specimen considering many technical difficulties during a long- term test duration. Considering the usually very large volume change of compacted bentonite, the accuracy achieved in this study would be acceptable both practically and academically.
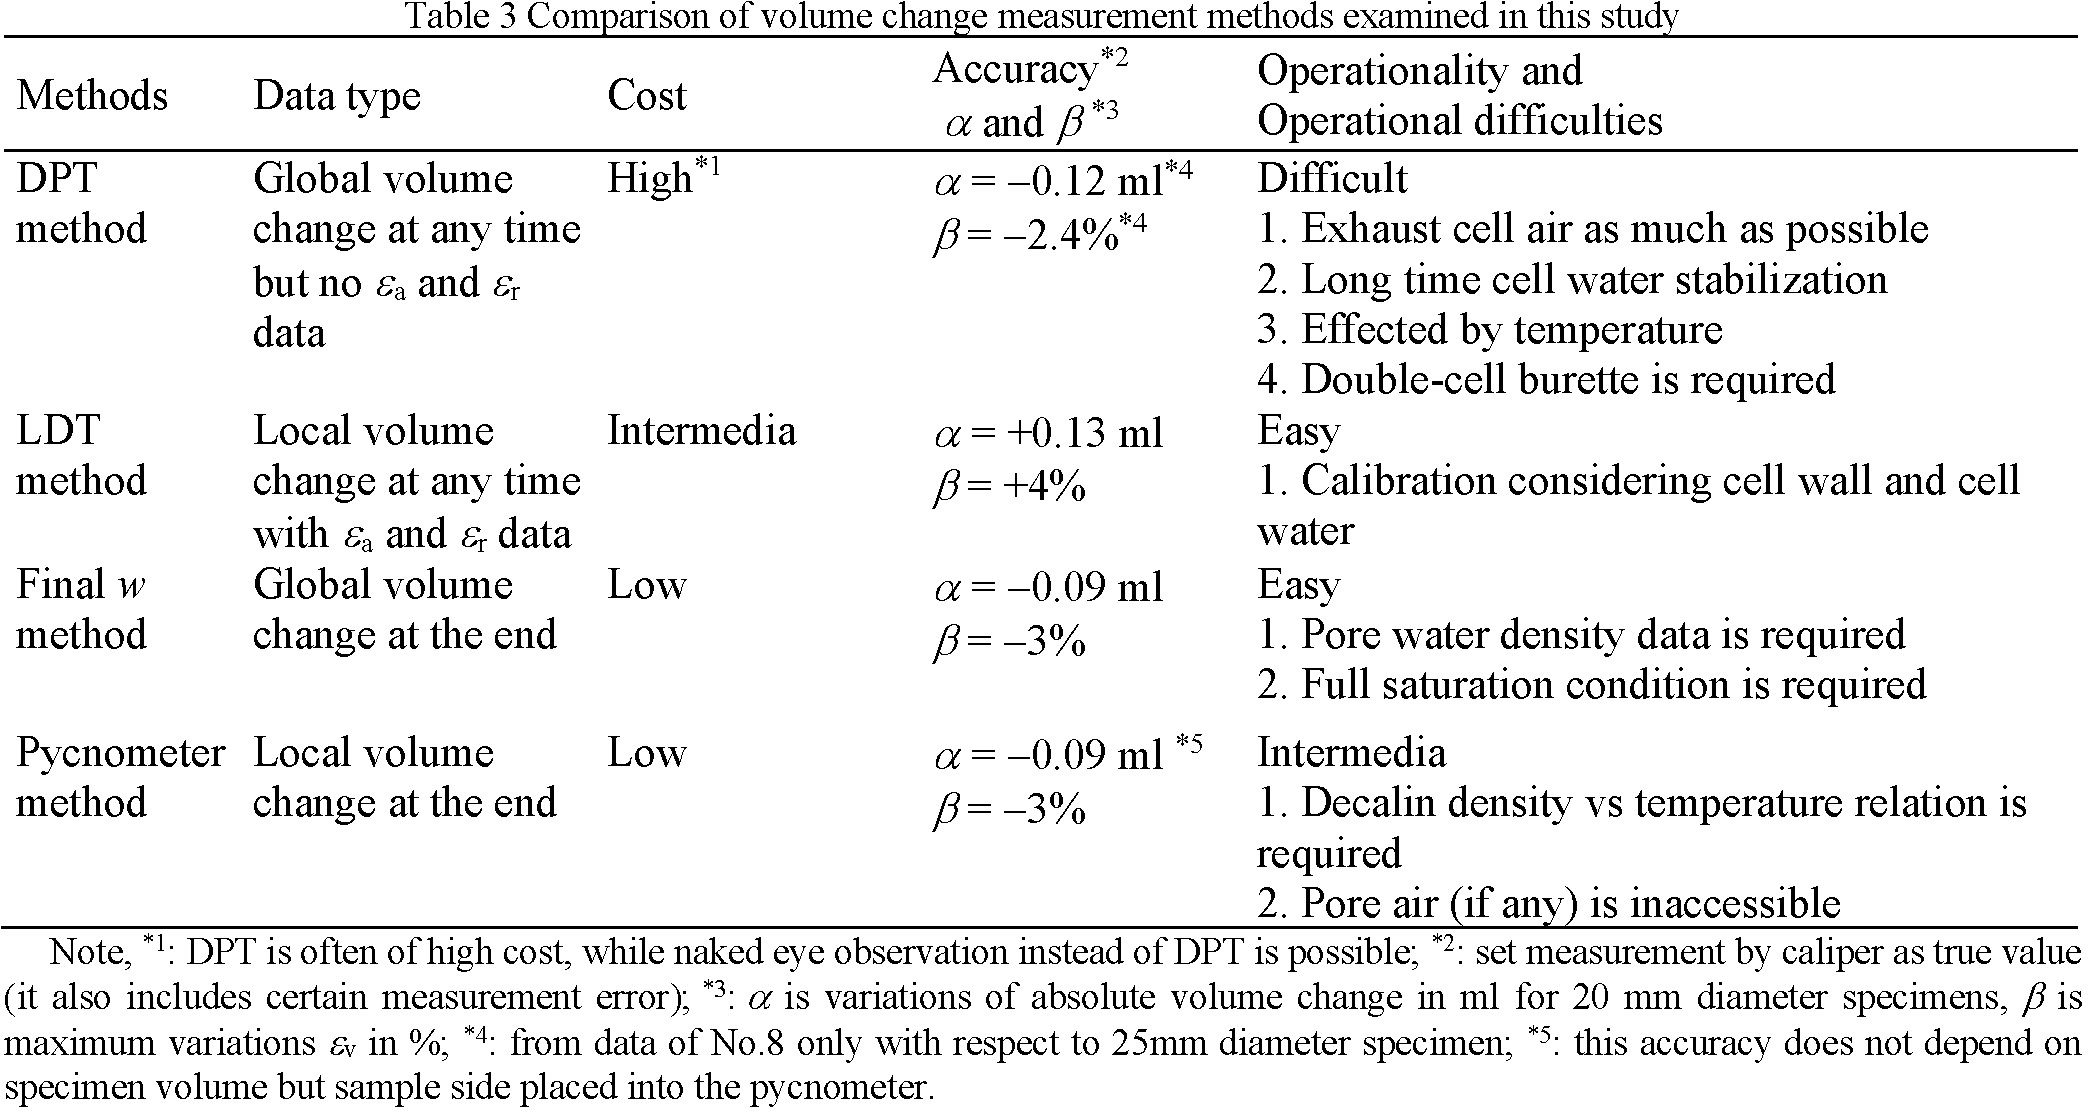
Among all four methods, LDT method seems most applicable for industrial practices because of the relatively easy operation and intermedia cost. The measurement accuracy may be improved by more or better LDTs, or using PIV technique. Though relatively good accuracy was achieved finally by the DPT method, many items such as DPT calibration, long term stability, burette water evaporation, temperature effect, cell water dissolution, etc. need to be examined to achieve such an accuracy. Thus, this method might be optional and need further examination. For the final w and pycnometer methods, though time history of εv is not available, in case of purpose of collecting the final state data, these two methods would be very good one for confirmation of the directly measured data by caliper or for cases that direct measurement is unavailable. However, these methods can basically be applied to saturated or nearly saturated samples.
5. CONCLUSIONS
An isotropic-confining triaxial system was developed for 3−D swelling deformation test of compacted bentonite specimens being wetted by water. To measure the volume change of the specimen with relatively small size (diameter < 30 mm and height of 10 mm), four volume change measurement methods were applied. Test results suggest that the accuracy of the four methods are better than many currently available methods applied to standard size specimen in the triaxial system.
In terms of operationality, the method to monitor cell water in/outflow using a differential pressure transducer is not easy practically, though best accuracy was achieved among four methods. The membrane leakage, cell water diffusion and trapped cell air dissolution issues need to be carefully dealt with to achieve reliable measurement. Local measurement method using laser displacement transducers seems most easy for operation though its accuracy was relatively low. Final water content and pycnometer methods were of relatively good accuracy and easy operationality, however these two methods are basically only applicable to saturated or nearly saturated specimens.
Bentonite is often used as a water barrier material in the waste disposal facilities because of its very low water permeability. However, the very long testing duration on bentonites is always a big difficulty in both practice and research. Currently, it is still in the state of collecting experimental data of the bentonite properties under different environment, while, particularly in the very complexed disposal facilities environment (e.g. for radioactive waste), the needs will be very high to use the existing data for material behavior prediction borrowing the power of data science.
Acknowledgments
This research was partially supported by the Corporate Sponsored Research Programs, “The science of the extension of infrastructure lifetime”, JSPS KAKENHI Grant Number 22K04320. This study is part of the achievement of the research collaboration with Taisei Corporation. Mr. Hao Wang, a doctoral student at Waseda University gave the author very helpful information during development of the system.
References
- 1) Komine, H. and Ogata, N.: Experimental study on swelling characteristics of compacted bentonite. Can. Geotech. J., Vol 31, No. 4, pp. 478-490, 1994. https://doi.org/10.1139/t94-057.
- 2) Hoffmann, C., Alonso, E.E. and Romero E.: Hydro-mechanical behaviour of bentonite pellet mixtures. Phys. Chem. Earth, Pts A/B/C Vol. 32, No. 8-14, pp. 832-849, 2007. https://doi.org/10.1016/j.pce.2006.04.037
- 3) Villar, M.V. and Lloret, A.: Influence of dry density and water content on the swelling of a compacted bentonite. Appl. Clay Sci. Vol 39, No. 1-2, pp. 38-49, 2008. https://doi.org/10.1016/j.clay.2007.04.007
- 4) Sun, D., Cui, H. and Sun, W. Swelling of compacted sand-bentonite mixtures. Appl. Clay Sci. Vol. 43, No. (3-4), pp. 485-492, 2009. https://doi.org/10.1016/j.clay.2008.12.006
- 5) Chen, Y.G., Jia, L.Y., Li, Q., Ye, W.M., Cui, Y.J. and Chen, B. Swelling deformation of compacted GMZ bentonite experiencing chemical cycles of sodium-calcium exchange and salinization-desalinization effect. Appl. Clay Sci., Vol. 141, No. 1, 55-63, 2017. https://doi.org/10.1016/j.clay.2017.02.016
- 6) Wang, H., Komine, H. and Gotoh, T.: A swelling pressure cell for X-ray diffraction test. Geotechnique Vol. 72, No. 8, pp. 675-686, 2022a. https://doi.org/10.1680/jgeot.20.00005.
- 7) Wang, H., Ruan, K., Harasaki, S. and Komine, H. Effects of specimen thickness on apparent swelling pressure evolution of compacted bentonite. Soils Found. 62, No. 1, 101099, 2022b. https://doi.org/10.1016/j.sandf.2021.101099.
- 8) Watanabe, Y. and Tanaka, Y.: Swelling pressure of compacted bentonite acting on constraining material with deformability. Geotechnique, Vol. 73, No.2, pp. 95-104, 2023. https://doi.org/10.1680/jgeot.20.P.348
- 9) Graham, J., Saadat, F., Gray, M. N., Dixon, D. A. and Zhang, Q.-Y.: Strength and volume change behaviour of a sand-bentonite mixture. Can. Geotech. J., Vol. 26, No. 2, 292-305, 1989. https://doi.org/10.1139/t89-038.
- 10) Cui, H., Sun, D. and Matsuoka, H. Swelling characteristics of sand-bentonite mixtures under isotropic and anisotropic stress states. J. Japan Soc. Civ. Engrs, Ser. C (Geosphere Engng), Vol. 62, No. 3, p. 657-666, 2006. https://doi.org/10.2208/jscejc.62.657 (In Japanese)
- 11) Lee, J., Lim, J., Kang, I. and Kwon, S.: Swelling pressures of compacted Ca-bentonite. Eng. Geol., Vol. 129-130, No. 1, pp. 20-26, 2012. https://doi.org/10.1016/j.enggeo.2012.01.005.
- 12) Saba S., Barnichon J.D., Cui Y.J., Tang A.M. and Delage P. Microstructure and anisotropic swelling behaviour of compacted bentonite/sand mixture. J. Rock Mech. Geot. Eng., Vol. 6, No. 2, p. 126-132, 2014. https://doi.org/10.1016/j.jrmge.2014.01.006.
- 13) Bernachy-Barbe, F.: Homogenization of bentonite upon saturation: Density and pressure fields. Appl. Clay Sci., Vol. 209, 106122, 2019. https://doi.org/10.1016/j.clay.2021.106122.
- 14) Dieudonné, AC., Gatabin, C., Dridi, W., Talandier, J., Collin, F. and Charlier, R.: Heterogeneous Swelling of an Isotropically Compacted Bentonite-Based Material: Experimental Observations and Modelling. Rock Mech. Rock Eng., Vol. 57, pp. 4159-4172, 2024. https://doi.org/10.1007/s00603-023-03476-z
- 15) Laloui, L., Peron, H., Geiser, F., Rifa’I, A. and Vulliet, L.: Advances in Volume Measurement in Unsaturated Triaxial Tests. Soils Found., Vol. 46, No. 3, pp. 341-349, 2006. https://doi.org/10.3208/sandf.46.341
- 16) Hoyos, L. R., Laloui, L. and Vassallo, R.: Mechanical Testing in Unsaturated Soils. Geotech. Geol. Eng., Vol. 26, No. 6, pp. 675-689, 2008. https://doi.org/10.1007/s10706-008-9200-9
- 17) Bishop, A.W. an d Donald, I. B.: (1 961), The experimental study of partly saturated soil in triaxial apparatus. In Proc. 5th Int. Conf. SMFE, pp. 13-21, 1961.
- 18) Cui, Y. J. and Delage, P.: Yielding and Plastic Behaviour of an Unsaturated Compacted Silt. Geotechnique, Vol. 46, No. 2, pp. 291-311, 1996.
- 19) Toyota, H., Sakai, N. and Nishimura, T. Effects of stress history due to unsaturation and drainage conditions on shear properties of unsaturated cohesive soil,” Soils Found., Vol. 41, No. 1, pp. 13-24, 2001.
- 20) Aversa, S. and Nicotera, M. V.: A Triaxial Apparatus for Testing Unsaturated Soils. Geotech. Test. J., Vol. 25, No. 1, pp. 3-15, 2002.
- 21) Ng, C. W. W., Zhan, L. T. and Cui, Y. J.: A New Simple System for Measuring Volume Changes in Unsaturated Soils. Can. Geotech. J. Vol. 39, No. 3, pp. 757-764, 2002. https://doi.org/10.1139/t02-015
- 22) Wang, H., Sato, T., Koseki, J., Chiaro, G. and Tan Tian, J.: A system to measure volume change of unsaturated soils in undrained cyclic triaxial tests. Geotech. Test. J. Vol. 39, No. 4, pp. 532-542, 2016. https://doi.org/10.1520/GTJ20150125.
- 23) de Campos, T. M. P., Carvalho, T. M. O. and Viana, A. C. C. Total volume change measurement of unsaturated soil in triaxial tests: a new approach. Geotech. Test. J., Vol. 44, No. 2, pp. 392-406, 2021. https://doi.org/10.1520/GTJ20200002
- 24) White, D. J., Take, W. A., Bolton, M. D. and Munachen, S. E. A deformation measurement system for geotechnical testing based on digital imaging, close-range photogrammetry, and PIV image analysis. In Proceedings of the international conference on soil mechanics and geotechnical engineering, Vol. 1, pp. 539-542, 2001.
- 25) Klotz, U. and Coop, M.: On the identification of critical state lines for sands. Geotech. Test. J. Vol. 25, No. 3, pp. 289-302, 2000.
- 26) Zhang, X., Mavroulidou, M., Gunn, M.J., Sutton, J., Cabarkapa, Z. and Kichou, Z.: Application of a novel laser sensor volume measurement system to the triaxial testing of an unsaturated lime-treated soil. Acta Geotech. Vol. 9, No. 6, pp. 945-957, 2014. https://doi.org/10.1007/s11440-013-0254-3
- 27) Yang, Y., Kuwano, R. and Xu, C.: A preliminary study on the piping erosion of soils using glucose dissolution method. Environ. Earth Sci., Vol. 77, No. 2, pp. 31, 2018. https://doi.org/10.1007/s12665-017-7191-7
- 28) Zhao. C., Koseki. J. and Sasaki, T.: Image based local deformation measurement of saturated sand specimen in undrained cyclic triaxial tests. Soils Found., Vol. 58, No. 6, pp. 1313-1325, 2018. https://doi.org/10.1016/j.sandf.2018.07.008
- 29) Nishimura, T., Koseki, J., Fredlund, D.G. and Rahardjo, H.: Microporous membrane technology for measurement of soil-water characteristic curve. Geotech. Test. J. Vol. 35, No. 1, pp. 201-208, 2012. https://doi.org/10.1520/GTJ103670.
- 30) Wang, H., Koseki, J., Nishimura, T. and Miyashita, Y.: Membrane filter properties and application of the filter to undrained cyclic triaxial test of unsaturated materials. Can. Geotech. J., Vol. 54, No. 8, pp. 1196-1202, 2017. https://doi.org/10.1139/cgj-2016-0507.
- 31) Wheeler, S.J.: The undrained shear strength of soils containing large gas bubbles. Geotechnique, Vol. 38, No. 3, pp. 399-413, 1988. https://doi.org/10.1680/geot.1988.38.3.399
- 32) JIS: Test method for methylene blue adsorption on bentonite and acid clay. Japanese Industrial Standards Committee, JIS Z 2451:2019.
- 33) JBAS: Cation exchange capacity (CEC) measurement method for powder bentonite, JBAS, JBAS 106-77, 1977.
- 34) Shirakawabe, T., Wang, H., Komine, H. and Morodome, S.: On methods to measure cation exchange capacity and leached cations of bentonites. Japanese Geotechnical Journal, Vol. 17, No. 1, pp. 61-71, 2022. https://doi.org/10.3208/jgs.17.61 (in Japanese)
- 35) De Wit, C. T. and Arens, P. L. Moisture content and density of some clay minerals and some remarks on the hydration pattern of clay. In Fourth international congress of soil science transactions, Vol. 2, pp. 59-62, 1950. Groningen, the Netherlands: Hoitesema Brothers.
- 36) Mackenzie, R. C. Density of water sorbed on montmorillonite. Nature, Vol. 181, No. 4605, pp. 334-334, 1958. https://doi.org/10.1038/181334a0.
- 37) Wang, H.: Pore water density in a saturated bentonite. Géotechnique, in-press. https://doi.org/10.1680/jgeot.22.00247
- 38) Poulos, S.J.: Report on control of leakage in the triaxial test. Harvard Soil Mechanics Series, No. 71, 1964..
- 39) Leroueul S., Tavenas, F., Rochelle, P. and Tremblay, M.: Influence of filter paper and leakage on triaxial testing. In Advanced Triaxial Testing of Soil and Rock, ASTM STP 977, pp. 189-201, 1988.


