Abstract
Currently, the prediction of rockfall motion for the design of rockfall protection works is generally based on empirical methods or two-dimensional mass point analysis methods. These methods do not consider the detailed three-dimensional topography and shape of falling rocks, and there are concerns about the rational and safety aspects of the designed protection works. Therefore, this study attempts to apply a three-dimensional simulation using a Discontinuous Deformation Analysis. While this method can predict detailed rockfall motion considering the shape and physical properties of falling rocks and slopes, the establishment of the input parameters and the shape of falling rocks is an issue. Therefore, in this study, parametric studies on input parameters and rockfall geometry were conducted and their setting methods were investigated. Then, we compared the results with those of a two-dimensional mass point analysis method in a real site, and discussed a simulation technique for designing a rational and safe rockfall protection system. The results of this study show that the three-dimensional simulation using the Discontinuous Deformation Analysis can obtain good analysis results by considering the shape of falling rocks at the site and the characteristics of energy decay during impact. It was also found that the analysis of the actual site can predict the three-dimensional falling rock motion considering the falling rock and slope geometry, and that a rational and safe design of falling rock protection works can be expected compared to the two-dimensional mass point analysis method.
1. BACKGROUND AND PURPOSE OF THE STUDY
Rockfall is a frequent natural hazard in mountainous regions that poses a serious threat to roads, buildings, and people’s safety due to its unpredictability and destructive power. Especially in Japan, where the terrain is complex and mountainous and hilly, rockfall disasters occur frequently and pose a significant challenge to the country’s disaster prevention and mitigation efforts.
When the rainy season and typhoon season arrive, large amounts of rainfall saturate the soil, loosening rocks and causing rockfalls. These falling rocks not only damage transportation infrastructure and threaten the safety of people’s mobility, but can also directly impact residential areas, posing a serious danger to people’s lives and property. In recent years, with global warming, extreme weather events have become more frequent, and the frequency and severity of rockfall disasters have shown an increasing trend.
This year, rainfall in Japan was markedly higher than in past years, especially during the rainy season and typhoon season, which caused serious landslides in many areas. According to data from the Japan Meteorological Agency, this year’s rainfall has set new records in both frequency and intensity, which is closely linked to the frequency of extreme weather events caused by global warming.As shown in Figure 1.
In June of this year, rainfall in some areas of Japan was more than double that of the same period in previous years. In the Kyushu and Kanto regions in particular, daily torrential rains caused landslides and flooding in many places, seriously affecting the lives of residents and infrastructure. In these areas, river levels rose sharply, exceeding the warning line, and evacuation orders were frequently issued.
Furthermore, this year’s typhoon season started earlier than usual, with numerous typhoons hitting Japan. As a result, the already saturated soils deteriorated further, increasing the risk of mountain collapses and rockfalls. A particularly powerful typhoon in early July brought record rainfall to southern and central Japan, causing widespread mudslides and mountain collapses that forced the emergency evacuation of thousands of people.
In July 2023, torrential rains triggered by a rainy season front hit the Kyushu region, causing massive mudslides in Fukuoka and Oita prefectures. The disaster buried houses and caused multiple casualties. Roads were also cut off and transportation was severely affected.Shown in Figure 2.

To address this challenge, researchers are continually exploring and researching. Currently, rockfall research concentrates on methods such as field observations, physical modeling experiments, and numerical simulations. Among these methods, numerical simulation has become an important tool for rockfall research because of its efficiency, flexibility, and reproducibility. Discontinuous Deformation Analysis (DDA) has received widespread attention and use as an advanced numerical simulation method. By discretizing the rock body, this method simulates the complex behaviors of separation, collision, and friction during the rockfall process and provides a powerful tool to elucidate the mechanism of rockfall.
The velocity-energy ratio is an extremely important parameter in the study of rock fall. It reflects the ratio between kinetic and potential energy in the kinetic process of a rock. Under different velocity-energy ratios, the path of motion, energy consumption, and rolling behavior of rocks change significantly. Therefore, an in-depth study of the mechanisms by which velocity-energy ratios affect rockfall trajectories is not only of theoretical value, but can also provide powerful technical support for the prediction and prevention of rockfall hazards.
This study is developed based on this background and significance. We employed the DDA method to simulate rock motion paths under different velocity-energy ratios and explored the mechanism of the effect of velocity-energy ratio on rockfall trajectories through comparative analysis. Our results show that as the velocity-energy ratio increases, the rock rolls faster and the rolling distance increases, while friction and collision between the rock and the ground also increase, consuming more energy. These findings provide important clues for a deeper understanding of the mechanisms of rockfall and provide new perspectives and methods for the prediction and prevention of rockfall hazards.
We intend to continue to deepen our research in this area and explore other factors and mechanisms that influence rockfall, thereby making further contributions to disaster prevention and mitigation efforts.
2. OVERVIEW OF ANALYSIS METHODOLOGY
(1) Basic Theory of Discontinuous Deformation Method
Discontinuous deformation analysis (DDA) was developed by Shi, G. H. (1984) et al. with rock structures as the main analytical symmetry, and various variations of DDA have been developed, including three-dimensional DDA (3d-DDA) with an extension of two dimensions, DDA-Ellips with the introduction of circular and elliptical elements, and DDAball with three dimensions by employing a sphere element as a rigid body. DDAball, which employs a spherical element as a rigid body and is three-dimensional, and many other variations have been developed. The basic flow chart of DDA is shown in Fig.3. DDA is formulated using the rigid-body displacement defined by the block center of gravity, the rigid-body rotation, and the block strain as the main variables. The formulation consistently uses the potential energy minimization principle, and there is mathematical uniformity in its development.

There are various approaches to predicting falling rock movement, and combining the characteristics and advantages of each method can lead to more accurate predictions. First, empirical methods make predictions based on past examples of rockfalls and field survey data. This takes into account the slope angle, rock size and shape, surface soil and vegetation conditions, and previous rockfall history. Numerical methods then simulate falling rock movement using models based on physical laws. For example, the discrete element method (DEM) treats individual rocks as discrete elements and simulates their interaction and motion, while the finite element method (FEM) models the entire slope as a continuum and calculates internal stresses and deformation. Geographic Information System (GIS) methods integrate digital elevation models (DEM), geologic maps, soil maps, hydrologic data, and rainfall data, and use these data to identify rockfall hazard areas. Experimental methods use slope models and shaking tables to reproduce actual rockfall motions, and predictive models are built based on the results. Finally, statistical methods collect historical rockfall data and statistically analyze them to construct a probability model of rockfall occurrence. This includes regression analysis, multivariate analysis, and the use of Markov and Bayesian models. Appropriate combinations of these methods, complementing each other, can improve the prediction accuracy of falling rock movement.
The velocity-energy ratio (Velocity-Energy Ratio, VER) is an important indicator for quantitatively evaluating energy conversion during falling rock motion In empirical methods, falling rock kinetic energy prediction typically uses an evaluation equation (1. 1) based on historical falling rock experimental data.
where: kinetic energy of falling stone,: coefficient of rotational energy (=0. 1),: equivalent friction coefficient ,slope ,: falling stone weight [kN],: falling height of falling stone [m].
Where KE is kinetic energy, PE is potential energy, m is the mass of the falling rock, v is the velocity, g is the acceleration of gravity, and h is the height. The velocity-energy ratio can be used to evaluate how a falling rock distributes its energy during motion. This allows one to predict the kinematic behavior of a falling rock based on changes in velocity and height, and to set appropriate initial and boundary conditions for a realistic simulation. Velocity-energy ratios play an important role in the design and simulation of falling rock protection works to understand energy conversion and take efficient countermeasures.As shown in Figure 4.
(2) Non-Property Point Analysis Method
The non-particle analysis method is a method that considers the object’s shape and internal structure rather than treating it as a mass point in the analysis of falling rock motion, allowing for a more realistic and detailed analysis. This method analyzes the object’s behavior as a rigid or elastic body and simulates complex behaviors such as collision, friction, and deformation. The main methods for the analysis of nonmassive systems include the Finite Element Method (FEM), Rigid Body Dynamics (RBI), Discrete Element Method (DEM), and Discontinuous Deformation Analysis (DDA).
The Finite Element Method (FEM) analyzes the behavior of an entire object by dividing it into many small elements and solving the equations of motion for each element. This method is widely used for elastic deformation, plastic deformation, and collision analysis. Rigid body dynamics treats the object as a rigid body without deformation and solves the equations of motion to analyze the object’s position, velocity, and rotational motion. The discrete element method (DEM) treats the object as a large number of discrete elements and simulates the behavior of granular or crushed objects by calculating the contact and friction forces between each element. Finally, the discontinuous deformation method (DDA) divides an object into many blocks and analyzes the motion of each block to analyze the fracture and collapse behavior of rocks and ground.
Applications of DDA include simulation of rockfall motion, landslide analysis, landslide analysis, seismic analysis of structures, and collision analysis. In the simulation of falling rock motion, more realistic analysis is possible by taking into account the shape and impact behavior of the object. In landslide and landslide analysis, the behavior of soil particles and rock masses can be simulated, which is useful for disaster prediction and disaster prevention measures. In the analysis of structures, it contributes to safety design by analyzing the seismic performance of buildings and civil engineering structures and their behavior in the event of collisions.
The advantage of the nonmass point analysis method is that it can analyze the detailed behavior of objects. On the other hand, it is computationally intensive and time-consuming. In addition, the accuracy of analysis results depends on the accuracy of input data and models, so it is important to collect reliable data. The nonmassive point analysis method plays an important role in rockfall motion and structure analysis and is a powerful tool for more detailed and realistic simulations.
Various types of discontinuous deformation methods (DDA) have been developed, including three-dimensional DDA, two-dimensional elliptical DDA, and spherical rigid body DDA. In this section, we describe the three-dimensional rigid spherical element discontinuous deformation method (DDAball) used in this study. This method simplifies the computation of conventional three-dimensional DDA by making the falling rock shape a sphere or a rigid block of a collection of spheres, thereby reducing the computational cost17) . By reducing the computational cost, multiple trials of falling rock analysis (Monte Carlo simulation) are easier to perform than with conventional 3D DDA.
The rotation and translation of rigid bodies are based on Euler’s formula.Euler’s formula is one of the most important equations in mathematics, describing the relationship between the exponential function and trigonometric functions:
Where:
e is the base of the natural logarithm (approximately 2.718).
i is the imaginary unit, satisfying i * i = -1 .
x is a real number.
cos x and sin x are the cosine and sine trigonometric functions, respectively.
When x = τ, Euler’s formula simplifies to Euler’s Identity:
The formulation for rigid spherical elements follows the same procedure as that for polyhedral elements. However, since the element is a rigid body, the only unknowns are the rigid body translational displacements and rigid body rotations of the element, which is different from the two-dimensional DDA.The displacement variables related to the deformation of the rigid spherical element are the
rigid body displacement (μ0 ,v0 ,w0 and rx ,ry , rz) and rigid body rotation around X, Y, and Z axes at the center of gravity as shown in Figure 5.
The displacement (x,y,z) at any point (μ, v, w) in the rigid sphere element is expressed by using the six unknown variables mentioned above and the coordinates of the center of gravity (x0 ,y0 ,Z0 ) of the rigid body element as follows.Where, is the first-order displacement function of the rigid sphere, and in the calculation process, any displacement in the rigid sphere element at each time step is calculated and the position of the center of gravity is updated.
As in the two-dimensional DDA described in formula, the inertia force, viscosity term, object force, load term, etc. are incorporated into the external force term and stiffness term to form the stiffness equation. After that, we move on to the creation of the contact matrix and contact determination.
3. STUDY OF FALLING ROCK CONDITIONS WITH DIFFERENT VELOCITY-ENERGY RATIOS UNDER THE SAME SETTING OF DDA
(1) Overview
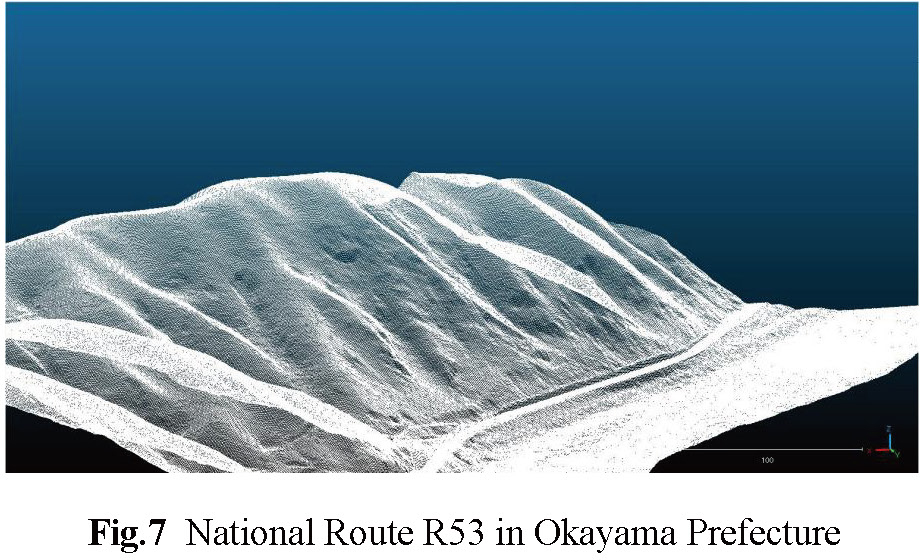
Based on the principle of the discontinuous deformation method described above, the following simulation experiment is performed when elements such as friction coefficient and inclination angle are the same. The rockfall point and location are in Okayama Prefecture. It is derived from the slope near the R 53 national highway. (Figure-6&7)
In the case of a known coordinate system, a txt file containing coordinate system data is directly substituted into the cloud compare program to show a three-dimensional model capable of representing the R 53 national highway. The coordinate data are derived from a prior LP topographic survey scan.
CloudCompare Program Overview includes:CloudCompare is an open-source 3D point cloud processing software primarily used for comparing, editing, and processing point clouds and triangular meshes. It was originally designed for comparison between two dense 3D point clouds, such as those obtained through a laser scanner. CloudCompare relies on a specific octree structure, which enables it to achieve outstanding performance when performing such tasks.
CloudCompare has a wide range of features, including point cloud filtering, registration, resampling, color/normal vector/scalar field processing, statistical computation, sensor management, interactive or automatic segmentation, and more. In addition, it also supports custom color gradients, calibrated image processing, OpenGL shaders, and other display enhancement tools. This software supports the import and export of multiple data formats, including open cloud formats such as ASCII, LAS, E57, as well as formats from manufacturers such as DP, Riegl, FARO, etc.
The user interface of CloudCompare is based on Qt, with graphics rendering using OpenGL, and supports Windows, MacOS, and Linux operating systems. Its latest version is 2.13.1, released in March 2024. The development of this software began in 2004 and was made open source in 2009. Its source code is currently available on GitHub.
CloudCompare has a wide range of applications in various fields, including architecture, cultural heritage conservation, industrial design, robotics, computer vision, autonomous driving, intelligent monitoring, gaming, training, interactive experiences, and medical diagnosis. Due to its efficient processing capability and flexible functionality, CloudCompare has gained widespread recognition and application in the field of 3D point cloud data processing.
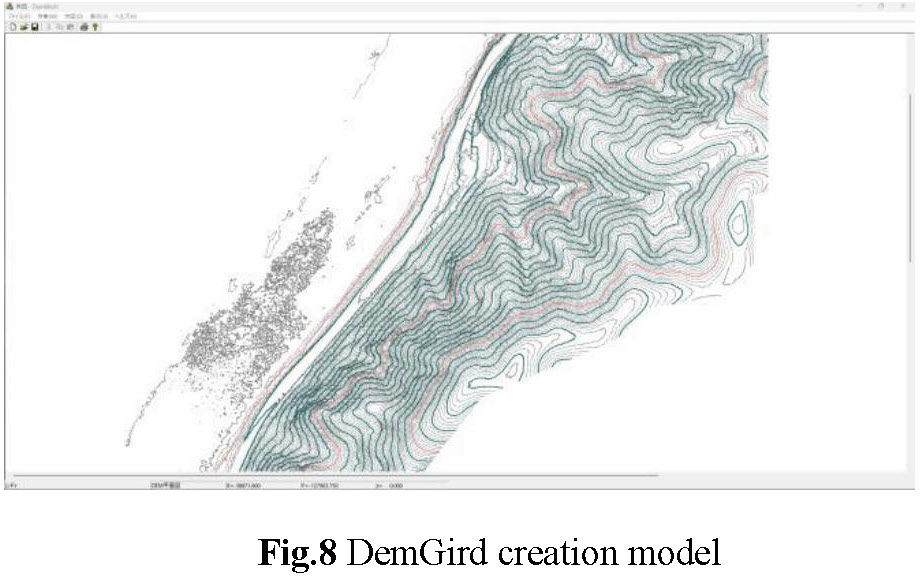
Regarding the creation of a slope model, the corresponding image is displayed only after entering elements according to the rules, and the height and slope of the wall element are described as the rules, and the diameter and mass of the sphere element are described. Elements such as mass are described. Figure 8 shows the contour map of R53 National Highway in Okayama Prefecture (displayed using DemGrid)
If you enter the corresponding elements according to the rules, you will get a TXT file.
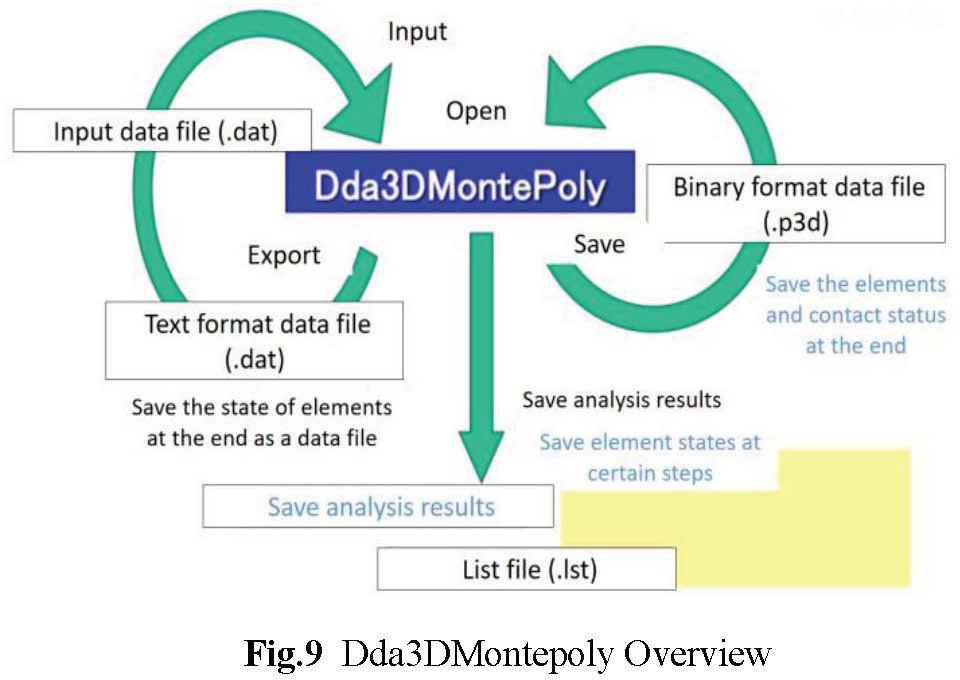
The running logic of the software is shown in Figure 9.
After obtaining the coordinate family diagram of the R 53 national highway with LP, we obtain the list of coordinate systems with cloudcompare software, convert it to a TXT file, encode it in UTC-8 encoding format, and bring it into DemGrid software, and then we can obtain a model like Figure.10.
Figure 10 shows the logic of software simulation running, based on which multiple simulations of the rockfall process can obtain more accurate data.
(3) Preparation before starting simulation calculation (overview of Dda3DMontepoly)
(1) 3D Modeling
Dda3DMontePoly(Ver2.0) DDA is a three dimensional DDA spherical element analysis program, which has the function of considering many elements and some analytic objects except spherical elements. Figure 9 shows the operational logic of the Dda3DMontepoly software.
Available elements
Spherical elements: basic elements for analysis of behavior.
Block element: assembly of spherical elements An indeterminate block is modeled.
Wall elements : surface elements for setting boundaries. Elements other than sphere elements and elements other than block elements are not contacted. The element shape is a rectangle or triangle, and this element is combined to model the slopes and structures.
Cylindrical elements: columnar elements, but both ends of the element are elements for modeling hemispherical shapes. Elements other than spherical elements and elements other than block elements are not contacted.
Spherical obstacle elements: elements for modeling spherical structures. Spherical elements and elements other than block elements are not contacted.
The analysis function of the software:
Point load: configurable to spherical and block elements.
Forced displacement can be set to all elements. Constant displacement and time varying forced displacement can be set.
Setting of velocity data: for spherical and block elements, setting of interparticle fluid velocity data.
Pore water pressure data setting: for spherical and block elements, pore water pressure and its gradients are used.
Bolt coupling: the bolted joint of the spherical element, the vertical stiffness and the cross section rigidity of the bolt can be applied. The axial force and cross sectional force acting on the bolt are retained.
Bond bond: used to combine bond element. Sphere and block elements of spherical elements.
Time counting: automatic setting and selection of specified values are possible.
Penalty: automatic setting and selection of specified values are possible.
Contact parameters: adjustable for all parameters.
Drawing function: projection direction can be set arbitrarily
Contact force vector diagram.
Simultaneous equations: an indirect method (CG method) and a direct method (skyline method) can be selected.
Other functions of the software:
Contactless: the average number of contactless per ball element constituting a spherical element and a block element is limited to 100.
Number of available elements: there is no limit on available numbers for all elements, but the number of available elements is limited in the implemented memory capacity.
It can handle complex 3D geometry and supports detailed modeling of bedrock and geological structures.You can define blocks of various shapes, including rectangular parallelepiped, spheres, and complex polyhedrons.(Figure-11)
Mesh generation: Automatically generate high-quality 3D meshes to improve the accuracy and efficiency of calculations. Mesh refinement and customization are possible.
Setting boundary conditions:
Multiple boundary conditions can be set (fixed, free, load, friction, etc.).Force and displacement constraints can be defined in detail.
(2) Numerical Analysis
Discontinuous Deformation Analysis (DDA):
A 3D DDA algorithm is used to perform dynamic analysis of discontinuities.
The motion of each block (translation and rotation) is analyzed and the contact and friction forces between the blocks are calculated.Monte Carlo simulation: A probabilistic analysis is performed by combining Monte Carlo methods.Numerous simulations are performed to evaluate the distribution of results, taking into account initial conditions and uncertainties in material properties.
(3) Analysis Function
Contact analysis:
Analyze the contact between blocks in detail and track the change in contact force.The friction force is calculated using a Coulomb friction model, etc.
Strain and stress analysis:
Calculate the strain and stress distribution within each block and analyze the details of the internal deformation.Assess stress concentration and fracture risk in the block.
Time Integral:Numerical integration techniques are used to update the position, velocity, and rotation speed of the blocks at each time step.Stable and efficient time integration techniques are used (e.g.Newmarks method).
(4) Output and Visualization
Result Visualization:
You can visualize the analysis results in 3D, and visually check the movement and deformation of the block.You can generate animations to show changes over time.
Data output:Analysis results can be output in various formats (text, CSV, graphical files, etc.).
Generate detailed reports ofresults and document the analysis process.
Dda3DMontepoly is a powerful tool dedicated to 3D discontinuous deformation analysis. It is used to analyze the detailed dynamic behavior of discontinuities and to understand the mechanical behavior of complex geological structures. In particular, by combining Monte Carlo simulations, analysis from a probabilistic perspective is possible and more realistic evaluation is possible. For researchers and engineers, this software is expected to be used in fields such as geology, rock mechanics, and earthquake engineering.
Preparation before starting simulation calculation (simulation calculation influence factor setting interface)
(1) Contact Parameter
As shown in Figure.12, the analysis procedure of Dda3DMontepoly
(2) Confirmation of Analysis Parameters and Execution of Analysis
● Import data files
● Drawing and display the analysis model at an appropriate size and perspective
Confirmation and correction of analysis parameters Check the analysis parameters set in the data file. Modification of analysis parameters as necessary.
Setting up Monte Carlo Simulation.
Setting the type ofrandom number and the number of trial calculations.
Set variations in speed-energy ratio, friction angle, viscosity coefficient, and slope roughness.The velocity-energy ratio and sliding friction angle are set by specifying the boundary number.The viscosity coefficient is set by specifying the material number. Running Monte Carlo Simulation.When the analysis is executed, the value of the variable parameter is generated by random numbers for each trial analysis, the analysis is executed, and the analysis result file is automatically generated.
4. STUDY OF ROCKFALL TRAJECTORIES BASED ON DIFFERENT VELOCITY-ENERGY RATIOS UNDER DDA
Before conducting simulation experiments, modifications can be made to the drawing settings of the imported topographic map, with specific parameters shown in Figure 13.
In this study, actual rockfall point coordinates are used, and the coordinates are derived from field surveys, and this time Okayama Prefecture is used. The slope of the R53 National Highway was investigated, and the simulation study was carried out by using the rockfalls of the field target No.11 and 14. The trajectory study of two-point rockfalls with different velocity-energy ratios can analyze the jump height and falling speed of rockfalls at each time point, which is of important reference value for the establishment of road protection facilities.(Figure-14)
(1) Creating slope models
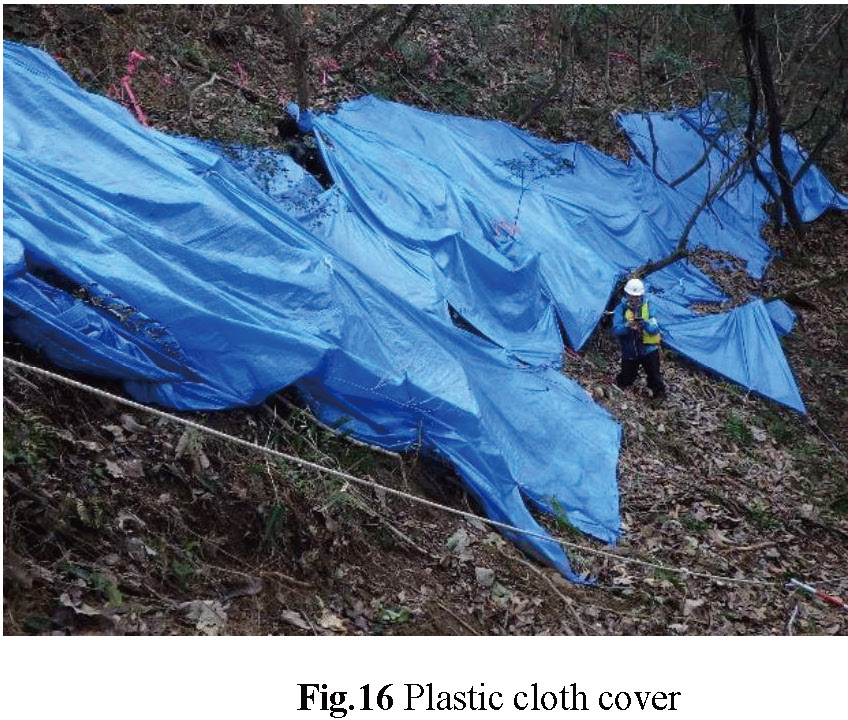
The site of this study is located on the mountain surface on the west side of Yoshida, Takebe-cho, Kita Ward, Okayama Prefecture, with Asahikawa under the slope, and National Highway R53 is located directly below the slope(Figure-15). There are stones on the slope that can be observed with the naked eye. On-site investigations that day revealed that a landslide had occurred on this slope, and a prominent plastic sheet had been laid at the site of the landslide, making the missing part clearly visible on the slope. As shown in Figure 16, some dangerous stones have been covered with blue plastic sheeting.
In this study, 11 points 1 and 14 were selected as research subjects, and the specific locations are shown in Figure-19 below.The selection position of point 11 is located on the convex surface of the mountain, while the selection position of point 14 is located on the concave surface at the same altitude.
(2) Input Parameters
In this study, the numerical attenuation characteristics of DDA are utilized, and the dependence of the energy attenuation on the incident angle is considered. However, the dependence of the incident angle of the energy attenuation at the time of collision in the field changes depending on the physical properties of the slope, and it is difficult to obtain the set value corresponding to the field every time of the analysis, and it also depends on the skill of the user. Therefore, in this chapter, we applied a technique that considers the dependence of incident velocity by the S F curve proposed by Shimauchi et al. described in Figure-20. Shimauchi et al. reported that good analysis results can be obtained in many sites by using an SF curve using 10 m/s for the correction speed. Therefore, in this study, the numerical damping characteristics of DDA are utilized to set the energy damping at the time of collision corresponding to this SF curve.

This analysis focuses on how different velocity-energy ratios affect rockfall behavior. The velocity-energy ratio is an important parameter indicating the relationship between kinetic energy and velocity of a rockfall, and if this is different, the trajectory and behavior of a rockfall may change significantly. Therefore, in this study, we focus on the velocity-energy ratio in particular. Analysis of rockfall behavior is one of the important issues in slope disaster prevention and civil engineering. Since different velocity-energy ratios affect the movement and collision behavior of rockfalls when rolling on slopes, clarifying the differences will contribute to the construction of more effective disaster prevention measures. In this analysis, we selected different geographical locations, Point 11 and Point 14. This allows a comparison of rockfall behavior under different geographical conditions. Specifically, points 12 and 14 each have different terrain conditions. For example, the gradient of the slope, the roughness of the ground surface, the presence or absence of vegetation, etc. are different.Affects the velocity-energy ratio of rockfall. We chose these points to confirm that the behavior of rockfall changes due to different terrain even with the same velocity-energy ratio. This allows a detailed analysis of how velocity-energy ratios affect different geographical conditions. The aim of this study is to elucidate how different velocity-energy ratios affect the trajectory of rockfalls. Specifically, the velocity change of rockfall, energy dissipation due to contact and collision with slopes, and differences in trajectories under different geographical conditions are analyzed. This makes it possible to derive optimal disaster prevention measures under specific terrain conditions. This analysis clarifies the influence of different velocity-energy ratios on rockfall behavior, making it possible to formulate more detailed slope disaster prevention measures. The selection of points 1 and 14 is an important step to compare the effects of velocity-energy ratios under different geographical conditions, and this comparative analysis will be important in future research.It is expected to provide necessary knowledge.
(1) 11 Point Analysis
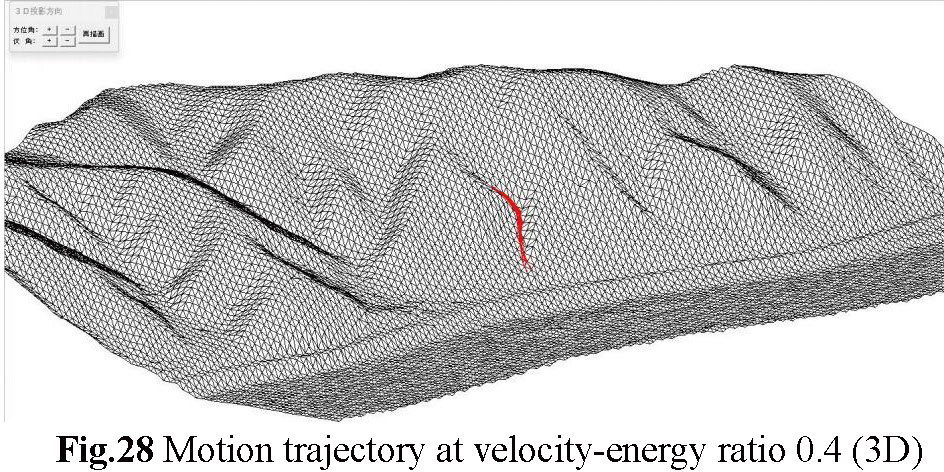
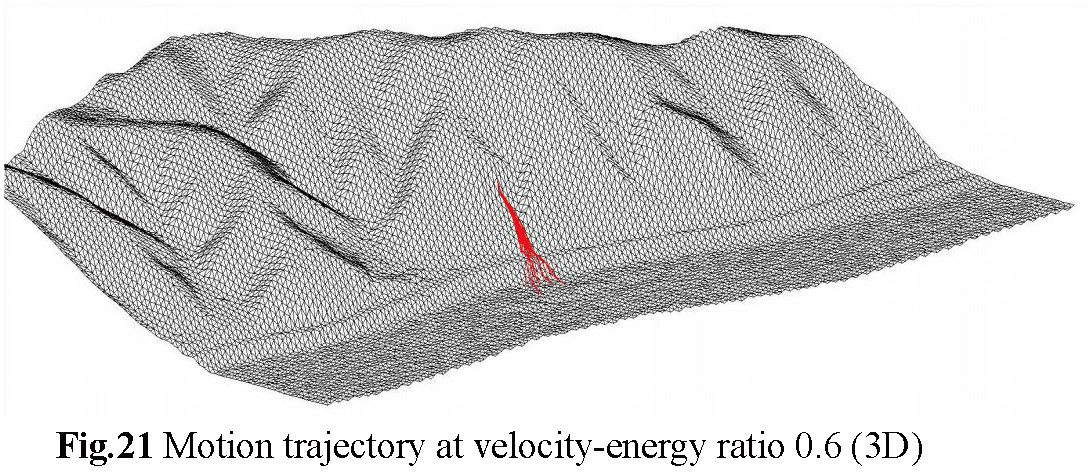
(a) Figure-21 to Figure-23 are 3D motion diagrams simulating that the rockfall at point 11 has velocity-energy ratios of 0.4, 0.5, and 0.6, respectively. It was found that when other conditions are the same, the larger the velocity-energy ratio, the longer the trajectory of the rockfall becomes. Point 11 is located on a gentle slope of the slope, so you can see that the trajectory of the rockfall is relatively gentle and there are no major ups and downs. The fact that most of the rockfall falls on the road means that if the rockfall at point 11 falls, it will have a relative destructive effect on the road.
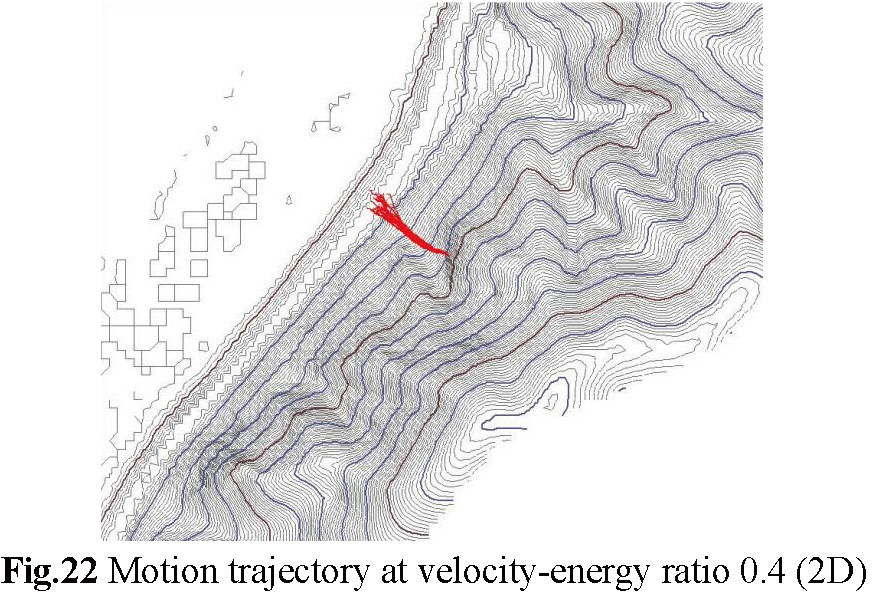

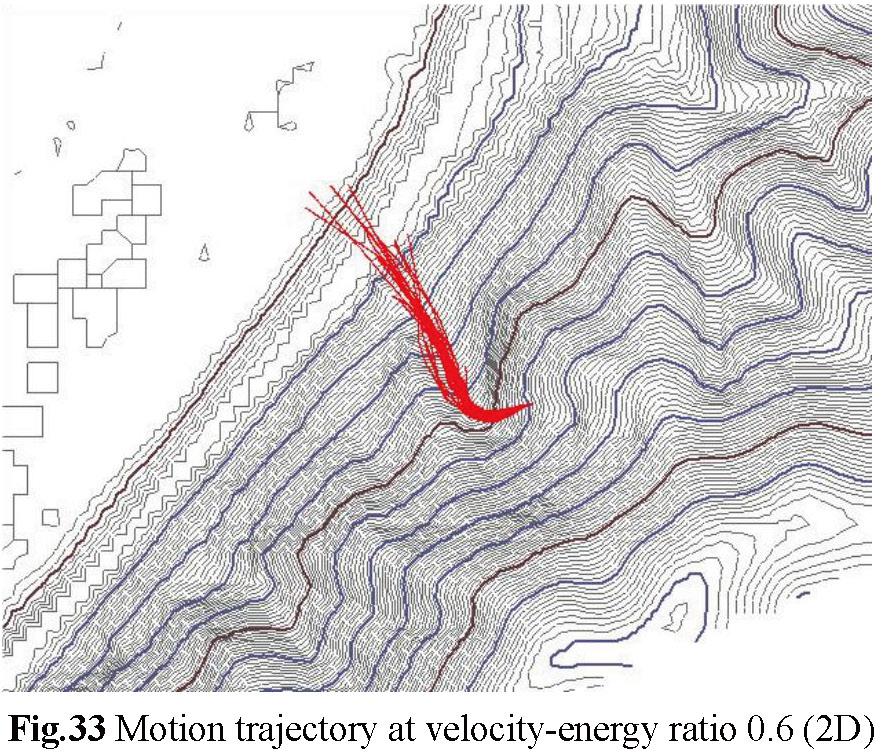
(b) Figures-24 to-26 have 2D plan view trajectories displayed by contour lines, and similarly, the larger the velocity-energy ratio, the faster the terminal velocity of the rockfall, and the trajectory tends to be messy, which means that the final falling point of the rockfall is difficult to predict. The smaller the velocity-energy ratio, the gentler the trajectory of the rockfall tends to be, which means that the falling point of the rockfall is easier to predict and appropriate protective measures can be well set.
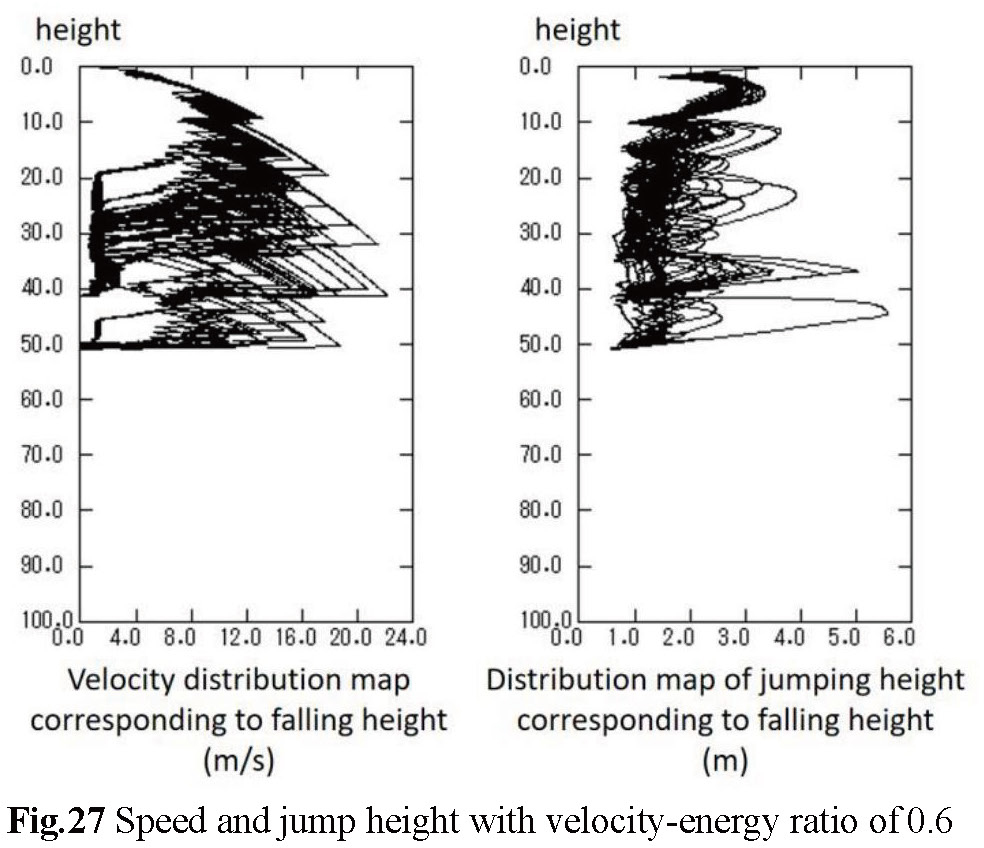
(c) Figures-27 to Figures-29 show the corresponding jump speed and height for a rockfall at point 14 at a corresponding fall height.During the experiment, we found that there were some experimental errors in the simulation results, specifically reflected in the abnormally high bounce height and velocity of some simulated stones, which can be clearly seen in the simulation diagram.
(2) Analysis of Point 14
(a) Figure-30 to Figure-32 are 3D motion diagrams simulating that the rockfall at point 14 has velocity-energy ratios of 0.4, 0.5, and 0.6, respectively. It was found that the larger the velocity-energy ratio, the longer the trajectory of the rockfall. This means that the speed at the end of the rockfall is fast, and its impact force is also correspondingly large. When the velocity-energy ratio is 0.4, the rockfall has not arrived on the road, but when the velocity-energy ratio is 0.5, some rockfall arrives on the road, and when the velocity-energy ratio is 0.6, it means that most rockfall trajectories exceed the road width, which means that the impact force is much larger than when the velocity-energy ratio is 0.4, which is very dangerous, which is also a challenge for road safety protection measures.At the end, it was shown that the bounce height of the stone significantly widened the gap. After analysis, it was found that the deviation in the data was the reason, and there is still room for improvement in this experiment


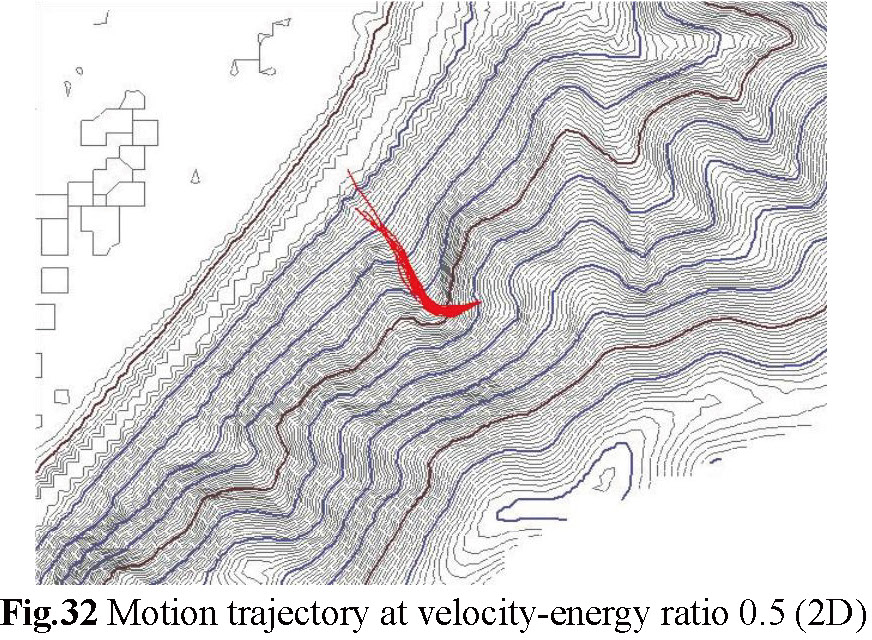
(b) Figures-33 to Figures-35 have a 2D plan view trajectory displayed by contour lines, and similarly, the larger the velocity-energy ratio, the faster the terminal velocity of the rockfall, and the trajectory tends to be messy, which means that the final falling point of the rockfall is difficult to predict. The smaller the velocity-energy ratio, the gentler the trajectory of the rockfall tends to be, which means that the falling point ofthe rockfall is easier to predict and appropriate protective measures can be well set.


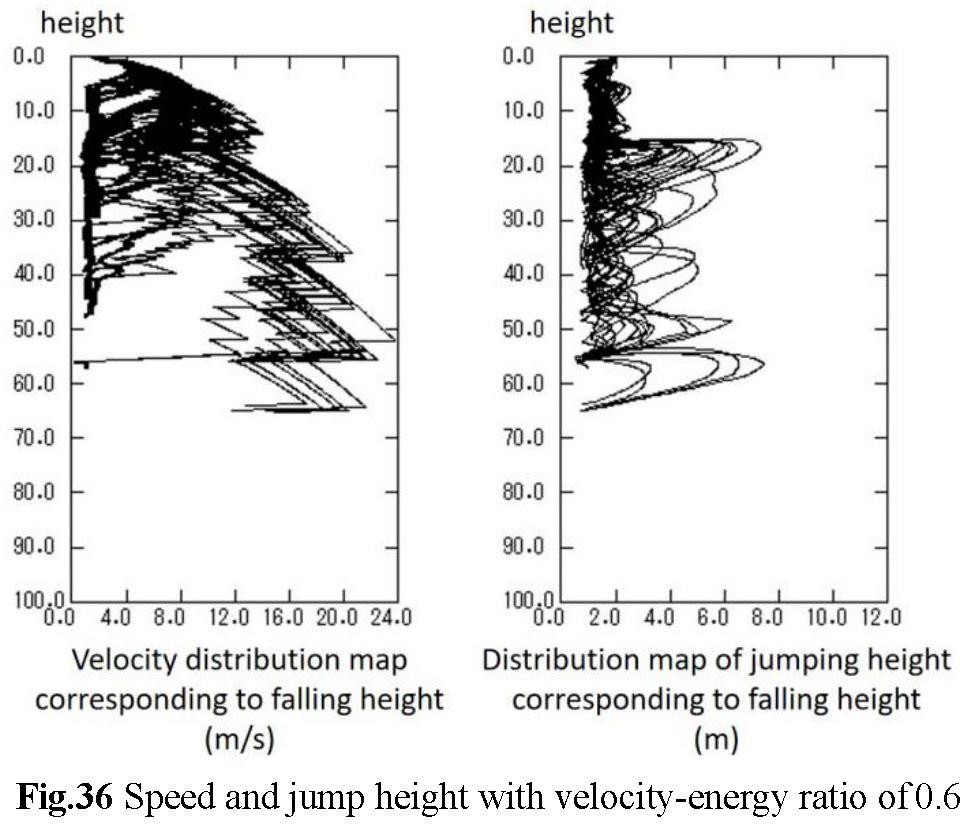
(c) Figures-36 to Figures-38 show the corresponding jump speed and height of the rockfall at point 14 at a corresponding fall height. The velocity change is the largest between 20 m-30 m and when the velocity-energy ratio is 0.6, the overall velocity change of the rockfall is the largest, and when the velocity-energy ratio is 0.4, the fluctuation of the velocity change is very small, the change in velocity is relatively obvious, and the maximum velocity of the rockfall is also increasing as the velocity-energy ratio increases. This means that rockfalls carry huge kinetic energy when they last fall, and it is necessary to consider whether the resistance of protective measures can stop rockfalls that are too fast.
5. EXAMINATION OF RESEARCH RESULTS
Comparing six sets of data obtained by two sets of experiments, it is revealed that the velocity-energy ratio has a significant effect on the trajectory of rockfall motion, jump height and velocity. In particular, the change was most pronounced at point 14, located on the slope of the mountain. Specifically, the larger the velocity-energy ratio, the more intense the trajectory of the rockfall, and the shorter the time to reach the peak velocity. In addition, the rolling distance also increased in the simulations in the same time. This means that the greater the velocity-energy ratio, the greater the kinetic energy of the falling rock. Point 11, on the other hand, is located on the concave side of the mountain slope, and its terrain is relatively gentle. For this reason, relatively few changes were observed with increasing velocity-energy ratio. In other words, at point 11, the kinetic energy of the falling rock is not large, and even if the velocity-energy ratio increases, the change in the kinetic energy of the falling rock is not very significant.Thus, it is shown that the effect of the velocity-energy ratio on the motion of a rockfall varies greatly depending on the characteristics of its terrain.
In the analysis of point 11, when the velocity-energy ratio is 0.5 and 0.6, the rockfall reaches the peak of jump height between 40 m-50 m and the corresponding velocity also peaks at this height, and in the analysis of point 14, the rockfall reaches the peak ofjump height and velocity at a fall height of 20 m-30 m, which shows that there is a large undulation in the data. This means that the rockfall at No.14 is more unpredictable and dangerous than that at No.11, so we can give priority to how to design safety measures, and as a result, the greater the velocity-energy ratio, the more and more dispersed the final trajectory of the stone, which means that the scope of protective measures also needs to be further expanded, and with the help of experimental results, the design of protective measures will be more effective.
References
- 1) Ministry of Land, Infrastructure, Transport and Tourism website/press release materials: The number of landslides in Reiwa 5 was 972, 2023.
- 2) Ministry of Land, Infrastructure, Transport and Tourism, Erosion Control Department, Landslide Disasters in Reiwa 2, pp.4, 2020.
- 3) IPCC Working Group I, summary for policymakers of the fifth assessment report, p. 4, 2013.
- 4) Japan Meteorological Agency HP: Changes to date in extreme phenomena such as heavy rain and extremely hot days, 2022.
- 5) Ito, M., Direction of disaster prevention inspection and road disaster prevention measures, Journal of the Society of Erosion Control, Volume 50, No. 2, pp. 36-41, 1997.
- 6) (Germany) Civil Engineering Research Institute: Joint research report on risk assessment ofroad slopes using GIS, Guidelines for creating road disaster prevention maps (draft), 2004. https://thesis.pwri.go.jp/files/Doken_Kyoudoukenkyu_0350_00.pdf.
- 7) Ministry of Land, Infrastructure, Transport and Tourism: Promotion of DX (Digital Transformation) at the Ministry of Land, Infrastructure, Transport and Tourism, 2021.
- 8) Ministry of Land, Infrastructure, Transport and Tourism: Guidelines for extracting road slope disaster risk locations using three-dimensional point cloud data (draft), pp.6, 2022.
- 9) Kitak Co., Ltd.: Rockfall countermeasures. https://www.jasdim.or.jp/gijutsu/gakekuzure_joho/taisaku/rakuseki/honbunl.html.
- 10) Beltex Corporation: Loop Fence Study Group. https://vertexgrp.co.jp/wp-content/uploads/Loopfence_Catalog_2009. pdf.
- 11) Kanda, M, Nishikawa, Y., Nakamaru, K.:Design method of rockfall countermeasures, Morikita Publishing, 2019.
- 12) Geotechnical Engineering Laboratory, Department of Social Infrastructure Engineering, Faculty of Engineering, Gifu University: Current status survey regarding rockfall investigation, design methods, and construction method selection for rockfall protection measures, 2020.
- 13) Onishi, Y., Sasaki, T., Shi, G, H.,:Discontinuous Rock Analysis Practical Application Study Group: Computational Mechanics Lecture Series 6 Discontinuous Deformation Method (DDA), Maruzen Co., Ltd., 2005.
- 14) Sasaki, K., Sasaki, T., Hagiwara, I., Yoshinaka, T.: Basic research on rockfall simulation using discontinuous deformation method, 2002.
- 15) Shimauchi, T.: Research on the applicability of numerical analysis methods to bedrock slope collapse and rockfall problems, Kyoto University Scientific Information Repository, 2008.
- 16) Koyama, T., Fukawa, T., Nishiyama, T., and Onishi, Y.: Research on numerical attenuation characteristics in discontinuous deformation method (DDA), Japanese Journal ofJSCE, Vol.66, No.2, pp.2999-311, 2011.
- 17) Public Interest Incorporated Association/Japan Road Association: Reference materials on rockfall countermeasures handbook-Research and research materials on rockfall simulation methods, 2002.
- 18) Ujo, T., Yoshida, H., Yano, M., Kyo, T., Yagi, M.: Considerations on the kinetic constant and jump amount of falling rocks falling on slopes, 1997.
- 19) Shimauchi, T., Onishi, Y., Nishiyama, T., Nakamaru, K., Sakai, N.: Rock fall simulation using discontinuous deformation method (DDA) focusing on basic properties of velocity ratio, 2009.
- 20) Nishimaru, T., Fukuda, T., Kiyama, T.: Numerical experiments on the influence of slope microtopography on rockfall trajectories, 2010.
- 21) Shimauchi, T., Zheng, W., Nakamaru, K., Sasaki, T., Nishiyama, T., Onishi, Y.: Research on analytical parameter determination method for rockfall analysis using DDA, 2011.
- 22) Ma, T., Matsuyama, H., Nishiyama, T., Onishi, Y.: Research on analysis methods for rockfall simulation, 2007.
- 23) Wyllie, D. C.: Calibration ofrock fall modeling parameters, 2014.
- 24) Chugoku Regional Development Bureau Road Information Provision System, Advance Traffic Regulation Section Information, 2023.