Estimation of Population Exposure to Flood Risk by Using a Geospatial Information System Overlay of Mobile Spatial Statistic (MSS) Data, Flood Inundation Map, and Land Use Zone
2025 年 6 巻 1 号 p. 17-24
詳細
2025 年 6 巻 1 号 p. 17-24
The devastating flood phenomena that hit several cities in Gifu Prefecture, Japan, from 1959 until 1976 remains a potential threat to the communities and properties living around the downstream part of the Nagara River basin. Realizing that the affected population is essential in disaster risk reduction, an accurate and targeted estimation of population exposure is needed to reduce the flood disaster risk. Therefore, this research proposed the use of advanced geospatial technologies, with the integration of MSS data and flood inundation maps, to analyze population exposure to flood risks across different times of day and estimate how many people are exposed to flood in each land use zone of Gifu City. The results by using time-based population exposure from MSS data indicate that population exposure varies with time, land-use zones, and demographic factors, with residential areas particularly at risk during midnight and commercial areas during midday. The study highlights the high exposure of middle-aged and elderly populations, emphasizing the need for targeted disaster mitigation strategies. This novel approach, replacing traditional census data with MSS data, provides a real-time insights on flood disaster which will be beneficial on flood risk management, urban planning, and policy evaluation, especially in regions lacking comprehensive statistical data.
Floods are considered one of the deadliest natural disasters worldwide and can cause severe damage to human life, the environment, and economic aspects1). In recent decades, many countries worldwide have experienced severe damage caused by floods2). As in Japan, several cities in Gifu Prefecture experienced severe flood disasters from 1959 until 1976, which caused severe damage to cities and areas in the downstream part of the Nagara River basin3). Even now, these flood phenomena remain as potential threats to human life and property for communities around the Nagara River basin. According to the disaster risk, the affected populations are an underlying factor for disaster loss and a key indicator for disaster risk reduction4). It is also stated that reducing the affected population and global disaster mortality are two of seven global targets by the UNDRR Sendai framework for disaster risk reduction 2015-20304). However, a study by Tellman et al. also mentioned that the number of people exposed to flood in 2030 will likely continue to increase more quickly than the overall population in 59 countries, and found mainly in Asia and Africa5). Therefore, accurate estimations of the affected population are needed to understand flood loss mechanisms and measure flood mitigation effects to minimize the risk of flood disaster6). Moreover, the affected population can vary significantly depending on the time of day, leading to differences in high-risk areas.
In response, emerging big data, such as Mobile Spatial Statistics (MSS), offers a new way to analyze and model human dynamics in space and time, which can be used to examine dynamic human behaviors, communications, and movements7). Thus, predicting and understanding human movements is critical for evaluating the population’s vulnerability, resilience and developing plans for disaster evacuation, response, and relief8). MSS is the population statistics generated continuously from mobile terminal network operational data9). With the wide use of mobile phones worldwide, this type of data can be accessible in every country all over the globe. MSS provides data by gender, age, and county (or municipal) residence under standard grids (e.g., 1 km and 500m grids) for hourly or longer time intervals10). In Japan, MSS has been used in many aspects, such as transportation, urban planning, disaster management, etc. Compared to traditional Census data, MSS data presents a substantial advantage when analyzing population exposure to flood disasters by offering dynamic, time-sensitive insights into population distribution and mobility patterns11). This ability served by MSS can make the population exposure estimation more diverse and targeted. In addition, with dynamic and time-sensitive insights into population distribution and mobility patterns served by MSS data it is allows for the identification of temporal and spatial variations in population exposure that cannot be captured by traditional statistic data such as census data12). For example, MSS data can show how population density changes significantly between residential, and commercial zones at different times of the day, providing crucial information for timely decision-making during disasters. Thus, with the granular data including municipal residence,age, and gender information, MSS data provides a more comprehensive understanding of the affected population, including not only local residents but also those who were in the affected area at the time of the disaster. This enables the development of more effective and targeted disaster mitigation and response strategies.
To conduct the estimation of population exposure to flood disasters several main approaches are mainly used by researchers, such as; 1) by using the spatial overlay of population distribution and inundation areas that have been widely used in risk assessment studies, 2) onsite survey and official statistics, 3) indirect estimation via analysis of asset damage, etc13). The spatial overlay method of population distribution and inundation areas strongly correlates with integrating the Geographical Information System (GIS) approach. Several researchers that use this approach found that flood hazard areas provide the most valuable information on flood risk14). As for the study by Sakai et al. in Saga City that used the spatial overlay method with the GIS approach, it is revealed that multiple urbanized areas with increased vulnerability to floods have emerged as a result of the application of land use restrictions that failed to evaluate flood hazard effectively15). It is also stated that flood risk information generated by the spatial overlay method might be used in the future to determine zones for directing residential area placement in optimal planning, review the delineation of such zones, and decide on development permits16). Moreover, another research employed the spatial overlay method, concluding that each flood hazard risk area should be assessed according to its level of urbanization and tolerance17). Previous studies that conducted Spatial Flood Risk analysis using census data mostly only took into account the night time population, which did not fully cover up the time-related impact of flooding. Therefore, by replacing the traditional Census data with MSS data as the input for population distribution, this research proposes the use of advanced geospatial technologies, specifically the integration of MSS data and flood inundation maps, to analyze population exposure to flood risks across different times of day, and estimates how many people are exposed to flood in each land use zone of Gifu City for targeted disaster mitigation planning and management. Finally, if this research method can estimate the population exposed to floods using mobile information data, it may apply to developing countries where other statistical data is unavailable.
This research uses the overlaying method of the MSS data and Flood Inundation Map (L1 and L2) to calculate the population exposure by the inundation level. Next, the result of population exposure is overlaid with the land use data to get the number of people exposed to flood in each area of the land use zone. Fig.1 shows the workflow of this research.

(1) Data Collection
Table 1 shows the data used in this research and its source.

a) Mobile Spatial Statistic (MSS) data
The MSS data in this research was obtained from NTT Docomo in 500 m mesh format and only selected the study location in Gifu City from 1st October to 31st December 2019. This data consists of the information of the population based on their age, gender, and residential status in hourly time intervals. This information is used to analyze flood exposure according to the residential status and age distribution with the time of exposure based on three scenarios such as midnight (00:00-03:00), midday (11:00-13:00), and evening (17:00-19:00).
As a brief comparison, this research calculated the population count from MSS data during the midnight and got the total population of about 390,389 people in 2019. According to the census data issued by the Gifu Prefecture, the population of Gifu City in 2020 was about 402,557 people18). The difference between these two data is about 12,000 people. This condition is understandable because the MSS data served the information of the population from the age of 15’s until 70’s where this age group is an average mobile phone user. Thus, this research will conduct population exposure analysis by excluding individuals under 15’s and over 70’s years old due to limitation of data availability.
b) Flood-Prone area
The flood-prone area used in this research was taken from the Flood Hazard Map issued by the Gifu Prefecture in 2019. This flood map was identical to the one published in the Gifu Mountain and River Hazard Map, which incorporates the flood-prone areas of small and medium-sized rivers as well as those designated by the Ministry of Land, Infrastructure, Transport and Tourism (MLIT), and the prefectural government. The flood inundation contained two levels: planned-scale rainfall (L1) with an annual probability of occurrence ranging from 1/100 to 1/10 (1-10 %) as shown in Fig.2 and estimated maximum-scale rainfall (L2) with an annual probability of occurrence ≦1/1000 (0.1 %) as shown in Fig.3.


c) Land Use Zone
The land use zone data is obtained from Gifu City and used data from 2019. The classification of land use zones has 12 categories that are designated by MLIT, which have a clear definition and regulation for each areas19). These 12 categories include; Commercial area, Industrial area, Neighborhood commercial area, Semi-industrial area, Semi-residential area, Type-1 low-rise residential area, Type-1 medium-to high-rise residential area, Type-1 Residential area, Type-2 low-rise residential area, Type-2 medium-to high rise residential area, Type-2 Residential area, and Urbanization control area. These land use zone data will be overlayed with the result of population exposure to determine how many people are exposed to flood according to the areas of land use zone.
(2) Estimation of Population Exposure
The population exposed to flooding was estimated using the following equation:

where,
EPij: Exposed population for inundation depth rank i (i = 1, … ,6) within a given mesh j, Pj: Population in mesh j, Aj : Area of mesh j excluding unin- habited areas, Aij : Area of inundation depth rank i.
The rank of flood inundation refers to one that included in the flood hazard map, which consist of sixth rank as shown in Table 2, above.

(1) Population Exposure to Flood
Understanding the exposure pattern at different times of the day can estimate when people are most vulnerable. It is assumed that most people are asleep at home during midnight, possibly unprepared and slower to respond to the emergency warning. Many people may stay at work, school, or outdoors during midday, and the emergency response will probably be faster. While people might be commuting or engaging in social activities during the evening, the emergency response might be quicker, but people may be relatively unfamiliar with the area. Fig. 4 shows the number of exposed populations with different people categories at each inundation depth level where the cateogires are General (the total of residence and non-resident), Residence, and Non- Residence. The highest population exposure was observed during midday, with approximately 274,780 and 303,978 individuals exposed out of 399,244 for the L1 and L2 flood scenarios, respectively. However, according to the residential status of Gifu City, residents have the highest exposure during midnight, which is around 211,997(L1) and 251,261(L2) individuals. For the non-residence, the highest exposure occurred during midday, with about 98,266(L1) and 114,289(L2). This result highlights the influence of time-specific activities on flood risk.

Additionally, this research also conducted the flood exposure estimations based on the age distribution as shown in Fig.5. According to the age distribution, this research found that the highest exposure in total occurred for middle-aged adults with an age range from 30’s-50’s, followed by elderly 60’s-70’s in the second place and young adult 15’s-20’s in the last. This means that according to the MSS data, middle-aged adults dominate the population in Gifu City, and this generation will be more at risk during flooding. The exposure rate (see Fig. 2-3) is indicated by two criteria in this research: an inundation depth of 0.5 m or more and 3 m or more20). These two criteria are interpreted as an inundation depth of 0.5 m, a risk of flooding above the floor of a general house, and a flood depth of 3 m, equivalent to the second floor of a general house21). From the result, it is clearly understood that for an exposure rate over 0.5 m or more, young and middle- aged adults might still be able to do the evacuation. Still, for older people, it has already become challenging due to health and mobility issues22), and for an exposure rate over 3 m, the evacuation already become impossible for all age categories. This condition puts the elderly, despite exposure lower than middle-aged adults, at a potentially high risk of flood disaster. Moreover, according to the exposure time, this research found that young adults get high exposure during midday, middle-aged adults during the evening, and the elderly during midday. This result indicates a high probability of people spending daytime activities in high-risk areas.

(2) Population Exposure within Land Use Zone
This paper also identifies the population exposure according to the land use zone to understand where the exposure occurred. Flood hazard map that issued by the government as shown in Fig. 2-3 above, shows only the inundation level of the flooding area, while with the overlaying method of population exposure and land use zone in this research it can identified where is the area with high population in a high risk of flood. The result shows that among the 12 criteria of the land use zone, the high exposure was found during midnight mainly in the residential area for Gifu City residents, such as in the area of Type-1 residential area circled by red in the Fig.6.a (Kagashima town) , Type-2 residential area circled by blue (Sakuragi Cho, Aoyagi cho, and Hirakawa cho), Type-2 medium to high rise residential area circled by yellow (Masakikita and Sagiyama), etc. The average flood depth in this area reaches about 3- 4 m (Fig.6.b). However, for the non-residents, high exposure occurred during midday and evening in workplace activities and high commuter areas. Primarily found in the semi-industrial area around Kamikawate and Nishikawate (circled by purple in the Fig.7.a), Type-1 residential area around Kagashima town (circled by red in the Fig.7.a), in the commercial area around Gifu Station, etc. (circled by green in the Fig.7.a), and the average inundation in these area around 4-5 m (Fig.7.b). Based on the above result, it can be said that there are still high number of people living and doing activities in the high-risk areas. Thus, the residential area during midnight might face some challenges if the flood of L1 or L2 occurs since people tend to be unaware of the emergency. Even though the emergency response might be faster during midday and evening, it might also become challenging, especially for non-residents and areas influenced by high commuters.


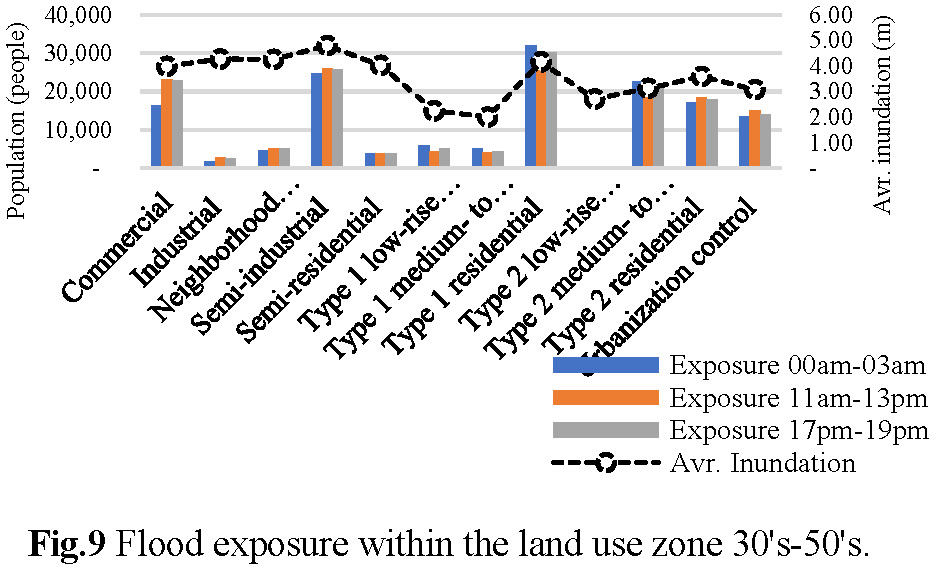
For the age distribution, the peak exposure for young adults mainly occurred during daytime hours in the areas of semi-industrial areas, commercial areas, urbanization control areas, Type-2 residential areas, etc. while during midnight only in residential areas such as Type-1 residential, Type-1 low rise residential and Type-1 medium-to high rise residential area (see Fig.8). Middle-aged adult have high exposure during daytime hours in workplace activities areas and during midnight only in residential areas, a bit similar with the young adult but with higher number of exposure (Fig.9). Finally, for elderly peak exposure found almost all time in residential areas such as type-1 residential, type-2 medium to high-rise residential, type-2 residential area and during midday in commercial area (Fig.10).


Understanding the different patterns of population exposure to flood disaster will provide a critical insight on how time related activity, residential status, and age distribution affect the potential risk of flood disasters within the area. Unlike Census data, which mostly represent only the nighttime population distribution and cannot represent the dynamic change of population22) , The result from this study proved that the use of MSS data is beneficial on fullfiling the gap of census data in analyzing temporal factor of population exposure to flood risk. The findings highlight the significant temporal variations in population exposure to flood risk, underscoring the necessity for time-sensitive disaster response strategies. For instance, the higher exposure of residential populations during midnight highlights the importance of a strong early warning system, as individuals are likely to be asleep and less responsive. On the other hand, the increased exposure at midday in commercial and semi- industrial areas points to the necessity for workplace- specific evacuation plans and awareness programs. However, responding to the limitiation of the data acquisition from MSS data that is only cover the population from age 15’s-70’s, this research slightly compared the result of midnight population of MSS data with Census data on 2015. The results on Table 3. Shows that by using the same calculation method, both MSS data and Cencus data have a strong correlation value even though MSS data lack of younger (<15’s) and older (>70’s) population. Which can considerably be used for the estimation of population exposure in this study. Also, It is important to point out that the population from MSS data (15’s-70’s), are the population who have the possibility to be able to evacuate since these people have access to the information from their cellphone. Thus, the young adult generation especially those within age 20’s-40’s can be a helper for the below 15’s and over 70’s population (that is not included in the MSS data) during evacuation. Therefore, by knowing the exposure risk on each age groups from MSS data can be beneficial to address the vulnerability of the unavailable population data for below 15’s and over 70’s.

According to demographic analysis, This study showed that middle-aged have the highest exposure rates, most likely due to their predominance in residential and workplace areas. It aligns with socioeconomic trends as most working people in this age group commute daily to urban centers. On the other hand, the vulnerability of elderly populations, particularly in residential areas, raises concerns regarding their mobility and access to emergency resources. That necessitates targeted interventions, such as regional shelters and transportation assistance tailored for older adults.
When analyzing land-use zones, the study reveals that while non-residential zones exhibit variable exposure based on temporal factors, residential areas are consistently at risk, regardless of the time of day. According to this, it is suggested that urban planners should consider revising zoning laws to discourage high-density developments in flood-prone residential areas. Commercial zones with high exposure occurring during midday must also implement flood- resilient infrastructure and adaptive urban design practices.
This research concluded that using Mobile Spatial Statistics data can analyze population exposure to flood disasters, which is helpful for targeted disaster mitigation planning and management. The flood risk analysis in this research focuses on the affected population approach, which complements the current flood hazard map that only serves information on the inundation level. This research can provide diverse information about what, where, and how many people are at risk of flooding according to the current Flood hazard map issued by the government.
Based on the results, this research found that a large number of people will be affected by flooding, indicating that the development of urban areas is still concentrated in high-risk areas. Residential areas were also found to be more at risk despite the exposure time, which can be the target area for applying mitigation strategies such as enhancing early warning systems and preparedness training. Also, targeted evacuation plans for commercial zones and commuter-heavy areas should be prioritized during midday. Furthermore, the study demonstrates the vulnerability of elderly populations, calling for age-specific interventions such as accessible shelters and mobility support during emergencies.
Finally, while MSS data offers dynamic insights of population exposure, the limitations of this research exist, which is the exclusion of population under 15’s and over 70’s due to unavailable information in the MSS. Despite these challenges, this research methodology can present a valuable tool for developed and developing nations alike, bridging limitations in traditional census-based flood risk assessments. Additionally, the different exposure patterns utilized by this method can be considered when evaluating and strengthening the existing land use and flood disaster regulations.
As for further study, we will conduct a more specific vulnerability analysis that combines other information, such as evaluation of shelter accessibility and capacity. This holistic approach can strengthen disaster management frameworks and guide urban planners in creating resilient cities.
The authors would like to thank all the people and organizations who contributed to the making of this research, especially the Professors at Gifu University who gave valuable insight and suggestions towards this research.