Proposal of a deep learning-based automatic segmentation method for raster diagrams of existing bridges
2025 年 6 巻 1 号 p. 8-16
詳細
2025 年 6 巻 1 号 p. 8-16
In recent years, there has been an increasing demand for efficient and quantitative analysis models in the maintenance and management of existing bridges. For bridges where design diagrams are only available in raster formats, high-precision automatic segmentation techniques are essential for generating finite element method (FEM) models. This study proposes a method for automatically segmenting and recognizing components in raster diagrams, focusing on side, plan, and cross-sectional views of existing bridges. Using supervised learning with the DeepLabv3+ deep learning model, structural elements were extracted from simplified diagrams, and segmentation accuracy was further enhanced using a region-based refinement algorithm. Experimental results demonstrated an average segmentation accuracy of 97.0% with DeepLabv3+ and 97.9% after applying the refinement algorithm, confirming the effectiveness of the approach. The findings of this study are expected to contribute to the three-dimensional modeling and efficient management of existing bridges.
In recent years, with the growing popularity of concepts such as smart cities and digital twins, efforts to create three-dimensional models of urban systems have accelerated worldwide. While Virtual Singapore1) is internationally renowned, Japan has also developed several notable initiatives, including PLATEAU2), Tokyo Digital Twin3), Arakawa 3D River Management Map4), and VIRTUAL SHIZUOKA5). These projects demonstrate the diverse applications of three-dimensional modeling in disaster management, infrastructure maintenance, transportation planning, and integration with environmental studies and autonomous driving technologies. As these initiatives progress smoothly, it is anticipated that various scenarios can be extensively simulated in virtual spaces, enabling urban planning and policy development while minimizing the impact on actual society.
Meanwhile, focusing on infrastructure in Japan, there are approximately 730,000 bridges nationwide, and it is projected that about 59% of these structures will be over 50 years old by 20326). While the aging of infrastructure, particularly bridges, is expected to become increasingly evident, several challenges have emerged simultaneously: the declining trend in construction investment, decreasing numbers of construction industry workers leading to labor shortages, and the growing burden of inspection work. Although current Japanese regulations mandate regular bridge inspections every five years according to the Road Bridge Periodic Inspection Guidelines, maintaining this inspection cycle may become increasingly difficult in the future. Against this backdrop, the importance of asset management based on quantitative performance evaluation has become increasingly significant as a strategy to enhance the efficiency and sophistication of bridge maintenance management.
For quantitative bridge evaluation, structured data organization using BIM (Building Information Modeling)7) and simulation through FEM (Finite Element Method) analysis models8) are powerful tools. While some newly constructed bridges have three-dimensional CAD data and BIM models available, most existing bridges lack digitized design data. Particularly for bridges built more than a decade ago, even 2D CAD data is often unavailable, and when documentation exists, it is typically in PDF or raster (image) format. These raster drawings contain only pixel information, and the technology to automatically recognize which pixels correspond to specific structural components such as piers, main girders, and deck slabs remains undeveloped, creating a barrier to three-dimensional conversion.
While research on shape reconstruction from non-drawing sources, such as SfM (Structure from Motion), NeRF (Neural Radiance Fields), and 3DGS (3D Gaussian Splatting), has progressed rapidly in recent years9),10), accurately reproducing structural attributes (such as joint details and cross-sectional dimensions) for infrastructure like bridges remains challenging. Furthermore, while building analytical models that include structural characteristics requires comprehensive utilization of existing drawings, design standards, and inspection reports, automation is complicated by the diverse types and formats of data involved. The current stage demands the accumulation of fundamental technologies toward automation.
In particular, technology that efficiently digitizes the vast number of existing raster bridge drawings and connects them to three-dimensional or FEM analysis models is expected to play a crucial role in future infrastructure management. Moreover, if such technology extends beyond bridges to other road facilities, buildings, and river structures, it has the potential to dramatically transform infrastructure maintenance methodologies not only in Japan but worldwide for aging infrastructure.
Therefore, this research ultimately aims to establish a generalized methodology for semi-automatic generation of three-dimensional analysis models (FEM) from raster drawings of existing bridges, with its initial phase focusing on “automatic segmentation of raster drawings.” The long-term vision encompasses estimating component shapes and dimensions from drawings, complementing missing information based on design standards, and ultimately generating integrated models that can be seamlessly exported to FEM software. However, this paper does not delve into these subsequent processes but rather presents approaches and preliminary results on achieving high-precision segmentation of raster drawings.
The comprehensive process of bridge three-dimensionalization can be divided into three essential stages:
a) Automatic Segmentation of Raster Drawings
This stage involves automatic recognition of bridge components (main girders, deck slabs, bearings, piers, etc.), dimension lines, and annotations from elevation, plan, and cross-sectional views of existing bridges. Traditionally, raster drawings contain only pixel information, making semantic segmentation of “images” without metadata challenging. This research employs state-of-the-art image recognition technologies, including deep learning, to improve automatic segmentation accuracy.
• This paper primarily focuses on model development and evaluation for this stage, including specific algorithm design and experimental assessment.
• Segmentation accuracy is considered a crucial foundational technology as it directly influences the automation level of subsequent shape/dimension estimation and model generation.
• Given the high level of complexity of this subject and the frequent loss of original design drawings, this study does not focus on rasterized versions of design drawings. Instead, it targets simplified diagrams commonly recorded in inspection reports in Japan.
b) Shape/Dimension Estimation and Information Complementation (Future Work)
This stage involves estimating three-dimensional shapes and dimensions based on automatically extracted elements from raster drawings. Typically, drawings alone lack detailed information about component thickness and joint details, necessitating appropriate integration of design standards, field measurement data, and bridge engineering expertise. This stage also includes OCR of dimensional information. While the authors have already undertaken some work in this area11), it is beyond the scope of this paper.
• This paper does not address detailed implementation or evaluation of this process.
• Instead, it conceptually organizes potential methods for complementing missing information by referencing current technological trends and related research in the bridge field.
• The ideal future goal is to establish a system that can integrate segmentation results with design standards and inspection records for three-dimensional model reflection.
c) Integration into FEM Models (Future Work)
This final stage involves generating models for detailed bridge analysis by seamlessly outputting estimated shape and dimensional information to general-purpose FEM analysis software and BIM environments. This requires data optimization according to practical operational requirements, including settings for component connections, boundary conditions, and load conditions.
• This paper positions this process as a future developmental challenge without actual implementation.
• Achieving consistent FEM model generation for numerous existing bridges requires accurate segmentation and shape estimation, making the enhancement of these preliminary technologies an urgent priority.
While the ultimate goal of this research is to achieve an end-to-end implementation of processes (a) through (c), this paper specifically addresses process (a): ‘automatic segmentation of raster drawings.’ Specifically, it focuses on automating element classification using deep learning methods for raster images containing mixed bridge elevation, cross-sectional, and plan views, examining accuracy and application scope. This represents both the initial entry point for future large-scale bridge three-dimensionalization and analysis model generation, and a significant technical challenge in achieving versatility and high precision.
Therefore, this paper’s contributions lie in (1) demonstrating the utility of segmentation technology in the bridge field and (2) clarifying challenges and solutions in handling large volumes of existing raster drawings. This is expected to establish a foundation for automatic generation of three-dimensional and analytical models applicable not only to bridges but also to various infrastructure and architectural fields in the future. The establishment of such foundational technology holds significant potential for dramatically incorporating existing national infrastructure stock into three-dimensional digital twins, accelerating large-scale simulation and efficient maintenance planning. In this context, the ‘automatic segmentation of raster drawings’ addressed in this research is positioned as a key technology for revolutionizing future infrastructure management.
Since drawing images are raster data, directly extracting drawing positions and bridge shapes is extremely challenging. However, bridges share structural commonalities, such as girder arrangements and cross-sectional shapes, resulting in specific patterns in their drawings. Therefore, we define structural classifications as segmentation classes and employ supervised learning using machine learning models.
The segmentation process consists of three steps: (1) creation of training images, (2) execution of segmentation using machine learning models, and (3) accuracy improvement through region segmentation. The specific methodologies are detailed below.
(1) Creation of Training Images
This process begins by pre-defining segmentation for elevation views, plan views, and cross-sectional views. Training and test data were generated by extracting simplified drawing images from the National Road Facility Inspection Database managed by Japan’s Ministry of Land, Infrastructure, Transport and Tourism12). The training data images are standardized to 640px × 256px, with drawings positioned at the center of the image.
Before defining segmentation for each view type, we establish the following fundamental rules:
• Segmentation targets are limited to single-span bridges with uniform cross-sections.
• Auxiliary elements not affecting structural form (e.g., drainage pipes, guardrails) are excluded from segmentation.
• Drawing images with significant omissions in bridge shape are excluded
The segmentation definitions for each view type are as follows:
a) Side view
Segmentation is defined in four patterns as shown in Fig. 1. Structural classifications include piers/abutments and deck slabs, with regions distinguished by color hue. In RGB format [R,G,B], piers/abutments are defined as [0,255,255] (hereafter cyan) and deck slabs as [0,0,255] (hereafter blue).

• Top-left in Fig. 1: Complete representation of piers/abutments with deck supported by two piers/abutments.
• Top-right: Drawing with partially visible abutments.
• Bottom-left: Rigid frame bridge (converted entirely to blue due to absence of piers/abutments)
• Bottom-right: Culvert bridge (converted entirely to cyan where no distinction exists between main girder and deck).
b) Plan view
Segmentation is defined in three patterns as shown in Fig. 2. Structural classifications include bridge surface and under-girder surface, converted to [255,0,0] (hereafter red) and [0,255,0] (hereafter green) respectively.

• For drawings lacking lateral bracing or cross beams in the under-girder surface, the entire under-girder area is converted to red to reduce learning complexity.
• Drawings with bridge surface and under-girder surface divided into more than three parts are excluded.
• c) Cross-sectional View
Segmentation is defined according to bridge structural types. Structural classifications include deck slabs [255,255,0] (hereafter yellow) and girders [255,0,255] (hereafter purple). Bearings, piers, and abutments shown in cross-sectional views are not included in segmentation.
Fig. 3 shows segmentation for plate girder bridges with cross beams/lateral bracing, H-shape steel bridges, steel box girder bridges, hollow-core slab bridges using factory-produced post-tensioned members, pretensioned hollow-core slab bridges, and T-girder bridges with cross beams. These drawings define both deck and girder segments.
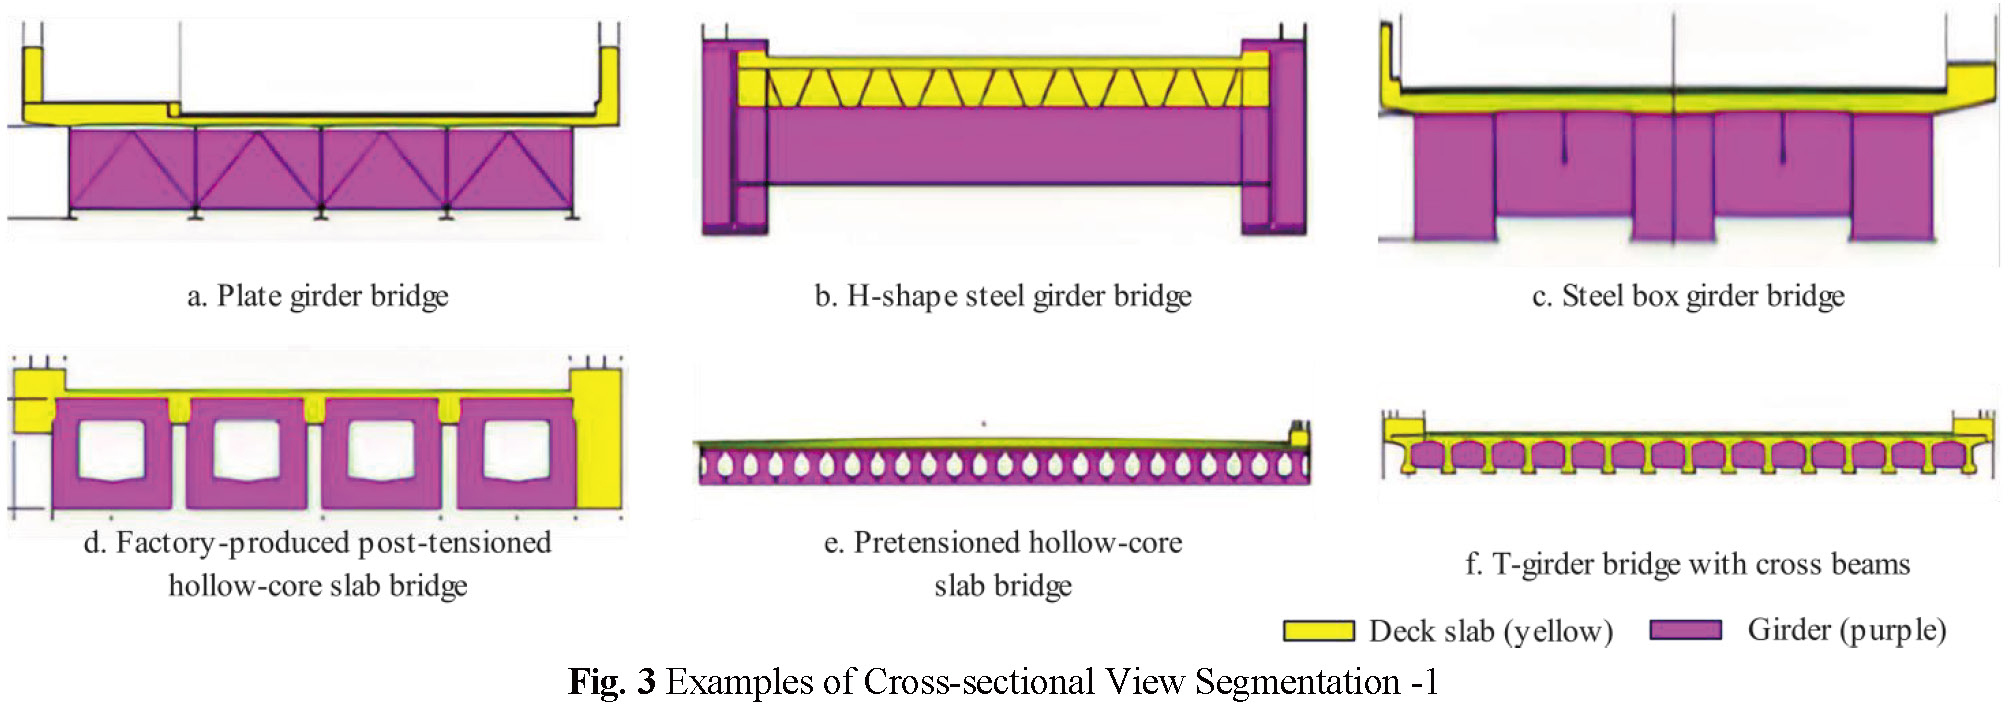
Fig. 4 shows segmentation for concrete box girder bridges, solid slab bridges, cast-in-place post-tensioned hollow-core slab bridges, T-girder bridges, rigid frame bridges, box culvert bridges, and plate girder bridges without cross beams. As shown, only deck segments are defined, primarily because the girders and decks are integrated (except for plate girder bridges, where girder regions are omitted for consistency).

While this definition framework covers most drawings, some cases fall outside these definitions. For such cases, segmentation is defined maintaining consistency with other drawings by preserving deck and girder distinctions and spatial relationships, as exemplified in Fig. 5. Drawings where deck regions are illegible due to poor image quality are excluded.

(2) Implementation of Segmentation Using Machine Learning Models
The segmentation process employs supervised learning using paired labeled images and their corresponding original images. DeepLabv3+13) was selected as the machine learning model for this task. The model utilizes ResNet-50 without pre-training as the backbone network, and Cross Entropy Loss was adopted as the loss function.
Fig. 6 demonstrates representative segmentation results for cross-sectional views using DeepLabv3+. As evident from Fig. 6, the segmentation accuracy varies considerably across different images. Note that in the scope of the data analyzed in this study, the presence of numerical values within the drawings did not fundamentally have any adverse effects. The segmentation results for the first and second rows show high accuracy with successful classification. However, the third, fourth, and fifth rows, while achieving reasonable coarse segmentation, exhibit inadequate performance in detailed regions, indicating the need for further accuracy improvement. This issue will be addressed in the following section (3).

(3) Accuracy Improvement Using Region Segmentation
To enhance the accuracy of the DeepLabv3+ segmentation output discussed in the previous section, we propose the following methodology:
First, the input image (simplified drawing) is binarized using Otsu’s method14), followed by region segmentation based on black pixels (Fig. 7). Subsequently, we focus on the segmented regions. For each region, we aggregate the segmentation results of all pixels within it and fill the entire region with the most frequent label (majority class).

As illustrated in Fig. 8, where the left image shows the segmented regions and the right image displays the segmentation results for individual pixels within these regions, the region under consideration is filled with the light gray label since it represents the majority class within that region.

The region segmentation algorithm can be expressed in pseudo-code as shown in Algorithm 1.
By applying this majority voting approach to all segmented regions, we aim to improve the overall segmentation accuracy.

Fig. 9 presents a comparative analysis of four images: the input drawing, ground truth labels, segmentation results from DeepLabv3+, and the accuracy-enhanced results using region segmentation. Additionally, we present quantitative analyses of 450 simplified cross-sectional images, comparing the accuracy of DeepLabv3+ segmentation results with those enhanced by region segmentation, as shown in tables 1, 2 and Fig. 10 and 11.


From the first set of images in Fig. 9, it is evident that when DeepLabv3+ achieves successful fine-grained segmentation, the application of region segmentation does not degrade the results. Furthermore, in the second, third, and fourth sets of images, the implementation of the region segmentation algorithm demonstrably improved the detailed segmentation accuracy.
However, the fifth set of images in Fig. 9 shows a decrease in accuracy after applying region segmentation. This degradation occurs when the black lines in the input drawing are either too thin or discontinuous, preventing proper separation between the deck slab region and the background. Such cases can be addressed by applying closing operations, a binary image processing technique.
Moreover, as demonstrated in the sixth set of images in Fig. 9, when the initial DeepLabv3+ segmentation accuracy is relatively low, the application of region segmentation does not yield dramatic improvements.
Moving to the quantitative analysis, tables 1 shows that the mean accuracy of DeepLabv3+ was 97.0%, while the region segmentation-enhanced approach achieved 97.9%. tables 2 and Fig. 10 reveal a notable difference in frequency distribution, particularly in the 99.5-100% accuracy range. This indicates that the region segmentation method effectively pushes the segmentation accuracy closer to 100%.
Furthermore, the proposed method combining region segmentation outperformed DeepLabv3+ across all metrics: Recall, Precision, and F1-Score. table 2 presents the frequency distribution of F1-scores, while Fig. 11 displays the F1-Score histogram. Similar to the accuracy metrics, these results demonstrate a significant difference in frequency distribution within the 99.5-100% range.
This study proposes a three-stage methodology for automatically generating FEM models from rasterized simplified drawings: (1) drawing segmentation, (2) geometry extraction, and (3) FEM model generation through data integration. The present paper specifically focuses on stage (1), the drawing segmentation process.
In the segmentation phase, we first created annotated training images from simplified drawings, then performed segmentation using DeepLabv3+, followed by implementing a region segmentation algorithm to further enhance accuracy. While the segmentation was successful for the majority of drawings, the process occasionally failed in cases where the line thickness in the original drawings was insufficient or when the initial DeepLabv3+ segmentation accuracy was suboptimal. To further improve segmentation accuracy in future work, potential strategies include expanding the training dataset and developing specialized models for different bridge types.
The next phases toward automated FEM model generation will require dimensional information acquisition through OCR, geometry and dimensional estimation with missing information compensation, and integration into FEM models. Based on the segmentation results obtained in this study, bridge geometry must be estimated and combined with bridge specification data. Furthermore, we are currently investigating potential integration with our developing damage detection models15),16),17),18) and point cloud analysis models19),20).
This work was partially supported by the Council for Science, Technology and Innovation (CSTI), Cross-Ministerial Strategic Innovation Promotion Program (SIP), the 3rd period of SIP “Smart Infrastructure Management System” Grant Number JPJ012187 (Funding agency: Public Works Research Institute) and JSPS Grant-in-Aid for Scientific Research Grant Numbers 21H01417, 22H01561, and 23H00198