Anomaly Detection Using Multiple Data-based iForest for Realizing Digital Twin in Winter Road
2025 Volume 6 Issue 1 Pages 91-102
Details
2025 Volume 6 Issue 1 Pages 91-102
Winter road environments pose significant challenges to transportation safety and maintenance due to adverse weather conditions. This study proposes an anomaly detection model that leverages multiple databased Isolation Forest(iForest) to assess road conditions. This study integrates the data from an on-board edge system with precipitation data from XRAIN. The features related to winter road were selected, and labels were constructed for training iForest, a tree-based unsupervised learning method. This study proposes training the model only on readily obtainable and verifiable normal data and evaluates whether its performance can approximate that of supervised models requiring perfectly labeled datasets. Experiment results demonstrate the proposed model’s effectiveness in detecting anomalies under winter road conditions. Compared with other unsupervised learning techniques, the iForest model achieved the highest performance. Although supervised learning models output higher performance, their reliance on perfectly labeled data, which is difficult to acquire, limits their practicality in this context. In contrast, the results of our model are relatively closer to best performance, so we adopted it.
The findings highlight the practical significance of the proposed method for road monitoring and maintenance, providing a robust, low-cost solution for anomaly detection in complex winter road environments. This research not only enhances decision-making for traffic safety and resource allocation but also contributes to advancing the development of digital twin systems for intelligent transportation management.
(1) Background
In Hokkaido, severe weather events pose significant challenges to winter transportation, creating a highly dynamic and unpredictable environment for road users and operators. Intense snowfall and strong winds frequently lead to substantial reductions in visibility, making driving hazardous and increasing the likelihood of accidents. In addition to these immediate risks, fluctuating weather patterns can also result in rapid and unpredictable changes on road surfaces, such as the formation of ice, slush, or wet road surfaces. These challenging conditions often lead to multiple vehicle collisions, prolonged road closures, and significant economic losses due to delays in transportation and the interruption of logistical operations.
To mitigate these challenges, road maintenance operations such as snow removal, visibility inspections, and road surface condition monitoring are essential. These operations play a crucial role in ensuring smooth traffic flow and maintaining public safety. However, they are currently performed largely through manual labor, often under demanding circumstances, including nighttime hours and harsh weather conditions. What makes the difficulty even more complex is the increasing shortage of skilled road maintenance operators, which further exacerbates the pressure on the winter road management system. Therefore, there is an urgent need to develop and deploy advanced technologies, such as AI-driven digital twin for road inspection system, to enhance the efficiency of road inspections, optimize maintenance operations, and reduce the reliance on human labor.
In recent years, researchers have made notable progress in these tasks. These include innovations in road visibility estimation1)2), which provide drivers and road managers with real-time information about visibility conditions, and road surface recognition models3)4)5), which identify and classify road surface states to inform maintenance and safety measures. Despite these advances, a critical gap remains in the integration of varies information. The lack of a comprehensive evaluation limits the ability of road managers to assess the overall road environment and prioritize resources effectively. Addressing this gap is essential for the successful deployment of digital twin for road inspection systems capable of transforming winter road management in cold regions like Hokkaido.
(2) Research objectives
The primary objective of this study is to use onboard edge system data and Japan’s eXtended RAdar Information Network (XRAIN) data to detect anomalies in winter road environments. Due to the difficulty in obtaining large and accurately labeled abnormal data in practical scenarios, we propose an unsupervised model trained only on normal data. By comparing the performance with supervised models, verify whether unsupervised methods are still feasible in scenarios where data annotation is lacking.
The reason for integrating these two types of data is that the on-board edge system can provide vehicle driving status, information such as velocity, road images which directly reflects road conditions. XRAIN data provide information related to snowfall, which has important reference value for winter road environment. By integrating these data, the state of roads can be more comprehensively characterized, providing features for anomaly detection.
In real-world scenarios, obtaining sufficient and accurately labeled “abnormal” data is extremely difficult. Therefore, we want to adopt an unsupervised learning method of “training only with normal data” to achieve anomaly detection. In order to verify the practicality of the proposed unsupervised model, compare it with supervised models by manually creating a relatively accurate labeled dataset. If unsupervised models can achieve similar performance to supervised models in the absence of large-scale labeled abnormal data, it proves their feasibility and effectiveness.
(1) Data collection
a) On-board edge system
Data collection and computation in this study were carried out through the on-board edge system shown in Fig.1.

The system is composed of two sub-systems. The first one is the image, visibility estimation and road surface condition recognition sub-system which is to store driving video images took by the on-board video camera and to compute the visibility and road surface condition based on a stored image. The second one is the data transmission sub-system which transmits recorded video images, Global Navigation Satellite System (GNSS) data and computed values to the server in real-time6). It was applied to road inspections to evaluate visibility and road surface conditions between cities in Hokkaido, Japan throughout the previous winter seasons.
b) XRAIN data
A method for understanding snowfall conditions in real-time and on an area-wide basis is the use of precipitation intensity (mm/h) observed by the XRAIN developed by the Ministry of Land, Infrastructure, Transport and Tourism (MLIT). XRAIN has resolution of different meter mesh and observation intervals of every minute, which enables high-frequency and detailed observation of precipitation intensity.
XRAIN has the potential to provide reginal and real-time information on snowfall conditions on the ground. The applicability of XRAIN precipitation intensity as snowfall information has been verified by many researchers7)8).
We downloaded the “MLIT XRAIN CXMP composite dataset” from Japan’s Data Integration and Analysis System, which provides precipitation intensity per minute for every 250 meters square of mesh. In this study, precipitation intensity was calculated based on XRAIN data from a 1-kilometer mesh, which was calculated from the average of 250 meters mesh. Additionally, for hourly comparisons, we computed the average precipitation intensity for each 1-kilometer mesh from minute 00 to 59 of each hour.
c) Accuracy and limitations of data sources
The on-board edge system accurately captures road environment data, such as vehicle velocity and high-frequency road surface images. By leveraging edge computing, it minimizes transmission latency and enhances real-time processing. However, data quality may be affected by vehicle conditions and driver behavior, which are not independently accounted for. Additionally, equipment malfunctions, especially in low-temperature environments like Hokkaido, could impact data reliability. Furthermore, road surface conditions and values representing visibility are derived from the system’s built-in algorithms, whose accuracy cannot be guaranteed with absolute certainty.
Regarding XRAIN data, while studies indicate a strong correlation between precipitation intensity and actual snowfall, making it effective for assessment, it primarily monitors high-resolution, real-time precipitation intensity rather than directly measuring road conditions such as snow accumulation or ice formation. Discrepancies between aerial observations and ground conditions introduce a temporal lag, which this study mitigates by using precipitation data with a 10-minute delay. Moreover, the study employs 1-kilometer grid- averaged precipitation data instead of a finer 250- meter mesh, potentially reducing the accuracy of localized precipitation variations.
(3) Data integration
a) Integration method
In this study, the data integration method is based on the XRAIN mesh shown in Fig.2. As described in the previous subsection, the hourly precipitation intensities were calculated through a mesh of 1- kilometer. The coordinates of the mesh vertices can be calculated according to the instructions of XRAIN website, and the road related data collected by the on-board edge system containing latitude and longitude information can be used to determine whether the data points exist within a certain mesh. If the position information belongs to the corresponding mesh, the road related data of on- board edge system and precipitation data can be combined, resulting in the creation of the original dataset used for the following research.

b) Feature selection
The integrated data is shown in Table 1, the features Velocity, WIPS, Road surface, and Precipitation were selected based on the following considerations:

Velocity: Vehicle velocity is a critical factor in assessing road safety. In winter conditions, abnormal velocity variations may indicate hazardous road conditions such as slipperiness, snow accumulation, or ice formation. Therefore, it serves as a key indicator for anomaly detection.
WIPS: The Weighted Intensity of the Power Spectrum (WIPS) emerges as a particularly valuable metric for assessing visibility under adverse weather conditions9). Visibility directly affects driving safety. Reduced visibility due to heavy snowfall or fog can increase driver reaction time and increase accident risks. Thus, this feature is essential for analyzing winter road environments.
Road surface: This feature provides a direct description of road conditions, such as dry, wet, snowy, or icy surfaces. It serves as an important measure of driving safety and aids in identifying potential hazards.
Precipitation: The XRAIN data reflect the precipitation intensity, which is closely related to road surface conditions and visibility. Variations in precipitation levels can lead to reduced visibility, road icing, or increased snow accumulation, thereby affecting driving safety.
The selection of these features integrates vehicle dynamics, environmental visibility, road conditions, and meteorological factors, providing essential support for anomaly detection and analysis in winter road environments.
c) Data preprocessing
To ensure data quality and reliability, preprocessing was conducted to handle missing values and extreme outliers. For missing values, a mean imputation method was applied, where each missing entry was replaced by the average of its preceding and succeeding values. This approach preserves temporal continuity and minimizes information loss. Additionally, outliers were identified based on statistical thresholds and domain-specific considerations. In cases where extreme values were likely to result from sensor malfunctions or recording errors, they were removed to prevent distortion in model training and analysis. These preprocessing steps improved data consistency and enhanced the robustness of the anomaly detection model.
(3) Label creation
In the process of creating labels in this study, we simplified the definition of anomalies as extreme and rare occurrences of ultra-low visibility caused by snow blowing accompanied by ultra-low velocities on icy and snowy roads. For providing a reliable dataset for model training and evaluation of road environment features, we used the following standards to ensure the accuracy and quality of the labels:
Initial assignment: We initially applied a densitybased clustering method to classify the data, designating clustered points as normal and labeling outliers as anomalies. Following this process, all labels were manually reviewed and refined to ensure accuracy and consistency by comprehensively considering the road images and numerical values, example images of the normal and abnormal in this process are shown in Fig.3. This combined approach accelerated the labeling process while incorporating expert judgment for improved reliability in the dataset.
Quality control measures: We implemented strict quality control procedures10), including crossverification of the results by multiple team members and resolution of discrepancies through discussion and consensus.

(1) Background layers of digital twin
The layers of the digital twin for the road inspection system, designed to monitor and assess visibility and road surface conditions, particularly during winter, can be described in the following steps, as shown in Fig.4.

Physical layer: The digital twin uses the on-board edge system described in Fig.1 as part of the physical layer.
Data layer: The integration data coming from GNSS data, road images, and XRAIN data, is stored in the road environment database. This database acts as a repository for all relevant environmental and road condition data.
Logic layer: The logic layer currently consists of two models: a visibility estimation model and a road surface recognition model. Both models are computed on the microcomputer in the physical layer. This study aims to develop a new anomaly detection model for the logic layer, which leverages the outputs of the current models and the collected data. This anomaly detection model will be implemented on the cloud server side.
Display layer: Display layer is the interface to use the digital twin. The processed data and results are transmitted and visualized to the road management office or other relevant end, such as computers or mobile devices, providing actionable insights.
(2) Models’ explanation of logic layer
a) Visibility estimation model
In this model, WIPS is the metric for assessing poor visibility within road images. The calculation of WIPS involves the following steps9)11):
Image cropping: A two-dimensional image of 256×256 pixels is cropped from the original image.
Grayscale conversion: The gray-scale intensity of the cropped image is computed from the red-green-blue components.
Fourier transformation: The cropped image is decomposed into sinusoidal gratings of various spatial frequencies using a two-dimensional Fast Fourier Transform. The power spectrum value corresponds to the amplitude of each spatial frequency12).
Contrast sensitivity function: The inverse of the threshold contrast of the sinusoidal grating is used to define the contrast sensitivity function, based on spatial frequencies relevant to human visual perception13).
WIPS calculation: WIPS is calculated as the summary of the power spectrum intensity within the spatial frequency range of 1.5 to 18 cycles per degree. High WIPS values indicate clear visibility, while low WIPS values correspond to poor visibility conditions.
b) Road surface recognition model
This model determines the road surface type based on probabilities computed by the MobileNet model14). After the data collection for this study, some advancements have been made in road surface recognition models15), significantly improving its accuracy.
For this study, there are six road surface types including dry, wet, semi-wet, slush, fresh-snow and ice, all road surface classifications in the dataset were manually corrected to ensure accuracy. Additionally, cross-validation was performed to verify the reliability and precision of the results. The example images are shown in Fig.5.

(3) Proposed anomaly detection model
a) Model selection
For the model selection in this study, we analyzed several commonly used unsupervised learning models from the perspective of future development trends, including Isolation Forest (iForest)16), One-Class SVM (OCSVM) 17) as well as Variational Autoencoder (VAE) 18).
iForest stands out for its lightweight nature, making it ideal for real-time applications like road monitoring and edge computing. While its random partitioning may limit the detection of complex anomalies, improvements in tree structure can enhance adaptability to intricate data patterns.
In contrast, OCSVM suffers from sensitivity to hyperparameters, particularly kernel selection, limiting its scalability in large, high-dimensional settings. OCSVM may lose competitiveness in complex datasets and may be replaced by more advanced neural network-based methods over time. VAE has prospects for AI-based anomaly detection but faces challenges like reliance on reconstruction error, which may hinder its effectiveness in detecting certain anomalies. While VAE is a strong research direction, its real-world applicability remains constrained by resource requirements.
Based on these analysis, we propose a multisource data-based iForest model, trained exclusively on normal data to learn its distribution. During testing, any significant deviation from this distribution is identified as an anomaly. This approach is particularly effective when abnormal data is rare or when anomalies lack clear definitions. Fig.6 shows an overview of our proposed method.

Our method consists of three procedures, the first procedure is data processing, followed by a training phase and a testing phase.
b) Data processing
In this procedure, we integrate multiple data and normalize it. Data integration was introduced in section 2(2), so this subsection introduces data normalization. The values of selected road features vary in scale, impacting the accuracy of data analysis. To ensure all features are on a consistent scale as much as possible, this study normalized them before training phase. First, normalize WIPS and velocity using z-score normalization. As shown in Equation (1), where µ is the mean of the feature. σ is the standard deviation of the feature.

Velocity limits vary between urban roads, suburban roads, and expressways, making it challenging for a once-time normalization to accurately reflect these differences. Road surface conditions, such as ice, or snow surfaces, also have a significant impact on velocity. Therefore, this study divided velocity based on road type and road surface in the normalization process. In other words, the mean µ and standard deviation σ in Equation (1) are calculated separately from categories of different road types and road surfaces. This approach helps to improve the precision of the analysis.
While precipitation values are distributed unilaterally, with no negative values characteristic. Therefore, precipitation is suitable for min-max normalization, since the minimum value is 0, the formula is simplified to Equation (2).

c) Training phase
The proposed method consists of a simple but efficient anomaly detection method, iForest. As shown in Fig.7, iForest is a tree-based unsupervised machine learning model specifically designed for anomaly detection tasks.

Core idea of iForest is to isolate anomalies from normal points by randomly partitioning the data. Anomalies, being in sparse regions of the feature space, are easier to isolate and therefore require fewer partitions. The algorithm follows these steps:
Random sampling: Randomly sample subsets of the original data.
Construct isolation trees: For each subset, build an isolation tree (iTree). During the construction, a random feature and a random split point are chosen to partition the dataset until each data point is isolated, or the maximum tree depth is reached.
Compute average path length: In an iTree, the number of edges traversed by a data point x from the root node to its leaf node is h(x). For a given dataset X with n samples, the average path length of the iTree c(n) can be approximated using the following empirical Equation:

where H(i) represents the harmonic number, which can be approximated as:

γ is the Euler-Mascheroni constant, approximately equal to 0.5772156649.
Calculate anomaly scores: The equation for calculating the anomaly score of data point x is:

E(h(x)) is the average path length of data point x in multiple iTrees. The range of anomaly scores s(x,n) is between [0,1], with scores closer to 1 indicating that the data point is more likely to be an abnormal point.
d) Test phase
The trained model can calculate the anomaly scores to test data samples. Since this model is trained with only normal data, if a given sample belongs normal, the anomaly score becomes low. If the given sample is abnormal, the anomaly score becomes high. By defining a specific threshold value ξ, we can classify the test data. Specifically, we determine the classification as follows:

(1) Experiment setup
a) Experiment data
The study period was selected from late January to February 8th, 2022, containing 15 days. And the drive route is Rumoi to Wakkanai. The total data samples are 24360, 1563 samples were identified as abnormal during label creation, while the rest were normal samples.
In order to establish experimental datasets, a training dataset containing data for 11000 samples, and a test dataset containing data for 2000 samples were constructed from all processed data, as shown in Fig.8. The training dataset had 10000 data samples with normal labels, and the test dataset had 1500 normal and 500 abnormal data samples.

b) Evaluation metrics
We evaluated the performance of proposed model using the criteria defined by Equations (7) to (9), where TP represents true positives, TN represents true negatives, FN denotes false negatives, FP denotes false positives.


We also incorporated ROC curves and AUC values as the model evaluation metrics. The ROC curve, illustrating the classification capability across different thresholds. While the AUC represents the area beneath the ROC curve and quantifies the overall performance.
c) Experiment parameter
The threshold ξ for iForest is determined by maximizing the F1-score to effectively discriminate between normal and abnormal samples, as illustrated in Fig.9 (a). Based on the training dataset, the optimal threshold is identified as ξ = 0.335. The impact of different ξ on precision and recall are shown in Fig.9 (b) and Fig.9 (c). A lower threshold increases the sensitivity of the model, leading to higher recall but potentially introducing more false positives, which reduces precision. Conversely, a higher threshold improves precision by reducing false positives but may miss some true anomalies, thereby lowering recall.

d) Comparison methods
For comparison, three comparative methods were used. They are VAE, OCSVM, and Deep-iForest which is the combination of VAE and iForest. These models both belong to the domain of unsupervised learning and can be utilized for anomaly detection by training exclusively on single class samples.
In this study, we also expanded our experiments to include supervised learning models for comparison. Our main motivation for adding these models was to confirm the best performance for machine learningbased anomaly detection. If our proposed unsupervised model can perform nearly to the supervised models, it proves its feasibility. SVM, Logistic Regression, LightGBM19), Fourier convolutional neural networks (FCNN)20) were selected to train and test using the same dataset as the unsupervised models as listed in Fig.8, with the addition of anomaly samples in the training set.
(2) Results
a) Results of unsupervised models
The performances shown in Table 2 demonstrate that the model trained only on normal data can effectively perform anomaly detection for winter road environments. According to Recall, Precision and F1-score, iForest outperformed other models including the deep learning-based models. It achieved the highest AUC value as well. According to Fig.10(a), the ROC curve of iForest is closest to the top-left corner which indicates that, in the field of unsupervised learning, simple machine learning models are effective enough for this case, there is no need for complex models such as deep learning or neural network models.


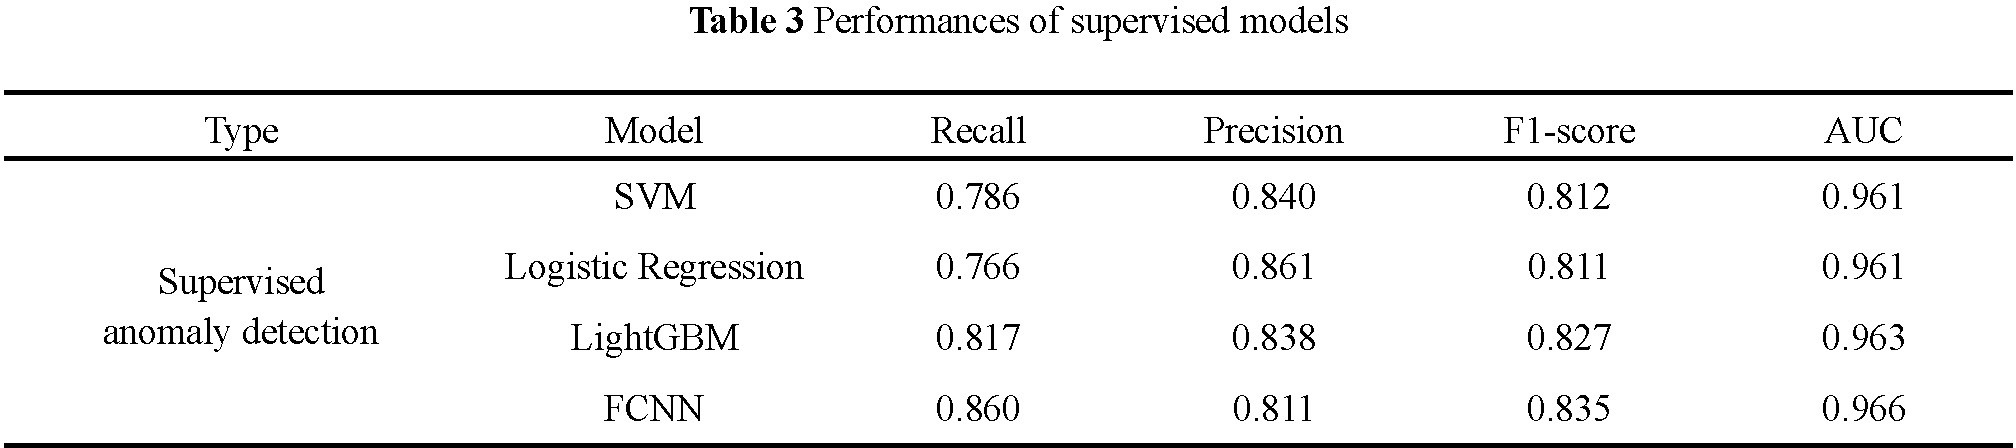
b) Results of supervised models
The results of supervised models are presented in Fig.10(b) and Table 3. They both achieved higher evaluation results compared to the unsupervised models, with similar performance across them. However, during the experimental process, we found that as the proportion of training anomalies decreases, the performance of these models decrease. This is because supervised models need a perfect dataset with accurate label, if we can get accurate label for each data, we can choose the supervised model. However, that is not a high possibility for realization, collecting and labeling sufficient and representative anomaly samples in winter road environments faces significant challenges.
In contrast, unsupervised models don’t rely on anomaly labels, have lower training costs, and presents greater robustness to changes in data, making them more suitable for limited labeled data.
Additionally, the proposed method also achieved relatively high results, confirming its feasibility for anomaly detection. So we propose an unsupervised model for now. Improving the results to make them closer to supervised models is our future work.
c) Other results
To further analyze the impact of various factors such as snow and ice on detection accuracy, this study evaluated the detection accuracy based on road surface conditions, with the results presented in Fig.11. The histogram, sorted from top to bottom in a descending order, illustrates the performance differences across various road surface conditions.

The results show that the model’s performance is best on dry surfaces and degrades as road conditions become more challenging, such as in wet, slush, ice, and snow conditions. Highlighting the importance of considering road surface when developing anomaly detection systems, particularly in winter scenarios. Further improvements may be necessary to enhance its robustness under these challenging conditions.
Finally, we present the correctly and incorrectly classified samples in Fig.12. As shown in the confusion matrix, true positive and true negative samples correspond to cases where the model accurately identified anomalies and normal road conditions. The true positive samples typically involved severe weather conditions, such as heavy snowfall or icy roads, which significantly affected driving safety. Similarly, true negative cases corresponded to normal, dry road conditions with no hazardous factors.

Although our method demonstrated high classification performance, some misclassifications occurred. Most false positive cases involved wet road surfaces after light rain, where the system overestimated the risk. Additionally, some of the false negative samples included scenarios with subtle anomalies, such as thin layers of ice or partially melted snow, which were challenging to distinguish from normal wet surfaces. These findings highlight the need for further refinement of the model to improve its ability to differentiate between true anomalies and visually similar but normal road environments.
Overall, our method achieved better performance than that of other anomaly detection methods, particularly in unsupervised models. The effectiveness of our method was confirmed by the test dataset.
The experimental results demonstrated the effectiveness of the proposed method in detecting road anomalies. We compared unsupervised learning models, including VAE, OCSVM, Deep-iForest, and iForest. The iForest model achieved the highest performance, proving the feasibility of simple machine learning models in anomaly detection for numerical data, like our case, without requiring complex deep learning or neural network architectures. This highlights the advantage of iForest in scenarios where computational efficiency and interpretability are prioritized.
Furthermore, supervised learning models such as SVM, Logistic Regression, LightGBM, and FCNN were included for comparison. While these models outperformed unsupervised methods due to their ability to leverage labeled anomaly data, their reliance on sufficient and representative labeled samples poses challenges in real-world scenarios, particularly in winter road environments where labeling is costly and time-consuming. This limitation underscores the practical relevance of unsupervised methods like iForest in such contexts. Our study has several limitations. First, this study only used meshes of XRAIN with a length and width of 1-kilometer each. If more refined 250-meter meshes are used, an improvement in accuracy for precipitation can be foreseen. Additionally, more weather information, such as wind speed, fog, and temperature, needs to be considered. Parameters of the road surface, such as humidity, moisture content, and snow density, are also expected to be incorporated in future studies. While this study focuses on anomaly detection based on numerical data using basic machine learning models, future research could explore more advanced models to mine features directly from road images or combine them with additional numerical features. This could lead to a more accurate and comprehensive road environment anomaly detection system.
To enhance the real-world applicability of our proposed anomaly detection model, we outline a workflow for its integration into a road management system. The system operates as follows:
Data collection: On-board edge system and XRAIN continuously collect road environment data, including velocity, WIPS, road surface conditions, and precipitation.
Preprocessing: The collected data undergoes cleaning, missing value imputation, and normalization to ensure consistency.
Anomaly detection: The trained model processes the numerical data in real-time to detect potential anomalies.
Alert visualization: When anomalies are detected, the results are displayed on a real-time monitoring interface in the terminal layer as Fig.13. The system visually distinguishes anomalies and normal conditions using different color markers. This enables road authorities and drivers to intuitively assess hazardous areas and take necessary actions.

System update and optimization: The model is periodically retrained with new data to enhance its accuracy and adaptability.
This implementation workflow ensures that the proposed method can be effectively deployed in intelligent transportation systems, providing real- time anomaly detection to improve winter road safety and optimize road maintenance operations.
In conclusion, this study demonstrates the effectiveness of unsupervised learning methods, particularly iForest, in detecting anomalies in winter road environments. By leveraging data from an on- board edge system and XRAIN precipitation data, the proposed method offers a practical and scalable solution for real-world road monitoring. Future works will focus on refining the model with higher- resolution data, incorporating additional environmental parameters, and exploring advanced techniques to further improve detection accuracy and robustness.
The findings of this research emphasize the practical significance of the proposed framework in supporting road monitoring and maintenance. The ability to detect anomalies contributes to enhancing traffic safety, optimizing resource allocation, and reducing road accidents. The integration of the anomaly detection model into the digital twin system lays a foundation for AI-driven intelligent transportation management, paving the way for more efficient and reliable road maintenance operations in challenging winter conditions.
We would like to express our gratitude to Wang Yuxin for her invaluable contributions to cross-verification of data processing. This work was partly supported by JST SPRING, Japan Grant Number JPMJSP2119. And this work was also partly supported by the Committee on Advanced Road Technology under the authority of the Ministry of Land, Infrastructure, Transport, and Tourism in Japan (Project name “Technological development of digital twin-oriented transportation management system in winter road”, Principal Investigator: Assoc. Prof. Sho Takahashi, Hokkaido University). And this work was partly supported by JSPS KAKENHI Grant Numbers JP23K22877.