ORIGINAL ARTICLE
Relationship between Transparent Skin Tissue Image Shading and Skin Tissue Light Scattering Intensity
2020 Volume 40 Issue 4 Pages 314-319

Details
2020 Volume 40 Issue 4 Pages 314-319
To obtain a fingerprint pattern without being affected by protrusions and indentations on the skin surface is important for fingerprint identification. In our previous work, we discovered a fine structure corresponding to the fingerprint pattern in the stratum corneum and surrounding area from observation of OCT images, and developed a method which detects the light from the light source goes through a fine structure and create grayscale images corresponding to a fingerprint pattern. In this paper, to clarify the origins of the greyscale image, we propose a simple simulated model of the fine structure of different light scattering properties alternately arranged in the epidermis of finger skin. We calculated the light intensity distribution via a Monte Carlo simulation of light scattering with two parameter sets at 640 nm. We found that the light passing through this model created a greyscale image that corresponded to the epidermis structure.
指紋センサにとって,皮膚表面の影響を受けない指紋パターン検出は大変重要である.筆者らはOCT画像の観察から角層付近に指紋パターンと一致した微細構造があることを発見し,指を透過させた光で指紋のグレイスケール画像を検出するセンサを開発した.本論文ではこの画像の由来を明らかにするために,表皮に異なる光散乱係数を持つ切片が交互に配置された微細構造のシミュレーションモデルを提案した.λ = 640 nmにおける2セットの光散乱パラメーターでモンテカルロシミュレーションを行ったところ,表皮の構造に一致したグレイスケール画像が生成されることがわかった.
Fingerprints have been proven to be unique to each individual—the probability of matching fingerprint pattern being 1 in 680 billion or lesser—and to remain unchanged throughout a person’s lifetime1,2). Fingerprint personal identification is widely used, having diverse applications from immigration control to smart phone security. However, the majority of fingerprint scanning methods, including optical, capacitive, and thermal methods3), are contact type sensors. These sensors detect that fingerprint ridges are in contact with the sensors surface and the valleys are not. Thus, they are easily affected by wrinkles and liquid on the finger. A sensing method robust to the skin surface condition is, therefore, required, and several methods for detecting fingerprints from within the finger have previously been developed4,5).
In particular, a method has been produced by the present authors6,7), which works to detect the internal skin components beneath the fingerprint. In our previous work, we discovered a fine structure corresponding to the fingerprint pattern in the stratum corneum and surrounding area, from observation of various finger-skin optical coherence tomography (OCT) images. This structure exhibited weak and strong light scattering at the sites corresponding to the fingerprint protrusions, i.e., ridges, and indentations, i.e., valleys, respectively7). Our sensor consists of a LED, lens, and imaging device. Light from the light source travels through the finger—and the fingerprint—to reach the imaging device. Then, a greyscale image is produced. We utilized the light scattering from this structure to read fingerprints using red light, which has the ability to penetrate living tissue. The details of this structure and our sensor are described in Section 2.
Through the course of that work, we found that the light scattering pattern generated by these fine structures coincides with the fingerprint pattern; however, the nature of the greyscale image produced by the light passing through the structures was not elucidated. To clarify the origins of the greyscale image, in the present report, we create a simple model of the fine structure found in the epidermis, and conduct a simulation to visualize the transmitted light intensity distribution.
The fine structure is shown in the finger-skin cross-sectional OCT image in Fig.1(a)7). The red characters, lines, and circles were added by the author. This image was obtained from a wrinkled finger. The background color is black while the scattering point is drawn with white dots. The stronger scattering point is shown as the pixel with a higher level of brightness. The left side indicated by the black arrow pointing left is air while the right side indicated by the black arrow pointing right is skin tissue. The white arrayed dots indicated by the arrow pointing downward is the finger surface. The red line shows a length of 500 μm. The author considered that the tissues covered by the long and short red arrows are the epidermis and stratum corneum, respectively. The protrusions indicated by white arrows are the fingerprint ridges. The indentation surrounded by the gray dotted circle is a wrinkle. The area drawn with white dots (red dotted circle) in the stratum corneum is the strong scattering area that appeared corresponding to the fingerprint ridge. The dark area in the stratum corneum (red circle) is the weak scattering area that appeared corresponding to the fingerprint valley. This structure is the fine structure that we discovered, as mentioned above. The fine structure appeared even in the wrinkled area. Furthermore, there are strong scattering areas are deeper than stratum corneum. This structure is carved along surface protrusions and indentations. However, there are not structures with a strong scattering area and weak scattering area, this structure is a continuous area. Therefore, the author considers that this is not a fine structure. Our sensor structure is illustrated in Fig.1(b)8) with the sensor output image shown in Fig.1(c)8). The light source is the LED that illuminated the nail side of the finger. The lens is placed between the finger and the imaging device. The imaging device is placed below the lens. The irradiated light from the light source penetrates the finger, is focused by the lens, and detected on the imaging device. When the light passes through the strong scattering area in the fine structure in the stratum corneum corresponding to the fingerprint ridge, the light is highly scattered and less light passes through the finger to reach the imaging device. However, when the light passes through the weak scattering area in the fine structure in the stratum corneum corresponding to the fingerprint valley, the light is hardly scattered and a large amount of light passes through and reaches the imaging device. Hence, the fingerprint ridge is imaged brightly while the valley is dark in the output image in Fig.1(c). Using the developed sensor6,7), the light from the source passes through various finger structures; therefore, it was important to maintain the characteristics of the internal structure when creating the model employed in this study.
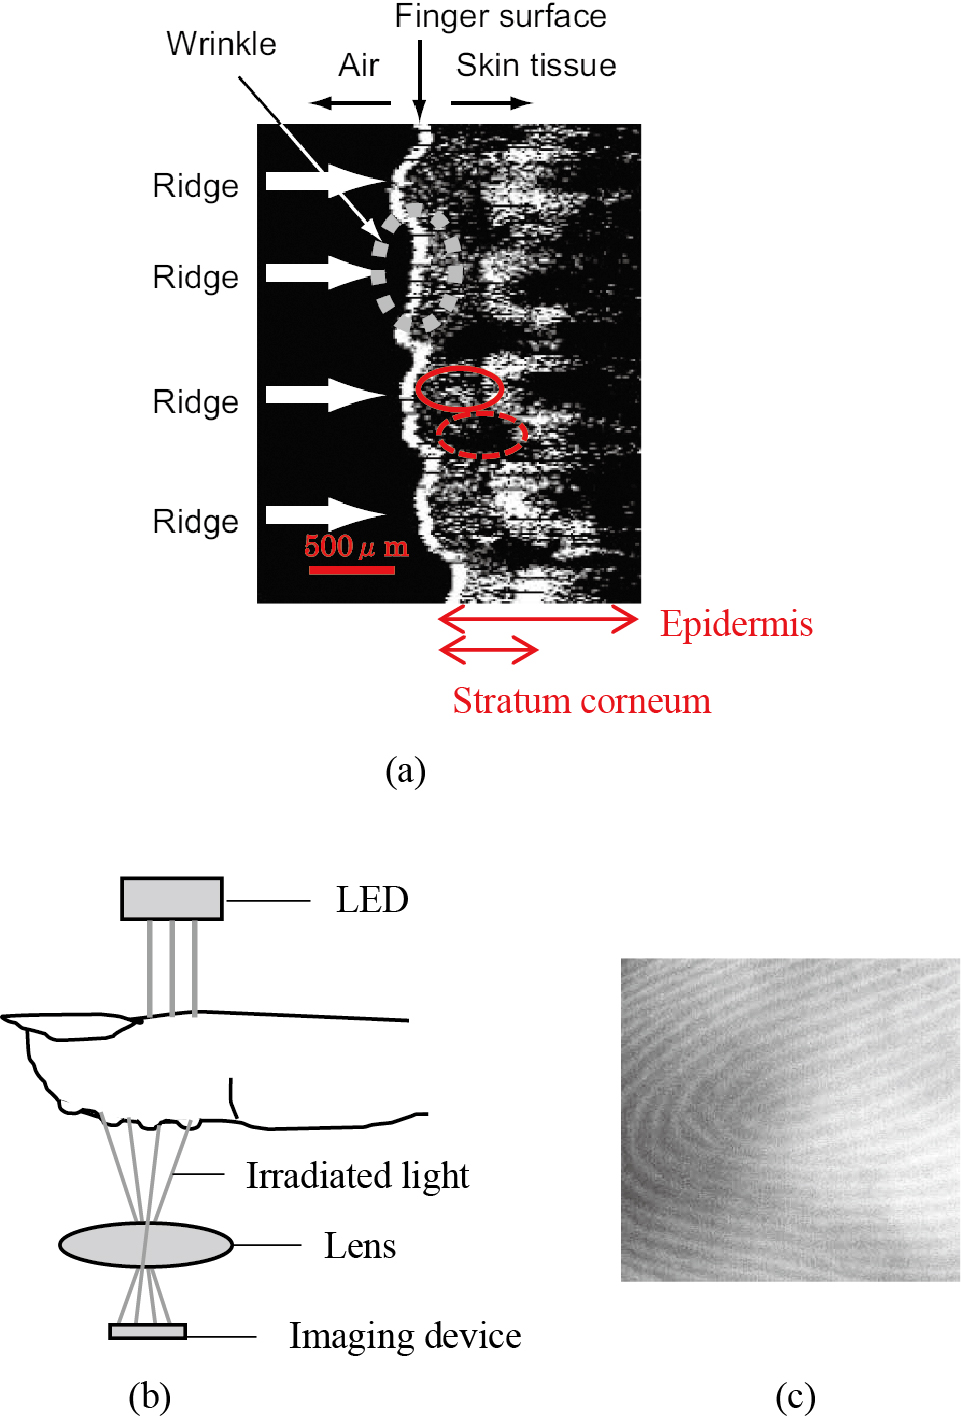
Principles of our fingerprint sensor.
(a) OCT images of human fingerprint skin (Modified from Fig.2 in reference 7); This structure exhibited weak and strong light scattering at the sites corresponding to the fingerprint protrusions, i.e., ridges ((a), solid circles), and indentations, i.e., valleys ((a), dotted circles), respectively. Red characters, lines and circles are added by author. (b) sensor structure (Modified from Fig.14 in reference 8) and (c) sensor output image (Reprinted from Fig.15(a) in reference 8) ; Our sensor consists of LED, lens and Imaging device. The light from the light source goes through the finger and the fingerprint in order to reach the imaging device and then the greyscale image produced.
Fingerprint sensor images of the same finger with wrinkles are illustrated in Fig.28). These were obtained by our sensor (Fig.2(a)) and a conventional device (Fig.2(b)). The fingerprint pattern is represented by a diagonal line traversing both images from the upper right corner to the lower left. Some bright vertical lines in Fig.2(b) represent wrinkles; however, these lines cannot be represented in Fig.2(a). Although both sensors yielded the same fingerprint pattern, the wrinkles are not shown in the image produced by our sensor. In other words, our sensor successfully obtained the fingerprint pattern without being affected by protrusions and indentations on the skin surface (other than those of the fingerprint). These images correspond to the fine structure in the wrinkled area that appeared in the OCT image in Fig.1(a). Furthermore, in the dermis beneath the epidermis, there is no structure corresponding to the fingerprint ridges and valleys9). The pair of dermal papillae exist each fingerprint ridges although they have protrusions. Accordingly, it is feasible to believe that the fingerprint pattern yielded by our sensor is obtained via the aforementioned detailed structure only.

Output images of wrinkled finger from (a) our sensor and (b) a conventional sensor (Reprinted from Fig.16 in reference 8): Both sensors detect the same fingerprint pattern, the wrinkles are not shown in the image produced by our sensor. This output image indicates that our sensor successfully obtained the fingerprint pattern without being affected by protrusions and indentations on the skin surface
Therefore, based on these results, we constructed the following hypothesis: If a detailed structure is comprised of elements having various light scattering intensities arranged side-by-side, greyscale images reflecting the structural arrangement can be obtained by passing light through the structure. Based on this hypothesis, a simplified simulation model was developed, as shown in Fig.3. Two detailed structures were created as the smallest unit represented by a rectangular parallelepiped, each having different optical properties, and the detailed structures were arranged alternately. These structures represent the fine structures that the author discovered. The value of x = 0.25 mm of the smallest unit was estimated based on the typical widths of the fingerprint ridges and valleys4), and the value of z = 0.25 mm of the smallest unit was estimated based on the thickness of the stratum corneum10) and considering OCT images. The light source is represented by the rectangular object; the light was irradiated from this light source to those detailed structures, and the distance along the z-axis from structures is 5 mm. The detector is represented by the rectangular object, and the distance along the z-axis from the structure is 0.3 mm. In our simulation, the detailed structure was placed between an opposing light source and detector, and the light intensity distribution reaching the detector was calculated via a Monte Carlo simulation. Furthermore, the simulated light source emitted red light distributed according to a Lambertian distribution, as tissue is a strongly scattering medium.

Our simplified simulation model.
Two detailed structures were created as the smallest unit and arranged alternately. Each having different optical properties, weak scattering and strong scattering. The unit sizes were estimated based on the typical widths of the fingerprint ridges and valleys3), and considering OCT images. In our simulation, the detailed structure was placed between an opposing light source and detector.
The optical properties were described in terms of the scattering coefficient μs, the absorption coefficient μa, and the anisotropy factor g of the Henyey-Greenstein phase function. Both measured and calculated values for these parameters exist for the tissue components, i.e., the epidermis and dermis11); however, there are no measured values for the detailed structures described above. Therefore, on the basis of the values given in Ref. 11, we assumed that the mean values for the weak and strong scattering areas calculated as mean free path values, l = 1/(μs + μa), could serve as the epidermis values in the present report. As shown in Table 1, we hypothesized two parameter sets for both strong and weak scattering, to verify whether or not the difference in the l values of the weak and strong scattering areas affects the image contrast.
| Bashkatov (2007)11) at 640 nm |
(1) | (2) | |||
|---|---|---|---|---|---|
| Strong scattering | Weak scattering | Strong scattering | Weak scattering | ||
| l [mm] | 0.0377 | 0.0577 | 0.0177 | 0.0477 | 0.0277 |
| g | 0.805 | 0.805 | 0.805 | 0.805 | 0.805 |
We hypothesized two parameter sets for both strong and weak scattering, to verify whether or not the difference in the l values of the weak and strong scattering areas affects the image contrast.
The light distribution on the detector, as illustrated in Fig.4, is a result of the simulation. The output image in Fig.4(a) was simulated using parameters from Table 1(1). The output image in Fig.4(b) was simulated using Table 1(2). The luminance of the output image represents the number of light beams; the bright area indicates many beams while dark area indicates few beams. We found that the obtained image had a greyscale layout corresponding to the form of the detailed structure shown in Fig.3. Furthermore, the contrast of the image in Fig.4(a) is greater than that of the image in Fig.4(b). The greyscale structure indicated the intensity of the light scattering by the detailed structure (Fig.3), with the areas corresponding to strong and weak scattering appearing dark and light, respectively. Furthermore, the greater the difference between the l values of the weak and strong scattering areas, the greater the contrast in the obtained greyscale image.

Simulation output images for (a) Table 1 (1) and (b) Table 1 (2) parameters.
Greyscale layouts correspond to the form of the detailed structure shown in Fig.3. Furthermore, the contrast of image (a) is greater than image (b). This indicates that the greater the difference between the l values of the weak and strong scattering areas, the greater the contrast in the obtained greyscale image.
Based on the above results, we elucidated both the optical property distribution of the structure within the finger and the light scattering process exploited by our sensor. Hence, we found that the passing of light through a structure with aligned components having different light scattering properties yields greyscale images corresponding to the structure.
In addition, we discuss the possibility that this structure, with aligned components, does not exist in regions other than the stratum corneum. The upper layer of the strong scattering layer represented by the white dotted array with a curve along protrusions and indentations on the surface of the fingerprint is considered as the stratum corneum in Fig.1(a). Because the thickness of the stratum corneum is approximately 200–500 μm11). Therefore, we conclude that this structure, with aligned components, is present in the stratum corneum.
This finding provides theoretical evidence that the images obtained by our fingerprint sensor are derived from the detailed structures within the finger. Furthermore, when generalized, we believe that effective simulation of more complex shapes and accurate estimation of the relevant parameters will allow calculation of optical property distributions inside the live body via transmission imaging.
We proposed a simple simulated model of the fine structure of different light scattering properties alternately arranged in the epidermis of a finger skin. We calculated the light intensity distribution via a Monte Carlo simulation of light scattering with two parameter sets at 640 nm. We found that the light passing through this model created a greyscale image that corresponded to the epidermis structure.
The authors declare no conflicts of interest associated with this manuscript.