Abstract
The lactic acid bacteria involved in fermentation and components in the tea leaves of Awa-bancha, a post-fermented tea produced in Naka, Kamikatsu, and Miyoshi, Tokushima, were investigated in the present study. Lactic acid bacteria were isolated from tea leaves after anaerobic fermentation and identified by multiplex PCR targeting of the recA gene and 16S ribosomal RNA gene homology. Lactiplantibacillus pentosus was the most frequently isolated species in Naka and Kamikatsu and Lactiplantibacillus plantarum in Miyoshi. In the phylogenetic tree based on the dnaK gene, L. pentosus isolated from Awa-bancha was roughly grouped by the production area and producer. The bacterial flora after anaerobic fermentation was dominated by Lactiplantibacillus spp. for most producers, and the compositions of samples from each producer varied. Organic acids, free amino acids, and catechins were analyzed as components related to the flavor of Awa-bancha. These components were unique to each producer. The present results revealed diversity in the lactic acid bacteria and flavor of Awa-bancha that depended on the producer.
Tea fermented by microorganisms is known as post-fermented tea; aerobic fermented tea is produced by fungi, anaerobic fermented tea by lactic acid bacteria, and two-stage fermented tea by both aerobic and anaerobic fermentation (Miyagawa, 1994). Post-fermented tea is only produced in a limited area of the world. In Asia, the aerobically fermented type is made in China for Pu’er tea (Guo et al., 2004), while anaerobically fermented tea is produced in Thailand (Horie et al., 2020) and Myanmar for Laphetso (Fukushiyama and Tain, 2009). Four types of post-fermented tea are produced in Japan. The aerobically fermented tea Batabata-cha is made in Toyama (Nakagawa, 1979; Horie et al., 2019a), and the three other types come from Shikoku Island (Fig. 1). The two-stage fermented tea Ishizuchi-kurocha (Kato et al., 1995; Horie et al., 2019b) is produced in Saijo, Ehime, and another two-stage fermented tea, Goishi-cha (Kato et al., 1994) is made in Otoyo, Kochi. Awa-bancha, the subject of the present study, is primarily produced in Naka and Kamikatsu, Tokushima. In recent years, Awa-bancha has also been made in Miyoshi, western Tokushima. Awa-bancha is an anaerobically fermented tea, and no other tea in Japan is made in a similar manner. Its production method is similar to that of Miang in Thailand (Horie et al., 2020). Awa-bancha is primarily produced between July and September. The tea leaves are picked, placed directly into a kettle or basket, and boiled for a few min until the tea leaves turn brown. The boiled tea leaves are kneaded with a kneading machine and packed in a wood or plastic barrel to prevent exposure to air. The top of the barrel is then covered with a stone, and the leaves are anaerobically fermented for two to several weeks. After fermenting, the tea leaves are taken out, loosened, and dried on a rug in the sun for approximately one to three days. Nuts and branches are removed, the dried tea leaves are packed into a bag to prevent breakage, and the product is complete. The anaerobic fermentation of Awa-bancha is performed by lactic acid mainly composed of lactic acid bacteria, which play an important role. Awa-bancha has a refreshing sour taste due to the change induced in tea leaf components by anaerobic fermentation and the production of organic acids, mainly lactic acid (Kato et al., 1993; Miyazaki and Nakanishi, 2007). A starter is not used, and anaerobic fermentation is performed by lactic acid bacteria in the production environment. Lactiplantibacillus pentosus and Lactiplantibacillus plantarum have been identified as the lactic acid bacteria involved in the fermentation of Awa-bancha (Okada et al., 1996; Sato et al., 2019; Nishioka et al., 2020). Awa-bancha from each producer has a unique flavor. The diversity of lactic acid bacteria involved in fermentation may be one of the factors contributing to the individuality of Awa-bancha; however, a detailed analysis that focuses on each producer has not yet been conducted. In the present study, Awa-bancha produced in Naka, Kamikatsu, and Miyoshi, Tokushima was collected for two years, and lactic acid bacteria and components related to flavor were examined.

Materials and Methods
Tea leaves
Awa-bancha was collected from producers in Naka, Kamikatsu, and Miyoshi, Tokushima. In 2019, samples were collected from two producers in Naka (producers A and B), two in Kamikatsu (producers C and D), and one in Miyoshi (producer E). In 2020, tea samples were collected from one producer in Naka (producer A), one in Kamikatsu (producer C), and two in Miyoshi (producers E and F). In 2020, Ishizuchi-kurocha tea leaves were collected after anaerobic fermentation from producer G in Saijo, Ehime for comparison. The tea leaves used to isolate lactic acid bacteria were stored at 4°C until used in the experiment. The tea leaves used in the component analysis were freeze-dried and then powdered using a mill (IFM-700G; Iwatani).
Isolation and identification of lactic acid bacteria from post-fermented tea
Lactic acid bacteria were isolated from tea leaves following the anaerobic fermentation of Awa-bancha and Ishizuchi-kurocha. Sterilized phosphate-buffered saline (PBS) was added to moist tea leaves after anaerobic fermentation to reach a concentration of tea leaves relative to PBS of 100 mg mL–1. The mixture was then stirred with a vortex mixer for 1 min. The supernatant was smeared on de Man, Rogosa, and Sharpe (MRS) agar plates (Becton, Dickinson and Company) and cultured in an anaerobic jar at 35°C for 2 days using AnaeroPack Kenki (Mitsubishi Gas Chemical). The colonies that grew were isolated and cultured in 10 mL of MRS broth at 35°C for 1 day using a screw-cap test tube. After the culture broth had been centrifuged at 9,000 rpm for 10 min, the supernatant was removed to obtain pellets. NucleoSpin Tissue (Macherey-Nagel GmbH & Co KG) was used to extract DNA from lactic acid bacteria. A pellet was suspended in lysis solution included in the DNA extraction kit and sonicated for 5 min using a Bioruptor (Sonic Bio). The DNA extraction operation followed the protocol included with the kit. Lactic acid bacteria species were identified by multiplex PCR targeting of the recA gene (Torriani et al., 2001) and 16S rRNA gene homology. Multiplex PCR targeting of the recA gene was performed to identify members of the L. plantarum group (L. plantarum, L. pentosus, and Lactiplantibacillus paraplantarum). DNA extracted from lactic acid bacteria was used as a template. The primers used were as follows: paraF (5′-GTCACAGGCATTACGAAAAC-3′), pentF (5′-CAGTGGCGCGGTTGATATC-3′), planF (5′-CCGTTTATGCGGAACACCTA-3′), and pREV (5′-TCGGGATTACCAAACATCAC-3′). TaKaRa Ex Taq (Takara Bio) was used as the PCR enzyme. The total volume of the PCR reaction mixture was 50 μL, and its contents were as follows: 1 μL of template DNA, 5 μL of 10×Ex Taq buffer (Mg2+-free), 1.5 mM of MgCl2, 0.25 μM each of the primers paraF, pentF, and pREV, 0.12 μM of planF, 0.2 mM of each deoxynucleotide triphosphate mixture, and 1.25 U of Ex Taq polymerase. PCR amplification conditions were as follows: initial denaturation at 94°C for 3 min, 30 cycles at 94°C for 30 s, 56°C for 10 s, and 72°C for 30 s, followed by 72°C for 5 min. The PCR amplification product was electrophoresed on a 2% agarose gel, and the appearance of bands was confirmed. The PCR amplification products of multiplex PCR targeting of the recA gene were 318 bp for L. plantarum, 218 bp for L. pentosus, and 107 bp for L. paraplantarum. Regarding lactic acid bacteria strains for which no band appeared, the 16S rRNA gene was amplified from extracted DNA with a primer for lactic acid bacteria (Lane, 1991). The primers used were 27F (5′-AGAGTTTGATCCTGGCTCAG-3′) and 1492R (5′-GGTTACCTTGTTACGACTT-3′). The total volume of the PCR reaction mixture was 50 μL, and its contents were as follows: 1 μL of template DNA, 5 μL of the 10×Ex Taq buffer (Mg2+ plus), 1 μM of each of the primers 27F and 1492R, 0.2 mM of each deoxynucleotide triphosphate mixture, and 1.25 U of Ex Taq polymerase. PCR amplification conditions were as follows: initial denaturation at 95°C for 3 min, 40 cycles at 95°C for 30 s, 55°C for 55 s, and 72°C for 1 min, followed by 72°C for 10 min. The PCR amplification product was purified and sequenced using the Sanger method by Macrogen Japan. The sequencing primer used was LAB-SeqF (5′-TCCTGGCTCAGGACGAACGCT-3′). The sequence was searched for homology using the Standard Nucleotide BLAST of the National Center for Biotechnology Information (https://blast.ncbi.nlm.nih.gov/Blast.cgi), and the bacterial species was identified.
L. pentosus NBRC 106467T, L. pentosus NBRC 12011, L. plantarum subsp. plantarum NBRC15891T, and L. paraplantarum NBRC107151T were purchased from the Biological Resource Center of the National Institute of Technology and Evaluation (Tokyo, Japan) for comparison with the lactic acid bacteria isolated from Awa-bancha.
Phylogenetic analysis based on the dnaK gene of lactic acid bacteria
To amplify the dnaK gene, DNA extracted from lactic acid bacteria was used as a template with the primers Lpdnak-500F3 (5′-CCGTTCTTRTCRATRTCRAA-3′) and Lpdnak-1710R5 (5′-GAAAYYCAAGTYGGHGAAGT-3′) (Huang et al., 2010). The total volume of the PCR reaction mixture was 50 μL, and its contents were as follows: 1 μL of template DNA, 5 μL of the 10×Ex Taq buffer (Mg2+ plus), 1 μM of each primer Lpdnak-500F3 and Lpdnak-1710R5, 0.2 mM of each deoxynucleotide triphosphate mixture, and 1.25 U of Ex Taq polymerase. PCR amplification conditions were as follows: initial denaturation at 94°C for 5 min, 35 cycles at 94°C for 1 min, 58°C for 1 min, and 72°C for 1 min, followed by 72°C for 7 min. The PCR amplification product was purified and sequenced using the Sanger method by Macrogen Japan. The sequencing primer used was Lpdnak-500F3. The elucidated nucleotide sequence was aligned using ClustalW (https://clustalw.ddbj.nig.ac.jp/). The phylogenetic tree was constructed using NJplot (http://doua.prabi.fr/software/njplot). The reference strain was obtained from GenBank (https://www.ncbi.nlm.nih.gov/genbank/).
Analysis of bacterial flora after the anaerobic fermentation of Awa-bancha
Bacterial DNA was extracted from 0.3 g of moist tea leaves after anaerobic fermentation in 100 μL of RNase-free water using Extrap Soil DNA Kit Plus ver.2 (Nippon Steel Eco-Tech) according to the manufacturer’ s protocol. The primers used for PCR amplification targeted the 16S rRNA gene V3–V4 region-specific portion, and 341F/805R (Klindworth et al., 2013) with an Illumina adapter sequence. A 6-base index sequence for sample identification was added as the forward primer between the Illumina adapter sequence and target region-specific sequence. The target region-specific sequences used were 341F (5′-CCTACGGGNGGCWGCAG-3′) and 805R (5′-GACTACHVGGGTATCTAATCC-3′). The total volume of the PCR reaction mixture was 25 μL, and the contents included 2.5 μL of template DNA, 0.3 μM each of the primers 341F and 805R, and 12.5 μL of KAPA HiFi HS ReadyMix (KAPA Biosystems). PCR amplification conditions were as follows: initial denaturation at 95°C for 5 min, 26 cycles at 98°C for 20 s, 60°C for 15 s, and 72°C for 15 s, followed by 72°C for 5 min. PCR amplification products were sequenced using the MiSeq system (Illumina). The resulting Fastq file was demultiplexed to each sample based on the index sequence. In this process, reads with base Q-scores less than 30 in the index part were removed. After separation, the leads were filtered by fastp (Chen et al., 2018). During filtering, the primer part was removed by truncating 23 bases at the 5' end of the forward read and 21 bases at the 5' end of the reverse read. In both reads, a single base at the 3' end was truncated, reads with an average Q-score of less than 30 were removed, and low-quality bases at the 3' end (average Q-score less than 30) were truncated using a sliding window (window size 4). A sequence analysis was performed on the filtered reads using QIIME 2 2021.4 (Bolyen et al., 2019). DADA2 (Callahan et al., 2016) (via q2-dada2) was used for sequence denoising, and amplicon sequence variants (ASVs) were created. The q2‐feature‐classifier (Bokulich et al., 2018) plugin was used with the classify‐sklearn naïve Bayes taxonomy classifier for the taxonomic assignment to each ASV, and the taxonomic classifier used in this process was created based on Silva release 138.1 SSU 99% (https://www.arb-silva.de/) (Quast et al., 2013; Yilmaz et al., 2014) by curating with RESCRIPt (Robeson, M.S., et al. 2020. RESCRIPt: Reproducible sequence taxonomy reference database management for the masses. bioRxiv doi: https://doi.org/10.1101/2020.10.05.326504), extracting the V3–V4 region based on the amplification primer sequences, and training with the qiime feature-classifier fit-classifier-naive-bayes command. In the Curation process by RESCRIPt, the removal of low-quality sequences (containing 5 or more ambiguous bases and any homopolymers that are 8 or more bases in length), length filtering (sequences that did not meet the following criteria were removed: Archaea ≥900 bp, Bacteria ≥1,200 bp, and any Eukaryota ≥1,400 bp), and the removal of duplicate sequences were performed. ASVs with presumed chloroplast and mitochondrial origins were removed from the ASV table.
Component analysis of Awa-bancha
Organic acids were analyzed with the post-column method using an organic acid analyzer (EXTREMA; JASCO). Analytical samples were prepared by adding water to tea powder to a concentration of 100 mg mL–1, shaking for 1 h, and then passing the solution through a 0.45-μm filter. An RSpak KC-811 (8×300 mm; Showa Denko) column was used for the analysis, which was conducted at 60°C. The mobile phase consisted of 3.0 mM HClO4, and the flow rate was 1.0 mL min–1. The reaction phase consisted of 0.2 mM bromothymol blue in 15.0 mM Na2HPO4 with a flow rate of 1.5 mL min–1. Organic acids were detected at a wavelength of 445 nm. Free amino acids were analyzed using a fully automatic amino acid analyzer (JLC-500V/2; JEOL). Analytical samples were prepared by adding 10% sulfosalicylic acid to tea powder to a concentration of 100 mg mL–1, shaking for 1 h, and then the supernatant was mixed with a lithium citrate buffer (P-21, pH 2.98, JEOL) at a ratio of 1:1 and passed through a 0.45-μm filter. Catechins and caffeine were analyzed using high-performance liquid chromatography (Waters). Regarding samples to be analyzed, a mixture of equal parts of water and acetonitrile was added to the tea powder to a concentration of 5 mg mL–1 and shaken for 40 min, and the supernatant was then passed through a 0.45-μm filter. A Capcell Pak C18 UG120 (4.6×100 mm; Shiseido) column was used for the analysis, which was conducted at 40°C. The mobile phase consisted of 0.5% (v/v) phosphoric acid/methanol (82/18) and the flow rate was 0.8 mL min–1. Caffeine and catechins were detected at a wavelength of 280 nm.
Results
Isolation and identification of lactic acid bacteria from post-fermented tea
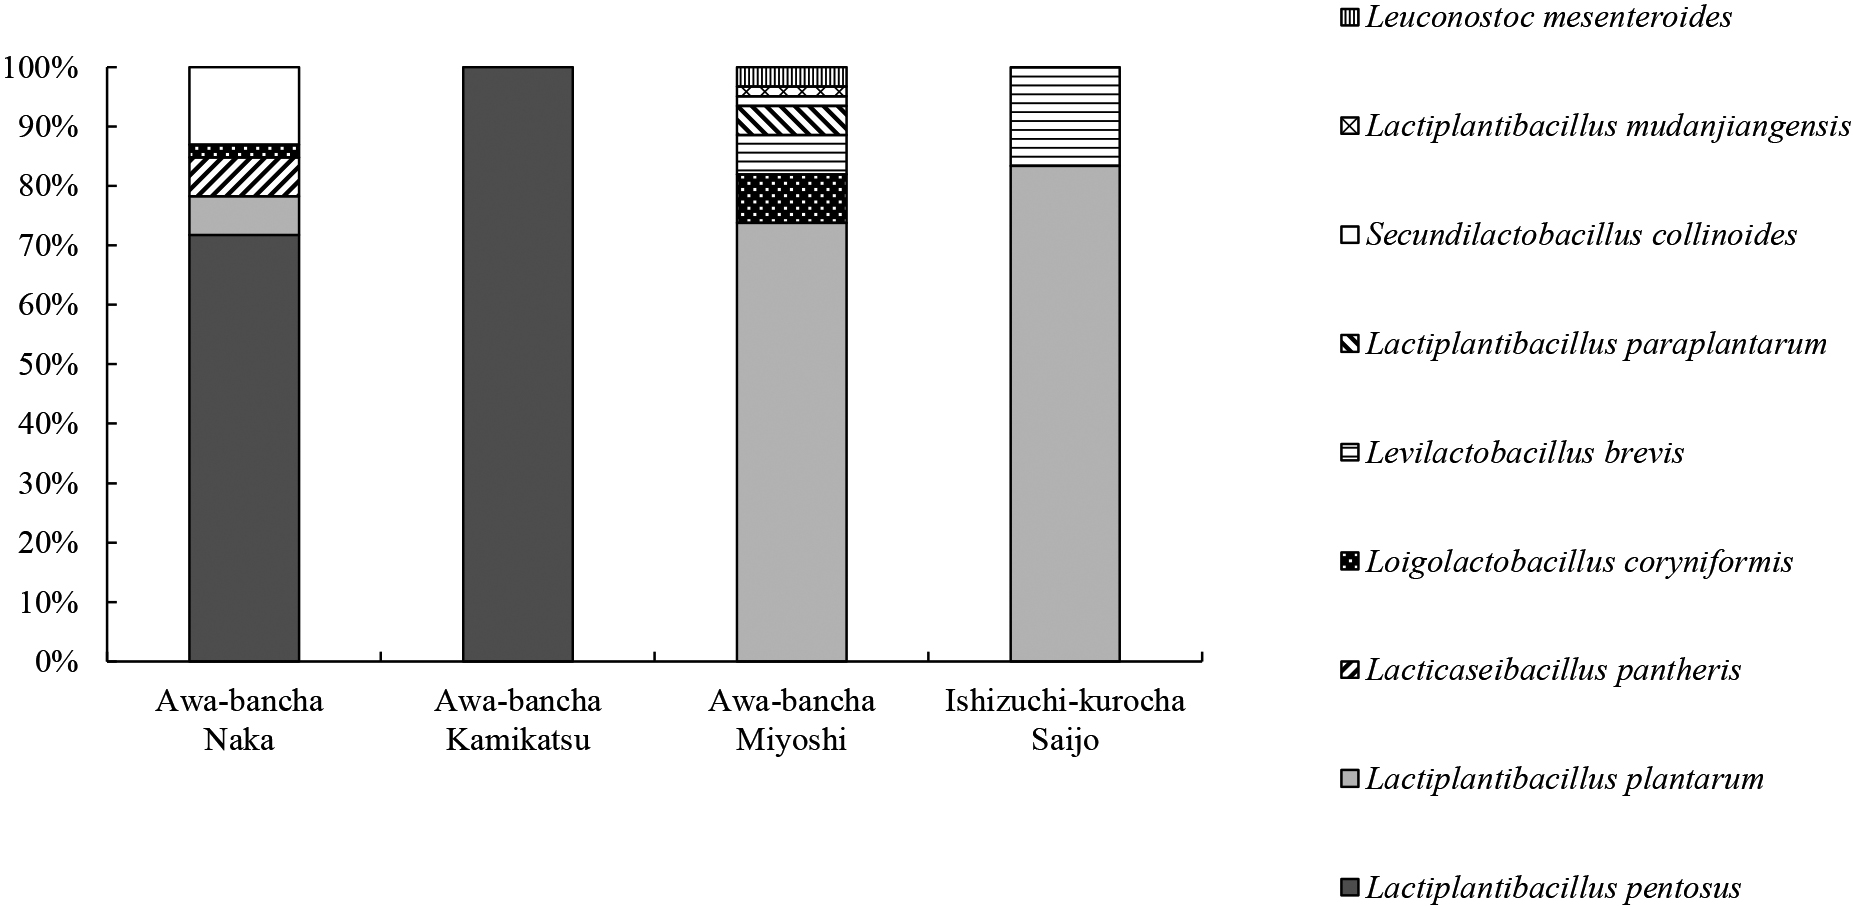
With the use of MRS agar plates, 146 strains of lactic acid bacteria were isolated from tea leaves after the anaerobic fermentation of Awa-bancha produced in 2019 and 2020. Twelve strains of lactic acid bacteria were isolated from Ishizuchi-kurocha produced in 2020 for comparison. The species of lactic acid bacteria were identified by multiplex PCR targeting of the recA gene and 16S rRNA homology (Table S1). Regarding producer A in Naka, L. pentosus was the most frequently isolated lactic acid bacteria from two lots of Awa-bancha in 2019. Other isolates were Secundilactobacillus collinoides, Lacticaseibacillus pantheris, and Loigolactobacillus coryniformis. L. pentosus was the most frequently isolated species from the 2020 lot, and L. plantarum was also isolated. In the case of producer B in Naka, L. pentosus was the most frequently isolated species in 2019, followed by L. plantarum. Regarding producers C and D in Kamikatsu, only L. pentosus was separated in all lots. L. plantarum was the most frequently isolated from the two 2019 lots of producer E in Miyoshi, followed by Levilactobacillus brevis, Leuconostoc mesenteroides, and Lactiplantibacillus mudanjiangensis. In the 2020 lot of the same producer, L. plantarum was the most frequently isolated, and L. coryniformis and S. collinoides were also isolated. In the case of producer F in Miyoshi, L. plantarum was the most frequently isolated lactic acid bacteria, and L. paraplantarum and L. coryniformis were also isolated. Regarding Ishizuchi-kurocha by producer G in 2020, L. plantarum was the most frequently isolated lactic acid bacteria, followed by L. brevis. Fig. 2 shows the proportions of lactic acid bacteria isolated in 2019 and 2020 for each production area. Among the lactic acid bacteria isolated from Awa-bancha, L. pentosus was dominant in Naka and Kamikatsu, whereas L. plantarum was dominant in Miyoshi. L. plantarum was also dominant in Ishizuchi-kurocha.
We analyzed dnaK genes in L. pentosus, L. plantarum, and L. paraplantarum isolated from Awa-bancha and Ishizuchi-kurocha (Table S2). We also created a phylogenetic tree based on the dnaK gene (Fig. 3). The lactic acid bacteria isolated from Awa-bancha were roughly grouped by the production area and producer. Furthermore, for L. pentosus, which was isolated from the same producer in different production years, some strains were located nearby. Similarly, L. plantarum isolated from Awa-bancha was also roughly grouped by the producer.
Analysis of bacterial flora after the anaerobic fermentation of Awa-bancha
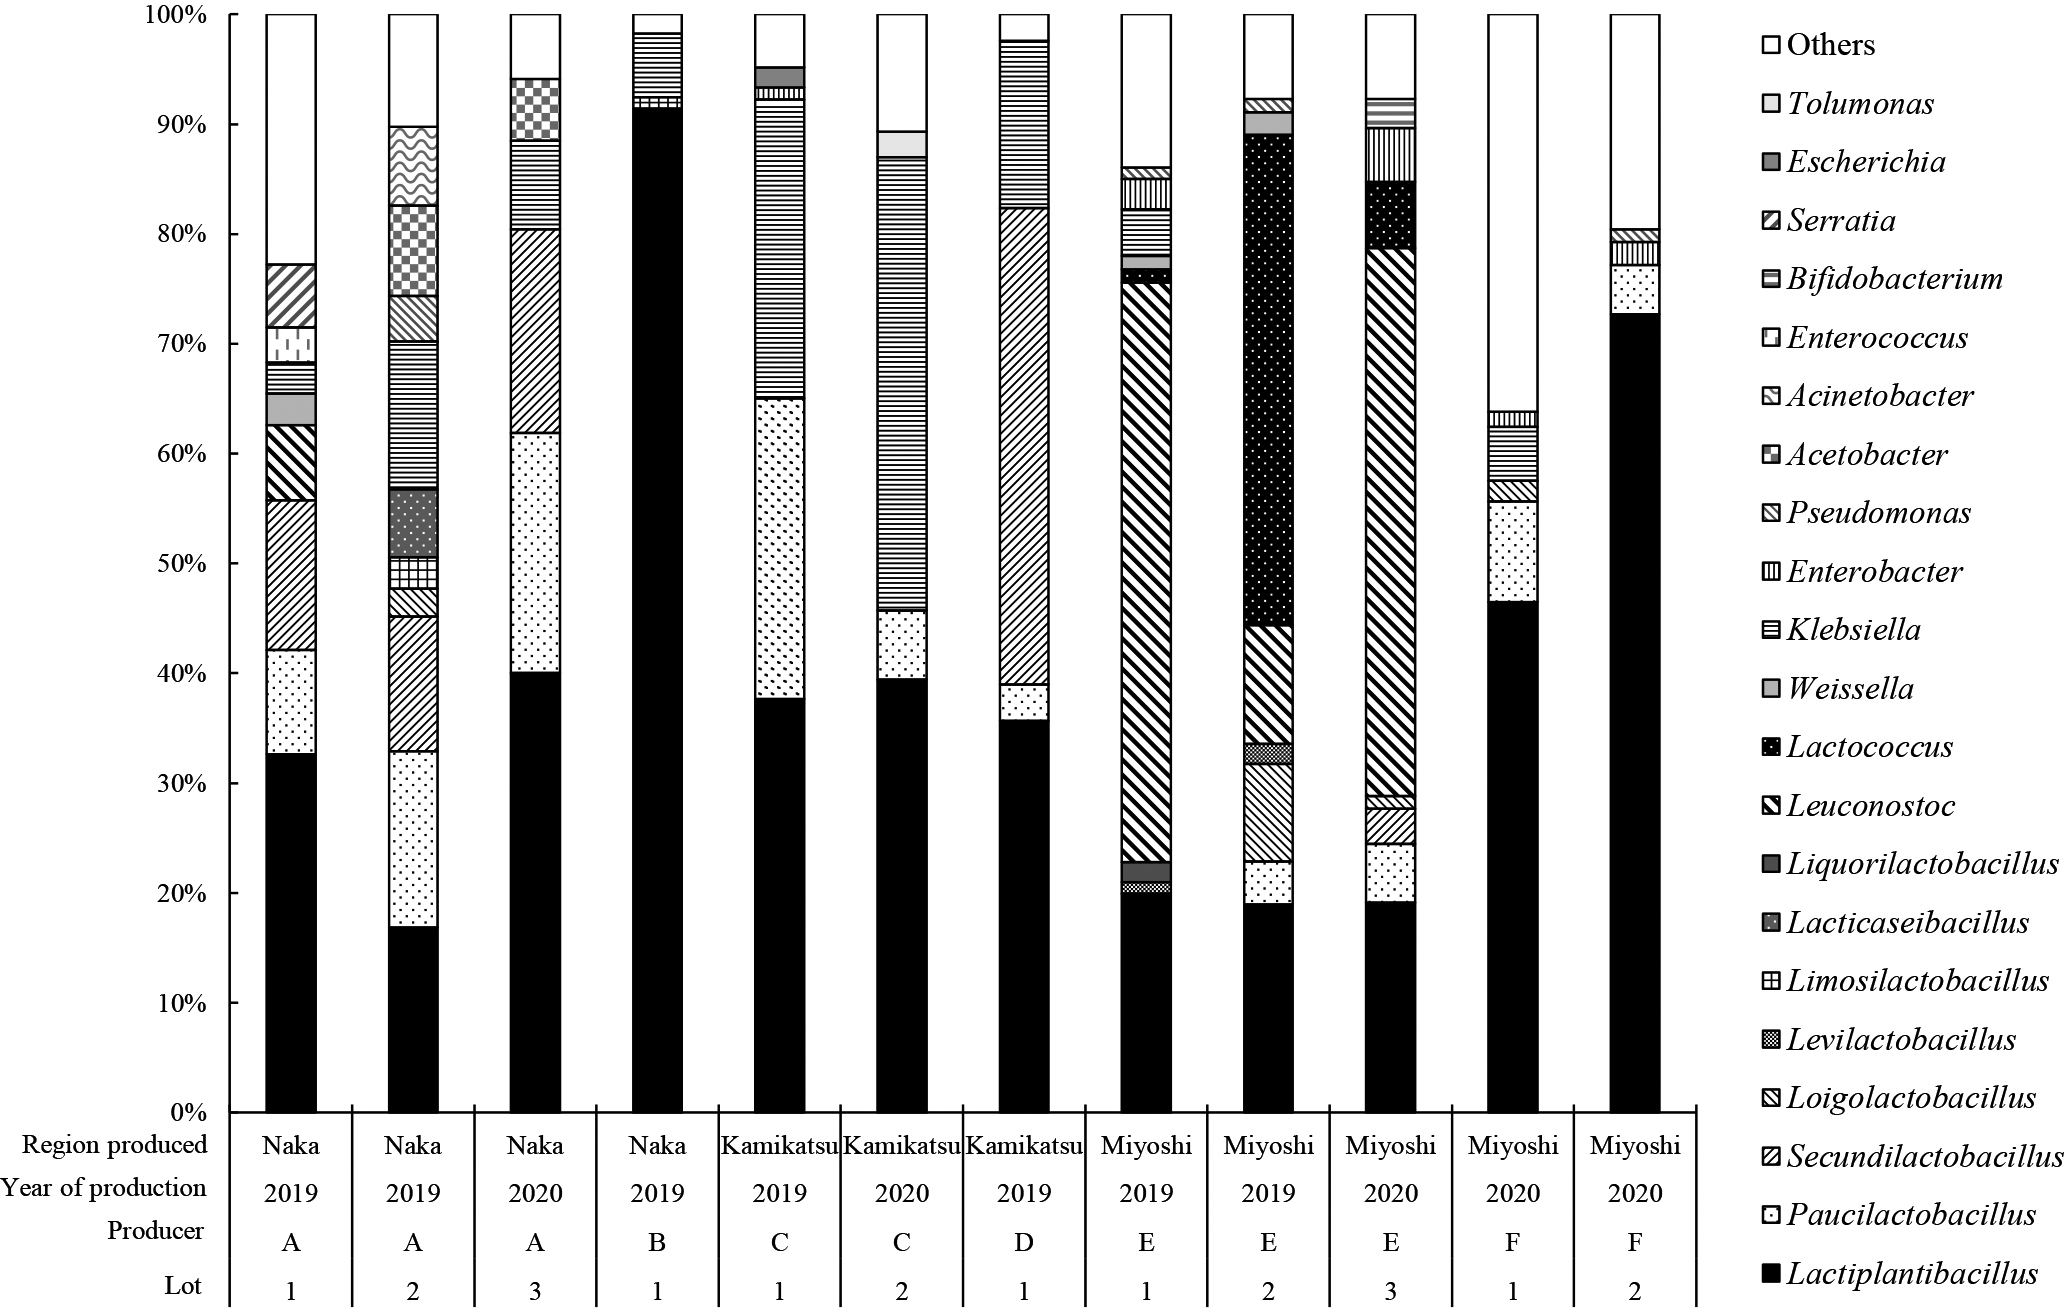
The results of a bacterial flora analysis of tea leaves after the anaerobic fermentation of Awa-bancha showed that Lactiplantibacillus spp. was the most dominant among the approximate producers, although it varied among producers (Fig. 4). Lactiplantibacillus spp. was detected in all producers and accounted for between 16.8 and 91.4% of the flora. Other bacteria differed among producers, and Paucilactobacillus spp., Secundilactobacillus spp. and Klebsiella spp. were detected. On the other hand, in the case of producer E, Leuconostoc spp. and Lactococcus spp. dominated the flora, followed by Lactiplantibacillus spp.
Component analysis of Awa-bancha
The components of dried tea leaves were analyzed (Table 1). An organic acid analysis revealed that lactic acid was the most abundantly detected in the tea leaves of most producers after anaerobic fermentation. In addition, acetic acid and oxalic acid were detected at the second highest concentration. Acetic acid was detected at the highest concentration in lot 2 from producer A and lot 3 from producer E. The average total amount of organic acids was approximately 3,200 mg 100 g–1; however, the amount for each producer differed. For example, the amount of organic acid in tea leaves from producer E was as low as approximately 900 to 1,600 mg 100 g–1, while that from producer F was as high as approximately 5,400 to 5,900 mg 100 g–1. In the analysis of catechins, EGC was the most abundant for most producers, followed by EGCg. The average total amount of catechins was approximately 6,700 mg 100 g–1; however, this also varied among producers. Producer A had a small amount of catechins, approximately 1,500 to 3,900 mg 100 g–1, producer C had a large amount, approximately 9,200 to 10,700 mg 100 g–1, and producer F had a large amount approximately 11,700 to 12,600 mg 100 g–1. In the free amino acid analysis, theanine was detected at the highest amount, followed by glutamic acid. In addition, a large amount of γ-aminobutyric acid was detected in lot 2 of producer A and in lots 2 and 3 of producer E.
Table 1.
Components of Awa-bancha.
mg 100 g
–1
| Region produced |
Naka |
Naka |
Naka |
Naka |
Kamikatsu |
Kamikatsu |
Kamikatsu |
Miyoshi |
Miyoshi |
Miyoshi |
Miyoshi |
Miyoshi |
| Year of production |
2019 |
2019 |
2020 |
2019 |
2019 |
2020 |
2019 |
2019 |
2019 |
2020 |
2020 |
2020 |
| Producer |
A |
A |
A |
B |
C |
C |
D |
E |
E |
E |
F |
F |
| Lot |
1 |
2 |
3 |
1 |
1 |
2 |
1 |
1 |
2 |
3 |
1 |
2 |
| Organic acids |
Oxalic acid |
126.1 |
233.2 |
732.4 |
183.2 |
372.7 |
709.8 |
669.9 |
130.9 |
112.2 |
358.8 |
2,260.7 |
1,506.4 |
| Citric acid |
13.9 |
— |
80.7 |
76.4 |
114.3 |
235.1 |
367.1 |
— |
— |
17.4 |
59.1 |
69.1 |
| Malic acid |
— |
— |
36.7 |
— |
— |
— |
16.2 |
— |
— |
24.3 |
26.9 |
29.0 |
| Succinic acid |
280.5 |
126.0 |
226.0 |
206.1 |
195.1 |
286.0 |
287.5 |
90.3 |
113.5 |
236.8 |
519.9 |
427.9 |
| Lactic acid |
3,505.5 |
688.8 |
2,399.3 |
2,297.6 |
829.4 |
1,618.6 |
1,237.1 |
561.1 |
958.3 |
83.4 |
2,751.2 |
3,036.5 |
| Acetic acid |
623.7 |
1,773.1 |
817.5 |
382.6 |
385.5 |
489.4 |
849.3 |
133.4 |
352.7 |
891.6 |
267.0 |
342.6 |
| Total organic acids |
4,549.7 |
2,821.1 |
4,292.6 |
3,145.9 |
1,897.1 |
3,338.9 |
3,427.0 |
915.8 |
1,536.7 |
1,612.3 |
5,884.8 |
5,411.3 |
| Catechins |
EGC |
1,123.0 |
1,081.4 |
1,893.4 |
2,013.3 |
5,528.9 |
6,145.4 |
2,531.5 |
2,315.6 |
2,942.8 |
5,441.4 |
6,685.7 |
6,656.2 |
| C |
371.0 |
312.5 |
403.3 |
57.9 |
161.1 |
203.7 |
37.4 |
149.1 |
164.7 |
— |
289.6 |
249.9 |
| EGCg |
1,001.3 |
105.4 |
1,231.2 |
3,084.5 |
1,625.0 |
2,192.8 |
960.6 |
3,484.4 |
1,921.2 |
803.6 |
3,738.3 |
3,032.8 |
| EC |
111.6 |
— |
— |
91.8 |
1,402.6 |
1,401.8 |
— |
101.6 |
— |
— |
1,265.9 |
1,159.7 |
| ECg |
247.0 |
— |
340.2 |
644.3 |
477.9 |
772.7 |
322.9 |
601.8 |
353.1 |
156.6 |
603.1 |
553.7 |
| Total catechins |
2,853.8 |
1,499.3 |
3,868.2 |
5,891.8 |
9,195.5 |
10,716.3 |
3,852.4 |
6,652.5 |
5,381.8 |
6,401.6 |
12,582.6 |
11,652.3 |
| Caffeine |
591.2 |
1,744.2 |
1,453.4 |
497.5 |
1,392.5 |
729.6 |
1,004.0 |
1,652.1 |
1,368.6 |
1,485.4 |
1,541.3 |
466.8 |
| Free amino acids |
O-Phosphoserine |
12.9 |
22.9 |
16.6 |
13.0 |
12.1 |
13.2 |
17.4 |
7.2 |
9.3 |
10.5 |
11.5 |
6.7 |
| Taurine |
5.5 |
24.7 |
8.7 |
7.1 |
3.2 |
3.1 |
— |
4.1 |
6.2 |
4.2 |
3.4 |
2.2 |
| O-Phosphoethanolamine |
2.4 |
4.4 |
2.1 |
3.3 |
2.7 |
3.2 |
2.5 |
1.8 |
1.5 |
1.3 |
3.0 |
— |
| Threonine |
0.5 |
0.8 |
— |
— |
0.7 |
— |
0.5 |
— |
— |
— |
— |
— |
| Serine |
1.4 |
2.1 |
0.8 |
1.2 |
1.6 |
0.8 |
2.1 |
1.8 |
0.7 |
3.1 |
2.0 |
1.3 |
| Asparagine |
— |
8.0 |
— |
12.5 |
— |
— |
— |
11.9 |
16.9 |
— |
— |
— |
| Glutamic acid |
90.2 |
44.8 |
27.8 |
112.0 |
80.0 |
118.4 |
115.0 |
67.5 |
14.7 |
19.7 |
97.3 |
44.6 |
| Glutamine |
— |
— |
3.1 |
— |
1.1 |
— |
— |
— |
— |
— |
— |
2.5 |
| Theanine |
187.9 |
99.6 |
145.8 |
338.2 |
122.2 |
18.7 |
187.2 |
298.8 |
468.5 |
404.2 |
148.6 |
83.1 |
| Glycine |
2.1 |
12.1 |
3.3 |
3.5 |
1.3 |
2.0 |
0.4 |
11.5 |
2.6 |
0.8 |
4.0 |
1.8 |
| Alanine |
11.8 |
96.1 |
22.3 |
33.7 |
15.5 |
18.7 |
19.8 |
0.0 |
16.2 |
8.3 |
21.8 |
16.7 |
| Citrulline |
2.6 |
— |
— |
— |
— |
— |
— |
— |
— |
— |
— |
— |
| α-Aminobutyric acid |
1.1 |
2.6 |
2.8 |
1.1 |
2.1 |
2.1 |
19.8 |
— |
1.1 |
3.5 |
3.9 |
2.0 |
| Valine |
4.1 |
4.7 |
3.5 |
11.0 |
3.1 |
2.0 |
8.4 |
8.5 |
6.6 |
7.1 |
4.6 |
2.5 |
| Cystine |
— |
— |
— |
— |
1.4 |
— |
— |
— |
— |
— |
— |
— |
| Cystathionine |
— |
2.0 |
— |
0.2 |
— |
— |
0.2 |
— |
— |
— |
— |
— |
| Isoleucine |
— |
5.3 |
— |
— |
— |
— |
— |
— |
— |
— |
— |
— |
| Leucine |
— |
19.1 |
0.4 |
1.1 |
— |
— |
0.3 |
— |
0.3 |
— |
0.3 |
— |
| Tyrosine |
— |
8.8 |
— |
— |
— |
— |
— |
— |
— |
— |
— |
— |
| Phenylalanine |
— |
11.0 |
— |
2.4 |
0.7 |
— |
— |
— |
— |
— |
— |
— |
| γ-Aminobutyric acid |
25.7 |
80.5 |
11.4 |
10.7 |
15.0 |
7.2 |
2.2 |
22.1 |
65.6 |
38.3 |
4.5 |
2.3 |
| 2-Aminoethanol |
— |
— |
— |
— |
— |
— |
— |
— |
— |
— |
— |
— |
| Ammonium chloride |
5.9 |
30.9 |
7.6 |
13.0 |
11.1 |
8.6 |
11.9 |
13.0 |
17.2 |
17.3 |
25.5 |
16.6 |
| 5-Hydroxylysine |
— |
— |
— |
— |
— |
— |
— |
— |
— |
— |
— |
— |
| Ornithine |
31.3 |
2.1 |
19.9 |
1.7 |
— |
— |
9.8 |
3.7 |
1.4 |
2.6 |
— |
— |
| 1-Methyl-L-histidine |
— |
— |
— |
— |
0.3 |
— |
— |
— |
— |
— |
— |
— |
| Histidine |
— |
— |
— |
2.0 |
1.2 |
— |
— |
— |
0.4 |
— |
— |
— |
| Lysine |
1.2 |
1.2 |
5.1 |
2.4 |
0.3 |
— |
— |
0.6 |
1.6 |
— |
3.2 |
2.8 |
| Tryptophan |
— |
7.2 |
— |
6.9 |
8.8 |
— |
— |
— |
— |
— |
— |
— |
| Arginine |
— |
— |
— |
4.2 |
7.0 |
— |
— |
— |
— |
— |
— |
— |
| Hydroxyproline |
26.8 |
6.0 |
8.5 |
21.1 |
8.2 |
7.4 |
10.4 |
22.3 |
37.4 |
14.3 |
7.8 |
4.0 |
| Proline |
3.9 |
2.4 |
4.8 |
— |
3.0 |
1.6 |
3.0 |
— |
— |
1.6 |
3.3 |
1.7 |
| Total free amino acids |
417.4 |
499.2 |
294.4 |
602.2 |
302.8 |
207.0 |
411.0 |
474.9 |
668.3 |
536.9 |
344.7 |
190.9 |
—: Overlapped with other peaks or below the detectable level.
EGC: Epigallocatechin, C: Catechin, EGCg: Epigallocatechin gallate, EC: Epicatechin, ECg: Epicatechin gallate.
The following components were not detected: Pyroglutamic acid, Urea, Aspartic acid, 2-Aminoadipic acid, Methionine, β-Alanine, β-Aminoisobutyric acid, Anserine, Carnosine, and 3-Methyl-L-histidine.
Discussion
In the present study, the lactic acid bacteria involved in the fermentation of Awa-bancha and the components related to flavor were investigated for two years. The lactic acid bacteria involved in Awa-bancha fermentation were diverse and depended on the production area and producer. The isolation of lactic acid bacteria on MRS agar plates revealed that L. pentosus was the most frequently isolated among the producers (A, B, C, and D) in Naka and Kamikatsu. On the other hand, L. plantarum was the most frequently isolated among the producers (E and F) in Miyoshi. In addition, the dominant lactic acid bacteria were the same, even in different production years. Geographically, Naka and Kamikatsu are adjacent to each other, while Miyoshi is approximately 70 km west, with Mt. Tsurugi, at an altitude of 1,955 m, between them. L. pentosus and L. plantarum are classified as the L. plantarum phylogenetic group (Hirayama and Endo, 2016) and have been isolated from various plant environments (Okada, 2002; Parente et al., 2010). These genotypes are very close, with more than 99% homology in 16S rRNA (Torriani et al., 2001; Bringel et al., 2005). Therefore, L. pentosus and L. plantarum are very close species; however, it currently remains unknown why the dominant species involved in the fermentation of Awa-bancha differs depending on the production area. L. plantarum was the most frequently isolated from producer G of Ishizuchi-kurocha in Saijo, and similar results were obtained for producers E and F in Miyoshi. The lactic acid bacteria in each region are presumed to be different; however, further clarification is expected in the future. The phylogenetic tree based on the dnaK gene suggested that unique lactic acid bacteria were established in each producer at the strain level. The genome sizes of L. pentosus and L. plantarum are larger than 3 Mb (Kleerebezem et al., 2003; Huang et al., 2018; Niwa et al., 2020); therefore, the properties of each strain and metabolites may markedly differ, thereby affecting the flavor of Awa-bancha. Lactic acid bacterial isolates other than L. pentosus and L. plantarum also differed from producer to producer. In the case of producer A, S. collinoides, L. pantheris, and L. coryniformis were isolated in addition to L. pentosus, and previous studies reported the isolation of the same bacteria from Awa-bancha (Sato et al., 2019; Nishioka et al., 2020). L. pantheris was previously isolated from Ishizuchi-kurocha and Miang and L. coryniformis from Miang (Chaikaew et al., 2017; Horie et al., 2019b). In the samples of producer B, L. pentosus was the most frequently isolated, followed by L. plantarum. Only L. pentosus was isolated from producers C and D. In the case of the tea of producer E, L. brevis, L. coryniformis, S. collinoides, L. mesenteroides, and L. mudanjiangensis were isolated in addition to L. plantarum. L. brevis is frequently isolated from Ishizuchi-kurocha and occasionally from Awa-bancha (Horie et al., 2019b; Nishioka et al., 2020). L. mesenteroides has been isolated from Awa-bancha and Miang (Chaikaew et al., 2017; Sato et al., 2019). L. mudanjiangensis was not previously isolated from Awa-bancha or other post-fermented teas and was identified for the first time in the present study. L. paraplantarum, which has not previously been isolated from Awa-bancha or other post-fermented teas, was isolated from producer F.
Lactiplantibacillus spp. was dominant in the bacterial flora analysis of tea from most producers. A previous study reported that the microorganisms involved in the fermentation of Awa-bancha were selected by the polyphenols contained in tea leaves as a control factor (Uchino et al., 2020). The bacterial flora differed for each producer. Acetobacter spp. were more abundant in lots 2 and 3 of producer A than in the samples from other producers. Producer C has a large proportion of Klebsiella spp. The results from producer E were dominated by Leuconostoc spp. and Lactococcus spp., but not Lactiplantibacillus spp. The components of the leaves after anaerobic fermentation were similar among producers. Lactic acid was detected by an organic acid analysis in the samples of most producers. Lactic acid is produced by lactic acid bacteria, such as Lactiplantibacillus spp. On the other hand, in lot 2 of producer A, more acetic acid was detected than lactic acid, which may have been due to the bacterial flora analysis of lot 2 from producer A detecting more Acetobacter spp. than in the samples from the other producers. Since Acetobacter spp. is an aerobic bacterium, air may have been present during fermentation. Therefore, organic acids, such as lactic acid and acetic acid, are expected to produce the acidity in Awa-bancha. The analysis of catechins showed that EGC was the most abundant in the tea from many producers, followed by EGCg. Catechins contribute to the astringent taste of Awa-bancha and also exert antioxidant effects (Hara, 2000). EGCg in tea leaves was previously shown to be hydrolyzed to EGC and gallic acid by lactic acid bacteria with tannase activity (Osawa et al., 2000). Free catechins have also been reported to be less astringent than gallate catechins and are efficiently absorbed into the intestinal tract (Henning et al., 2005). An analysis of free amino acids detected large amounts of theanine and glutamic acid. Theanine enhances the flavor of other umami components (Narukawa et al., 2008) and has also been reported to improve sleep and relaxation (Kobayashi et al., 1998; Ozeki et al., 2004). Glutamic acid is regarded as an umami component of tea. In addition, more γ-aminobutyric acid was detected in the tea of producer E than in that of the other producers. This component has health benefits, such as promoting relaxation (Abdou et al., 2006), which may be related to the isolation of L. brevis, a high producer of γ-aminobutyric acid, from the samples of producer E. (Yokoyama et al., 2002; Mori et al., 2007). In the present study, the lactic acid bacteria involved in the fermentation of Awa-bancha were dominated by Lactiplantibacillus spp., mainly L. pentosus and L. plantarum, among most producers. The components produced by these lactic acid bacteria were considered to significantly contribute to the flavor of Awa-bancha. The quality of Awa-bancha is improved by preparing an optimal environment for lactic acid bacteria. For example, it is important to prevent air from entering during anaerobic fermentation. Therefore, lactic acid bacteria appear to affect the components of Awa-bancha; however, there were also contradictions. For example, L. brevis was not isolated from lots 1 and 2 of producer A, whereas γ-aminobutyric acid was abundant. In addition, in the bacterial flora after anaerobic fermentation, producer B had a higher proportion of Lactiplantibacillus spp. than other producers, whereas the amount of lactic acid and total amount of organic acid were not high. Collectively, the present results suggest diversity in the lactic acid bacteria and components of Awa-bancha among different producers; however, the relationship between them remains unclear. Further studies are warranted to elucidate the mechanisms by which lactic acid bacteria and production conditions affect the components of Awa-bancha.
Citation
Nishioka, H., Ohno, T., Iwahashi, H., and Horie, M. (2021) Diversity of Lactic Acid Bacteria Involved in the Fermentation of Awa-bancha. Microbes Environ 36: ME21029.
https://doi.org/10.1264/jsme2.ME21029
Acknowledgements
We would like to thank Ms. Yukiko Miyaguchi (Miyaguchi-en, Naka, Tokushima, Japan), Mr. Isao Takeichi (Kamikatsu, Tokushima, Japan), Ms. Masako Okada (Miyoshi, Tokushima, Japan), Mr. Daichi Hyakuno (Kamikatsu-TeaMate, Kamikatsu, Tokushima, Japan), Ms. Machiko Nakashima (Yamashiro Tea Association, Miyoshi, Tokushima, Japan), and Mr. Keitaro Ikawa (Ikawahakko, Naka, Tokushima, Japan) for providing Awa-bancha and Mr. Shinobu Shinozuka (Visee, Saijo, Ehime, Japan) for providing Ishizuchi-kurocha. We would also like to thank Mr. Nobuyuki Kondo (Miyoshi Agricultural Support Center, Miyoshi, Tokushima, Japan) for introducing the producers of Awa-bancha.
References
- Abdou, A.M., Higashiguchi, S., Horie, K., Kim, M., Hatta, H., and Yokogoshi, H. (2006) Relaxation and immunity enhancement effects of γ‐Aminobutyric acid (GABA) administration in humans. BioFactors
26: 201–208.
- Bokulich, N.A., Kaehler, B.D., Rideout, J.R., Dillon, M., Bolyen, E., and Knight, R., et al. (2018) Optimizing taxonomic classification of marker-gene amplicon sequences with QIIME 2's q2-feature-classifier plugin. Microbiome
6: 90.
- Bolyen, E., Rideout, J.R., Dillon, M.R., Bokulich, N.A., Abnet C.C., Al-Ghalith, G.A., et al. (2019) Reproducible, interactive, scalable and extensible microbiome data science using QIIME 2. Nat Biotechnol
37: 852–857.
- Bringel, F., Castioni, A., Olukoya, D.K., Felis, G.E., Torriani, S., and Dellaglio, F. (2005) Lactobacillus plantarum subsp. argentoratensis subsp. nov., isolated from vegetable matrices. Int J Syst Evol Microbiol
55: 1629–1634.
- Callahan, B.J., McMurdie, P.J., Rosen, M.J., Han, A.W., Johnson, A.J., and Holmes, S.P. (2016) DADA2: High-resolution sample inference from Illumina amplicon data. Nat Methods
13: 581–583.
- Chaikaew, S., Baipong, S., Sone, T., Kanpiengjai, A., Chui-Chai, N., Asano, K., et al. (2017) Diversity of lactic acid bacteria from Miang, a traditional fermented tea leaf in northern Thailand and their tannin-tolerant ability in tea extract. J Microbiol
55: 720–729.
- Chen, S., Zhou, Y., Chen, Y., and Gu, J. (2018) fastp: an ultra-fast all-in-one FASTQ preprocessor. Bioinformatics
34: i884–i890.
- Fukushiyama, E., and Tain, O. (2009) Survey study of pickled tea: Laphet. Bulletin of Kagoshima Women’s College
44: 31–41 (in Japanese).
- Guo, W., Lu, Y., Luo, S., and Sakata, K. (2004) Dark tea—a tea made via microbial fermentation process. Nippon Shokuhin Kagaku Kogaku Kaishi
51: 323–331 (in Japanese).
- Hara, Y. (2000) Tea catechins: functions and applications. Food Preserv Sci
26: 47–54.
- Henning, S.M., Niu, Y., Liu, Y., Lee, N.H., Hara, Y., Thames, G.D., et al. (2005) Bioavailability and antioxidant effect of epigallocatechin gallate administered in purified form versus as green tea extract in healthy individuals. J Nutr Biochem
16: 610–616.
- Hirayama, Y., and Endo, A. (2016) Taxonomy of lactic acid bacteria up-to-date and minimal standards for description of new taxa of lactic acid bacteria recommended by subcommittee on the taxonomy of Bifidobacterium, Lactobacillus and related organisms. J Intest Microbiol
30: 17–28.
- Horie, M., Nishioka, H., Tada, A., Sugino, S., Mizuno, T., Toyotome, T., et al. (2019a) Microorganisms involved in fermentation of Batabata-cha. J Jpn Soc Taste Technol
18: 62–70 (in Japanese).
- Horie, M., Tada, A., Kanamoto, N., Tamai, T., Fukuda, N., Sugino, S., et al. (2019b) Evaluation of lactic acid bacteria and component change during fermentation of Ishizuchi‐kurocha. J Food Process Preserv
43: e14186.
- Horie, M., Ruengsomwong, S., and Wannissorn, B. (2020) Field research for production method of Miang: post-fermented tea in Thailand. Jpn J Food Eng
21: 125–137.
- Huang, C.H., Lee, F.L., and Liou, J.S. (2010) Rapid discrimination and classification of the Lactobacillus plantarum group based on a partial dnaK sequence and DNA fingerprinting techniques. Antonie van Leeuwenhoek
97: 289–296.
- Huang, M.L., Huang, J.Y., Kao, C.Y., and Fang, T.J. (2018) Complete genome sequence of Lactobacillus pentosus SLC13, isolated from mustard pickles, a potential probiotic strain with antimicrobial activity against foodborne pathogenic microorganisms. Gut Pathog
10: 1.
- Kato, M., Tamura, A., Mizooti, Y., Omori, M., Nanba, A., and Miyagawa, K. (1993) Changes of flavor during manufacturing process of Japanese fermented tea (Awa-bancha) and its characteristic. J Home Econ Jpn
44: 561–565 (in Japanese with an English abstract).
- Kato, M., Tamura, A., Omori, M., Nanba, A., Miyagawa, K., Nishimura, O., et al. (1994) Changes of flavor during manufacturing process of Japanese fermented tea (Goishi-cha) and its characteristic. J Home Econ Jpn
45: 527–532 (in Japanese with an English abstract).
- Kato, M., Tamura, A., Saitou, H., Omori, M., Nanba, A., and Miyagawa, K. (1995) Changes of flavor during manufacturing process of Japanese fermented tea (Ishizuchi-kurocha) and its characteristic. J Home Econ Jpn
46: 525–530 (in Japanese with an English abstract).
- Kleerebezem, M., Boekhorst, J., Kranenburg, R., Molenaar, D., Kuipers, O.P., Leer, R., et al. (2003) Complete genome sequence of Lactobacillus plantarum WCFS1. Proc Natl Acad Sci U S A
100: 1990–1995.
- Klindworth, A., Pruesse, E., Schweer, T., Peplies, J., Quast, C., Horn, M., et al. (2013) Evaluation of general 16S ribosomal RNA gene PCR primers for classical and next-generation sequencing-based diversity studies. Nucleic Acids Res
41: e1.
- Kobayashi, K., Nagato, Y., Aoi, N., Juneja, L.R., Kim, M., Yamamoto, T., et al. (1998) Effects of L-Theanine on the release of α-brain waves in human volunteers. Nippon Nogei Kagaku Kaishi
72: 153–157 (in Japanese with an English abstract).
- Lane, D.J. (1991) 16S/23S rRNA sequencing. In Nucleic Acid Techniques in Bacterial Systematics. Stackebrandt, E., and Goodfellow, M. (eds). New York, NY: John Wiley & Sons, pp. 115–175.
- Miyagawa, K. (1994) Post-fermented tea. In Japanese Post-fermented Tea. Relationship with China and Southeast Asia. Miyagawa, K. (ed.) Kyoto, Japan: Sannei-syuppan, pp. 7–10 (in Japanese).
- Miyazaki, E., and Nakanishi, K. (2007) Various component analysis during manufacturing process of Awa-bancha made in spring. Report of Tokushima Prefectural Industrial Technology Center
16: 37–40 (in Japanese).
- Mori, H., Watanabe, K., and Isono, Y. (2007) Isolation of a lactic acid bacterium, Lactobacillus brevis mh4219, producing high level of γ-aminobutyric acid (GABA) in tea extract and stress reducing effect of cultured tea beverage containing GABA. Seibutsu Kogaku Kaishi
85: 521–526 (in Japanese with an English abstract).
- Nakagawa, H. (1979) A custom of tea-drinking (Batabata-cha) in Birudan Toyama prefecture. Cookery Sci
12: 246–251.
- Narukawa, M., Morita, K., and Hayashi, Y. (2008) L-Theanine elicits an umami taste with inosine 5′-monophosphate. Biosci Biotechnol Biochem
72: 3015–3017.
- Nishioka, H., Mizuno, T., Iwahashi, H., and Horie, M. (2020) Changes in lactic acid bacteria and components of Awa-bancha by anaerobic fermentation. Biosci Biotechnol Biochem
84: 1921–1935.
- Niwa, R., Syaputri, Y., Horie, M., and Iwahashi, H. (2020) Draft genome sequence of Lactobacillus plantarum IYO1511, isolated from Ishizuchi-kurocha. Microbiol Resour Announce
9: e00143-20.
- Okada, S., Takahashi, N., Ohara, N., Uchimura, T., and Kozaki, M. (1996) Microorganisms involving in fermentation of Awa-bancha, Japanese fermented tea leaves. Nippon Shokuhin Kagaku Kogaku Kaishi
43: 12–20 (in Japanese with an English abstract).
- Okada, S. (2002) The world of plant origin lactic acid bacteria. Jpn J Lactic Acid Bact
13: 23–26 (in Japanese with an English abstract).
- Osawa, R., Kuroiso, K., Goto, S., and Shimizu, A. (2000) Isolation of tannin-degrading Lactobacilli from humans and fermented foods. Appl Environ Microbiol
66: 3093–3097.
- Ozeki, M., Juneja, LR., and Shirakawa, S. (2004) The effects of L-theanine on sleep using the actigraph. Jpn J Physiol Anthropol
9: 143–150.
- Parente, E., Ciocia, F., Ricciardi, A., Zotta, T., Felis, G.E., and Torriani, S. (2010) Diversity of stress tolerance in Lactobacillus plantarum, Lactobacillus pentosus and Lactobacillus paraplantarum: A multivariate screening study. Int J Food Microbiol
144: 270–279.
- Quast, C., Pruesse, E., Yilmaz, P., Gerken, J., Schweer, T., Yarza, P., et al. (2013) The SILVA ribosomal RNA gene database project: improved data processing and web-based tools. Nucleic Acids Res
41: D590–D596.
- Sato, T., Fujii, M., Arai, S., Komahara, D., Takeda, M., Hasegawa, A., et al. (2019) Comparison of bacterial diversity among the Awa bancha tea leaves produced at Miyoshi city and Tokushima prefecture. Proceedings of Awagakkai
62: 179–188 (in Japanese).
- Torriani, S., Felis, G.E., and Dellaglio, F. (2001) Differentiation of Lactobacillus plantarum, L. pentosus, and L. paraplantarum by recA gene sequence analysis and multiplex PCR assay with recA gene-derived primers. Appl Environ Microbiol
67: 3450–3454.
- Uchino, M., Koyama, S., and Takano, K. (2020) Microorganism and polyphenol in post fermented tea, Awabancha produced in Tokushima prefecture. Food Preserv Sci
46: 63–69.
- Yilmaz, P., Parfrey, L.W., Yarza, P., Gerken, J., Pruesse, E., Quast, C., et al. (2014) The SILVA and “All-species Living Tree Project (LTP)” taxonomic frameworks. Nucleic Acids Res
42: D643–D648.
- Yokoyama, S., Hiramatsu, J., and Hayakawa, K. (2002) Production of gamma-aminobutyric acid from alcohol distillery lees by Lactobacillus brevis IFO-12005. J Biosci Bioeng
93: 95–97.