Abstract
The collapse of Comamonas testosteroni R2 under chemostat conditions and the aerobic growth of strain R2 under batch conditions with phenol as the sole carbon source were investigated using physiological and transcriptomic techniques. Phenol-/catechol-degrading activities under chemostat conditions gradually decreased, suggesting that metabolites produced from strain R2 accumulated in the culture, which caused negative feedback. The competitive inhibition of phenol hydroxylase and catechol dioxygenase was observed in a crude extract of the supernatant collected from the collapsed culture. Transcriptomic analyses showed that genes related to nitrogen transport were up-regulated; the ammonium transporter amtB was up-regulated approximately 190-fold in the collapsed status, suggesting an increase in the concentration of ammonium in cells. The transcriptional levels of most of the genes related to gluconeogenesis, glycolysis, the pentose phosphate pathway, and the TCA and urea cycles decreased by ~0.7-fold in the stable status, whereas the activities of glutamate synthase and glutamine synthetase increased by ~2-fold. These results suggest that ammonium was assimilated into glutamate and glutamine via 2-oxoglutarate under the limited supply of carbon skeletons, whereas the synthesis of other amino acids and nucleotides was repressed by 0.6-fold. Furthermore, negative feedback appeared to cause an imbalance between carbon and nitrogen metabolism, resulting in collapse. The effects of amino acids on negative feedback were investigated. L-arginine allowed strain R2 to grow normally, even under growth-inhibiting conditions, suggesting that the imbalance was corrected by the stimulation of the urea cycle, resulting in the rescue of strain R2.
It has been challenging to understand the principles by which microbial communities are formed (Fernandez et al., 1999, 2000; Haruta et al., 2013; El-Chakhtoura et al., 2015). Microbial diversity, the functional stability of whole systems, and the coexistence of different microbes (Aziz et al., 2015; Azwani et al., 2021) are important features of microbial ecosystems and are relevant to the mechanisms by which they are formed. The functional stability of microbial communities is important for agricultural production, wastewater treatment, bioremediation, human health, and ecosystems, and is based on metabolic processes in response to changing environmental conditions.
Real microbial ecosystems are too complex to analyze because of intertwined relationships based on the functional diversity of the microbial world. Therefore, more simple and controllable systems, known as synthetic bacterial communities (SBCs), are needed. SBCs have increasing become the focus of research in recent years due to the reduced complexity of natural ecosystems and increased controllability (Haruta et al., 2002; Kato et al., 2005; Narisawa et al., 2008; De Roy et al., 2014; He et al., 2014; Mee et al., 2014; Aziz et al., 2015; Friedman et al., 2017; Haruta and Yamamoto, 2018). In our previous study, the SBC constructed with phenol-degrading bacteria, Pseudomonas sp. strain LAB-08, Cupriavidus sp. strain P-10, and Comamonas testosteroni strain R2, showed functional stability with coexistence under chemostat conditions for more 800 days, and this was predicted to be dependent on a metabolic networking system (Azwani et al., 2021).
Metabolic networking systems are attracting the attention of researchers interested in the mechanisms by which microbial ecosystems are formed (Freilich et al., 2011; Morris et al., 2013; Cao et al., 2018; Hsu et al., 2019). Interspecies interactions are considered to be relevant to the formation of metabolic networks. The supernatants of microbial cultures may affect the metabolic processes of other microbes (Tanaka et al., 2005; Tashiro et al., 2013; Inaba et al., 2015), in which microbial metabolites play major roles in positive (Christensen et al., 2002) and negative interactions (Kim and Copley, 2012). In our efforts to clarify the coexisting mechanisms of three strains, LAB-08, P-10, and R2, we found a unique phenomenon. A pure culture of strain R2 suddenly collapsed under chemostat conditions supplied with phenol as the sole carbon and energy source, even though strain R2 has a complete set of genes relevant to phenol-utilizing metabolism for the conversion of phenol to acetyl-CoA (Powlowski and Shingler, 1994; Azwani et al., 2017) and grew and completely degraded phenol under aerobic batch conditions with phenol as the sole carbon and energy source (Watanabe et al., 1996; Futamata et al., 2001a). These findings suggest that the three strains coexist through mutualistic interactions. Therefore, analyses of the collapsing process occurring in strain R2 will provide insights into coexisting mechanisms, how the metabolic network is formed, and how to manage microbes.
The aims of the present study were to analyze collapsing processes using physiological and transcriptomic techniques and to develop a method that rescues strain R2 from collapse. Physiological analyses indicated that collapse was induced by feedback growth inhibition, which had already been initiated under stable conditions. The transcriptomic analysis showed that the activities of primary metabolism decreased by approximately 60 to 70% of stable conditions. An imbalance between carbon and nitrogen metabolism appeared to occur due to a decrease in the supply of carbon skeletons and an increase in ammonium influx into cells. We herein also discuss how strain R2 responded to negative feedback, the mechanisms underlying the imbalance in carbon and nitrogen metabolism in cells, and how strain R2 was rescued from collapse.
Materials and Methods
Bacterium and culture conditions
The phenol-degrading bacterium C. testosteroni strain R2 was used in the present study. Strain R2 was isolated from activated sludge in wastewater treatment at an oil refinery plant (Watanabe et al., 1996). Strain R2 was precultured at 25°C in BSM medium supplemented with phenol at 2.0 mM (BSM2.0phe medium) under aerobic and batch conditions (Futamata et al., 2001a). The medium contained the following (L–1): 12.5 g K2HPO4, 3.8 g KH2PO4, 1.0 g (NH4)2SO4, 0.1 g MgSO4·7H2O, and 5 mL of trace-element solution (pH 7.2). The trace-element solution contained the following (L–1): 0.232 g H3BO3, 0.174 g ZnSO4·7H2O, 0.116 g Fe(NH4)2(SO4)2·6H2O, 0.096 g CoSO4·7H2O, 0.022 g (NH4)6Mo7O24·4H2O, 8 mg CuSO4·5H2O, and 8 mg MnSO4·4H2O. Cultures were harvested at the mid-exponential growth phase and then transferred to 1.5 L of BSM medium containing 0.2 mM of phenol in a chemostat reactor (capacity of 2 L). The initial cell density of strain R2 was adjusted to approximately 1.0×10⁵ cells mL–1 by measuring optical density at 600 nm (OD600 nm). OD600 nm of 0.1 corresponded to 5.0×10⁸ cells mL–1. After the added phenol had almost been completely degraded (the start-up phase), the chemostat culture was continuously supplied with BSM medium containing phenol (1,500 mg L–1) at a flow rate of 6.25 mL h–1, which corresponded to a dilution rate (D) of 0.1 day–1 (6.25 mL h–1×24 h/1,500 mL). The culture volume was maintained at 1.5 L. The hydraulic residence time (HRT), calculated as 1/D, was 10 days. The culture was stirred at 150 rpm, and temperature and pH were maintained at 25°C and 7.0, respectively. Air was filtered through membrane filters with a pore size of 0.2 μm (Merck Millipore) and supplied to the culture at 1.5 L min–1. Phenol in the culture was checked using a colorimetric assay with the Phenol Test Wako kit (FUJIFILM Wako Pure Chemical) (Futamata et al., 2001b), which has a detection limit of approximately 1.0 μM. One milliliter of the cell suspension was taken from the chemostat culture and centrifuged at 5,800×g at 4°C for 5 min. The pellet was resuspended in 1 mL of 0.85% NaCI solution (w/v). The sample was incubated at room temperature for 15 min in the dark to stain cells with the LIVE/DEAD® BacLightTM bacterial viability kit L7007 (Molecular Probes) according to the manufacturer’s instructions. Samples were analyzed using the fluorescence microscope Olympus IX73 (Olympus). Stained cells were counted using ImageJ software. Cell viability was calculated as the percentage of live cells among the total cell number.
Relative growth activity
The effects of feedback growth inhibition on strain R2 were investigated using a supernatant collected from a pure chemostat culture and evaluated as specific growth activity. Growth curves were recorded to estimate the physiological changes that occurred after the addition of the supernatant. Strain R2 was incubated in BSM medium under the conditions of the chemostat culture supplemented with phenol as the sole carbon source. The culture was sampled and centrifuged at 5,800×g at 4°C with adequate intervals. The supernatant was sterilized by filtration through a Steriflip-GP Filter (pore size of 0.22 μm, Millipore). Strain R2 was precultured in BSM medium supplemented with 2.0 mM phenol (BSM2.0phe) and 0.3 mL of filter-sterilized supernatant were transferred into 2.7 mL of fresh BSM2.0phe medium. The initial amount of cells was adjusted to OD600 nm of 0.01. As the control condition, 0.3 mL of BSM medium without phenol was added instead of the supernatant. The growth curve was automatically measured using a Bio-photorecorder (TVS062CA, ADVANTEC). Growth parameters, including the lag time (h), growth rate constant (μ [h–1]), and amount of growth in the stationary phase (ODmax), were calculated using the growth curve. We herein defined specific growth activity as surviving activity maintaining cell density at more than 1.0×10⁹ cells mL–1 in a chemostat culture under the condition of D. Therefore, 1 unit (U) of specific growth activity was calculated using the following equation: 1 U=0.105 (h–1)×109 (cells mL–1) under HRT of 10 days. As described above, the cell density of strain R2 was 5.0×10⁸ cells mL–1 at an OD600 nm of 0.1. ODmax was then converted to cell density. The unit of specific growth activity was calculated according to the following equation: U=(μ×cell density from ODmax)/(1 U×lag time) (Aziz et al., 2015). The proportion of U in the presence of the supernatant (Usup) to U in the control condition (Ucont) was calculated as relative growth activity (%).
Real-time quantitative PCR (qPCR)
The population density of strain R2 was monitored using real-time qPCR targeting the gene encoding the large subunit of phenol hydroxylase (PH). Specific sets of primers were designed by the alignment of genes encoding the large subunit of PH in strain R2 (Azwani et al., 2021). A specific PCR product amplified with a specific primer set was used as the standard DNA fragment in the qPCR analysis. To monitor strain R2, the qPCR profile consisted of preheating at 95°C for 10 min, followed by 40 cycles of denaturation at 95°C for 10 s, annealing at 63°C for 5 s, and extension at 72°C for 15 s. The fluorescence signal was detected at 72°C in each cycle, and a melting curve was obtained by heating the product to 95°C and cooling to 40°C. The reaction was performed using a LightCycler FastStart DNA Master SYBR Green I kit (Roche Molecular Biochemicals) and a LightCycler system (Roche Diagnostics) according to the manufacturer’s instructions. The copy number of each amplicon was calculated using LightCycler software version 3.52. The copy number of the amplicon was equal to the cell number because only one copy of the PH gene was present in all strains (Azwani et al., 2017).
Kinetic analysis
A kinetic analysis was conducted to investigate the effects of metabolites on phenol- and catechol-degrading activities. Strain R2 was grown in a chemostat reactor with BSM medium and phenol as the sole carbon and energy source (R2-chemostat), and the kinetic properties of strain R2 for phenol and catechol degradation were investigated using the culture on days 18, 25, 30, and 35 according to a previously described method (Futamata et al., 2001a; Haruta et al., 2013). When the accumulation of phenol and a decrease in OD600 nm were observed in the R2-chemostat, we considered the system to be collapsed. In total, 1.5 L of the culture was collected from the collapsed R2-chemostat and centrifuged at 5,800×g at 4°C. The supernatant was treated with the same volume of hexane, ethyl acetate, butanol, and dH2O. Organic solvent fractions were concentrated to approximately 60 mL using a rotary evaporator (Buchi Rotavapor R3) under vacuum conditions (Buchi V-700) at 40°C. The H2O fraction was mixed with methanol at a ratio of 1:3 and kept overnight at 4°C. The solution was then centrifuged at 5,800×g at 4°C and filtered (0.2 μm PTFE Membrane, OmnipureTM, Merck Millipore) to remove precipitates. The H2O fraction was concentrated to approximately 60 mL by evaporating methanol using the rotary evaporator under vacuum conditions at 40°C. When the effects of the H2O fraction on kinetic parameters were investigated, the culture of strain R2 and the H2O fraction were mixed at a ratio of 9:1 for 30 min. Phenol- and catechol-oxygenating activities (the phenol and catechol consumption rates) were measured at various phenol and catechol concentrations, respectively, using an oxygen electrode (DO METER TD-51, Toko Chemical Lab.) after respiratory oxygen consumption had been suppressed by the addition of potassium cyanide (Watanabe et al., 1996). Kinetic parameters were calculated using the initial phenol-oxygenating velocities at more than 10 different substrate concentrations. Data were fit to the Michaelis-Menten or Haldane equation (Folsom et al., 1990; Watanabe et al., 1998; Futamata et al., 2005) using JMP statistical visualization software (SAS Institute). The apparent kinetic constants, KS (affinity constant) and Vmax (theoretical maximum activity) were assessed using the non-linear regression method as previously described (Azwani et al., 2021). As reported by Folsom et al. (1990), the term KS was employed instead of Km because activity was measured using intact cells rather than purified enzymes.
Transcriptomic analysis
A transcriptomic analysis was conducted to analyze contributing factors to the change from a stable to collapsed status in strain R2. Strain R2 was incubated in new chemostat cultures, reactors I and II, until collapse and cells were collected on days 17 (sample I-1), 22 (I-2), 30 (I-3), 31 (I-4), and 32 (I-5) from reactor I and on days 15 (sample II-1), 20 (II-2), 23 (II-3), 25 (II-4), and 28 (II-5) from reactor II (Supplementary Fig. S1). In the present study, samples I-1 and II-1 were defined as a stable status under which phenol did not accumulate and the population density was maintained, while samples I-5 and II-5 were defined as a collapsed status under which phenol accumulated. The library preparation and RNA sequencing of strain R2 were performed by Macrogen. The total RNA of strain R2 cultivated under chemostat conditions was extracted using the SV Total RNA Isolation System (Promega). The removal of ribosomal RNA molecules from total RNA was performed using the NEBNext rRNA Depletion Kit (Bacteria) (New England Biolabs) and strand-specific RNA sequencing libraries were prepared using TruSeq Stranded Total RNA Library Prep Gold (Illumina). Libraries were sequenced on NovaSeq 6000 (Illumina) to generate 2×101-bp paired-end sequence reads. Raw reads were cleaned using Trimmomatic ver. 0.36 by trimming adapter sequences, the base at the 3′-end, low-quality ends (quality score, <15), and dropping out reads of less than 75 bp (Bolger et al., 2014). The resulting high-quality reads were aligned to the genome sequence of strain R2 (GenBank accession number BDQJ00000000.1) using HISAT2 ver. 2.1.0 with options --dta and --no-spliced-alignment (Kim et al., 2019). Read counts were calculated from BAM files using featureCounts ver. 2.0.0 (Liao et al., 2014) and transcripts per million (TPM) values were calculated to normalize gene lengths and total read counts. The differentially expressed genes (DEGs) of strain R2 in the stable and collapsed statuses (I-1 vs I-5, and II-1 vs II-5) were analyzed using edgeR package ver. 3.16.4 (Robinson et al., 2010). Read counts for genes were filtered by removing genes with low expression levels with a count per million (CPM) value of less than 2, and were normalized with scaling factors calculated for the library sizes using the Trimmed Mean of M-values (TMM) method (Robinson and Oshlack, 2010; Robinson et al., 2010). DEGs were defined by a log2 fold-change (log2FC) ≥2 (up-regulated) or ≤–2 (down-regulated) and a false discovery rate (FDR) <0.05. Raw reads for RNA-seq analyzed in the present study have been deposited in the DDBJ Sequence Read Archive (DRA) under the accession numbers DRR309243 to DRR309247 and DRR309248 to DRR209252 for samples I-1 to II-5, respectively (Supplementary Table S1).
Growth of strain R2 in the presence of amino acids
We investigated whether the growth inhibition of strain R2 was rescued by the following amino acids: L-arginine, L-ornithine, L-citrulline, L-glutamate, and L-glutamine, because these amino acids are directly and indirectly related to the urea cycle. L-arginine, L-ornithine, and L-citrulline consisting of the urea cycle, and L-glutamate and L-glutamine are precursors for L-citrulline. Strain R2 cells precultured in BSM2.0phe liquid culture and 0.4 mL of filter-sterilized supernatant collected from collapsed chemostat cultures were transferred into 3.6 mL of fresh BSM2.0phe medium. The initial amount of cells was adjusted to 0.01 at OD600 nm. A stock solution of amino acids (200 mM) was prepared in BSM medium and the filter-sterilized stock solution was added at a final concentration of 10 mM. As the control condition, 0.4 mL of BSM medium without phenol was added instead of the supernatant and amino acid solution. The growth curve was automatically measured using a Bio-photorecorder (TVS062CA, ADVANTEC). Growth parameters, including the lag time (h), growth rate constant (μ [h–1]), and the amount of growth in the stationary phase (ODmax), were calculated using the growth curve. As described above in the section on relative growth activity, the unit of specific growth activity (U) was calculated in the presence of phenol and an amino acid as a control (Uamino acid) or in the presence of phenol, the amino acid, and the supernatant (Uamino acid+supernatant). The negative growth effect (%) was calculated using the following equation:
(1–Uamino acid⁄Uamino acid+supernatant)×100.
Scanning electron microscopy (SEM) observations
SEM was used to observe the morphology of C. testosteroni strain R2 on days 18 and 38 in the chemostat culture. Samples were fixed with a mixed solution of 25% (v/v) glutaraldehyde and 5% (v/v) formaldehyde for 2 h in potassium phosphate buffer (0.2 M, pH 7.0) and dehydrated with ethanol with serially increasing concentrations (30, 50, 75, 95, and 99.5% of ethanol for 15 min each) and then with 100% of butyl alcohol. The sample was mounted on an aluminium stub with double-sided carbon type, and sputter-coated with gold under argon at a thickness of 50 Å in the Quick Auto Coater (SC-701AT, Sanyu Denshi) for 20 s. Following coating, samples were imaged at different magnifications with a field emission scanning electron microscope (Model JSM-6335F, JEOL) at an acceleration voltage of 5 kV and working distance of 5 mm.
Chemical analysis
Phenol and catechol concentrations were monitored using high-pressure liquid chromatography (Waters Japan) equipped with a column (YMC-Triart C18 [150×2 mm], YMC) and UV detector. Liquid samples collected from the chemostat culture were centrifuged and filtered (Millipore LG [pore size of 0.2 μm, diameter of 13 mm], Millipore). Liquid samples were eluted using 50% acetonitrile solution with 20 mM ammonium acetate delivered at 0.1 mL min–1, and elutes were monitored at 210 nm. Phenol and catechol were identified according to their retention times of 7.2 and 5.2 min, respectively. Concentrations were assessed by comparing the peak area with that of the cognate standard sample.
Statistical analysis
DEGs were identified by the likelihood-ratio test implemented in the edgeR package. Other data were analyzed using the Student’s t-test. P=0.05 was considered to be significant.
Results
Collapse of strain R2 growth under chemostat conditions
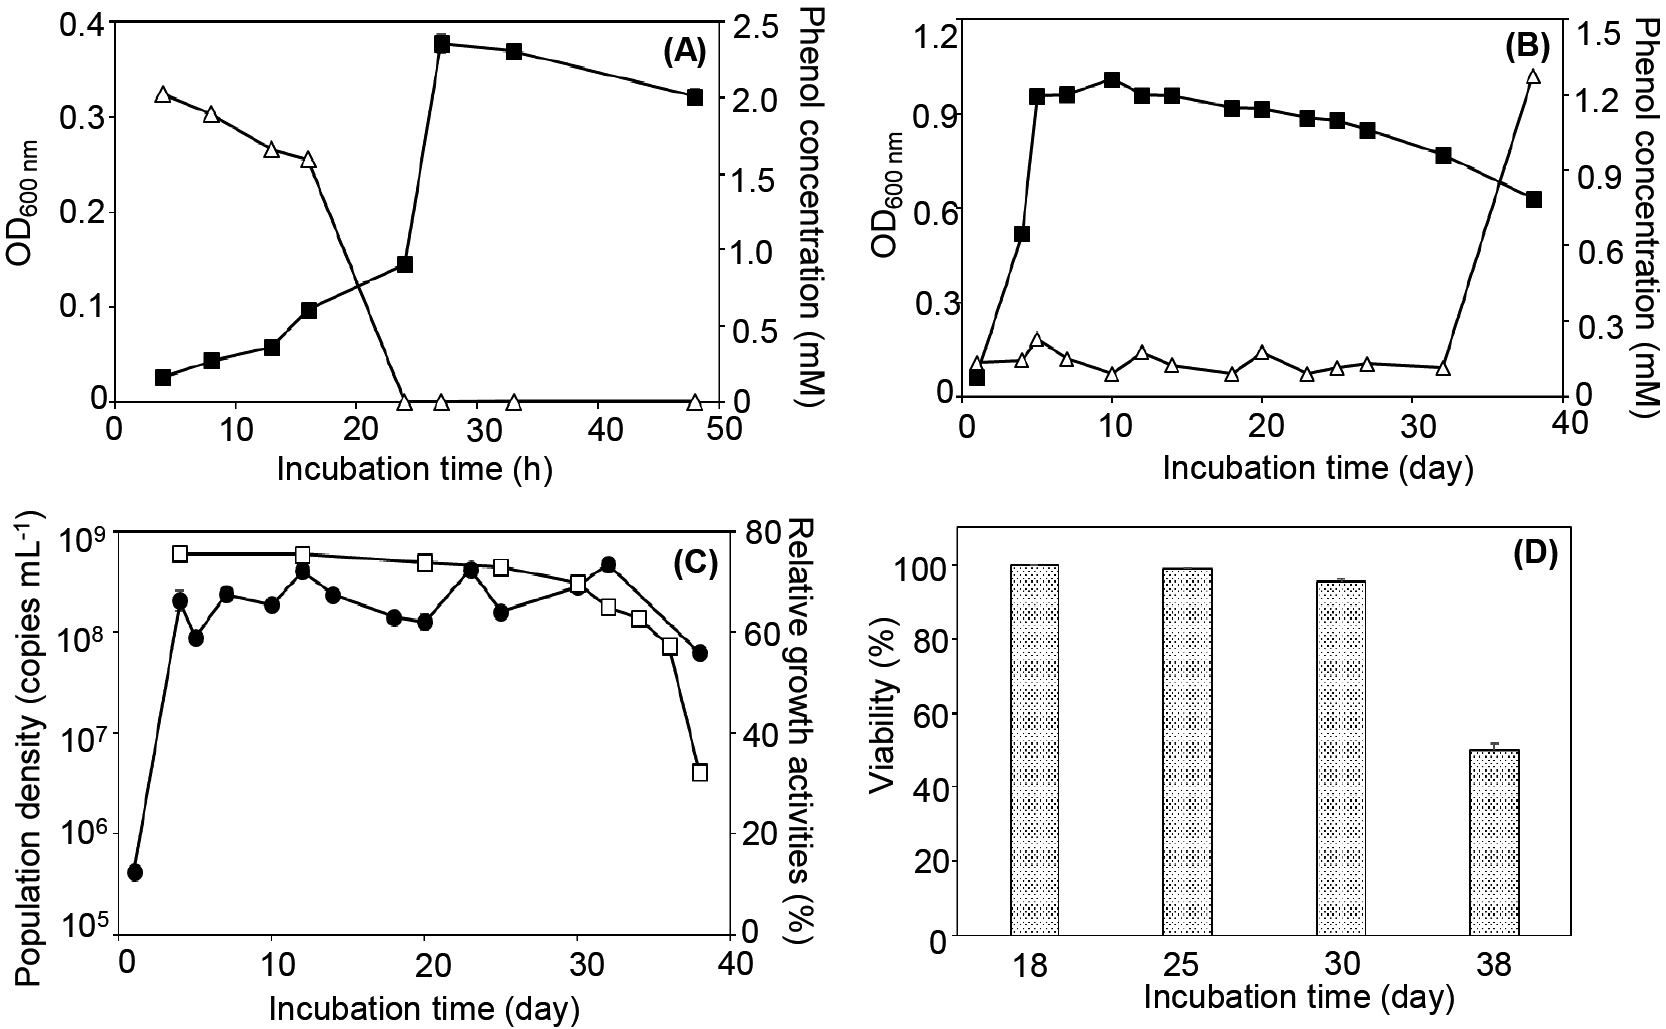
Strain R2 grew aerobically in the presence of phenol as the sole carbon and energy source and completely utilized phenol in batch cultures (Fig. 1A). Catechol, a metabolite produced by PH, was not detected during the experiment (data not shown). In chemostat cultures, the growth amount of strain R2 reached 0.96±0.010 at OD600 nm from days 4 to 14 and then gradually decreased (Fig. 1B). The concentration of phenol was maintained at 0.13±0.010 mM until day 32 and increased to 1.3 mM±0.010 on day 38, namely, the growth of strain R2 collapsed (Fig. 1B). Relative growth activity was stable at 74±0.64% until day 25, after which it rapidly decreased to 32±0.080% on day 38 in the collapsed status (Fig. 1C). The viability of strain R2 cells decreased from 100±0.10% on day 18 to 50±1.8% on day 38 (Fig. 1D). SEM observations showed that the morphology of strain R2 cells changed in the collapsed status (Supplementary Fig. S2).
Effects of the chemostat supernatant on kinetic properties
The kinetic properties of phenol and catechol degradation by strain R2 were investigated using R2-chemostat cultures on days 18, 25, 30, and 35. Vmax for phenol and catechol were 65±6.4 and 130±13 mM [g dry cell]–1, respectively, on day 18, and gradually decreased to 9.4±2.5 and 9.1±0.18 mM [g dry cell]–1, respectively, on day 38 (Fig. 2A and B).
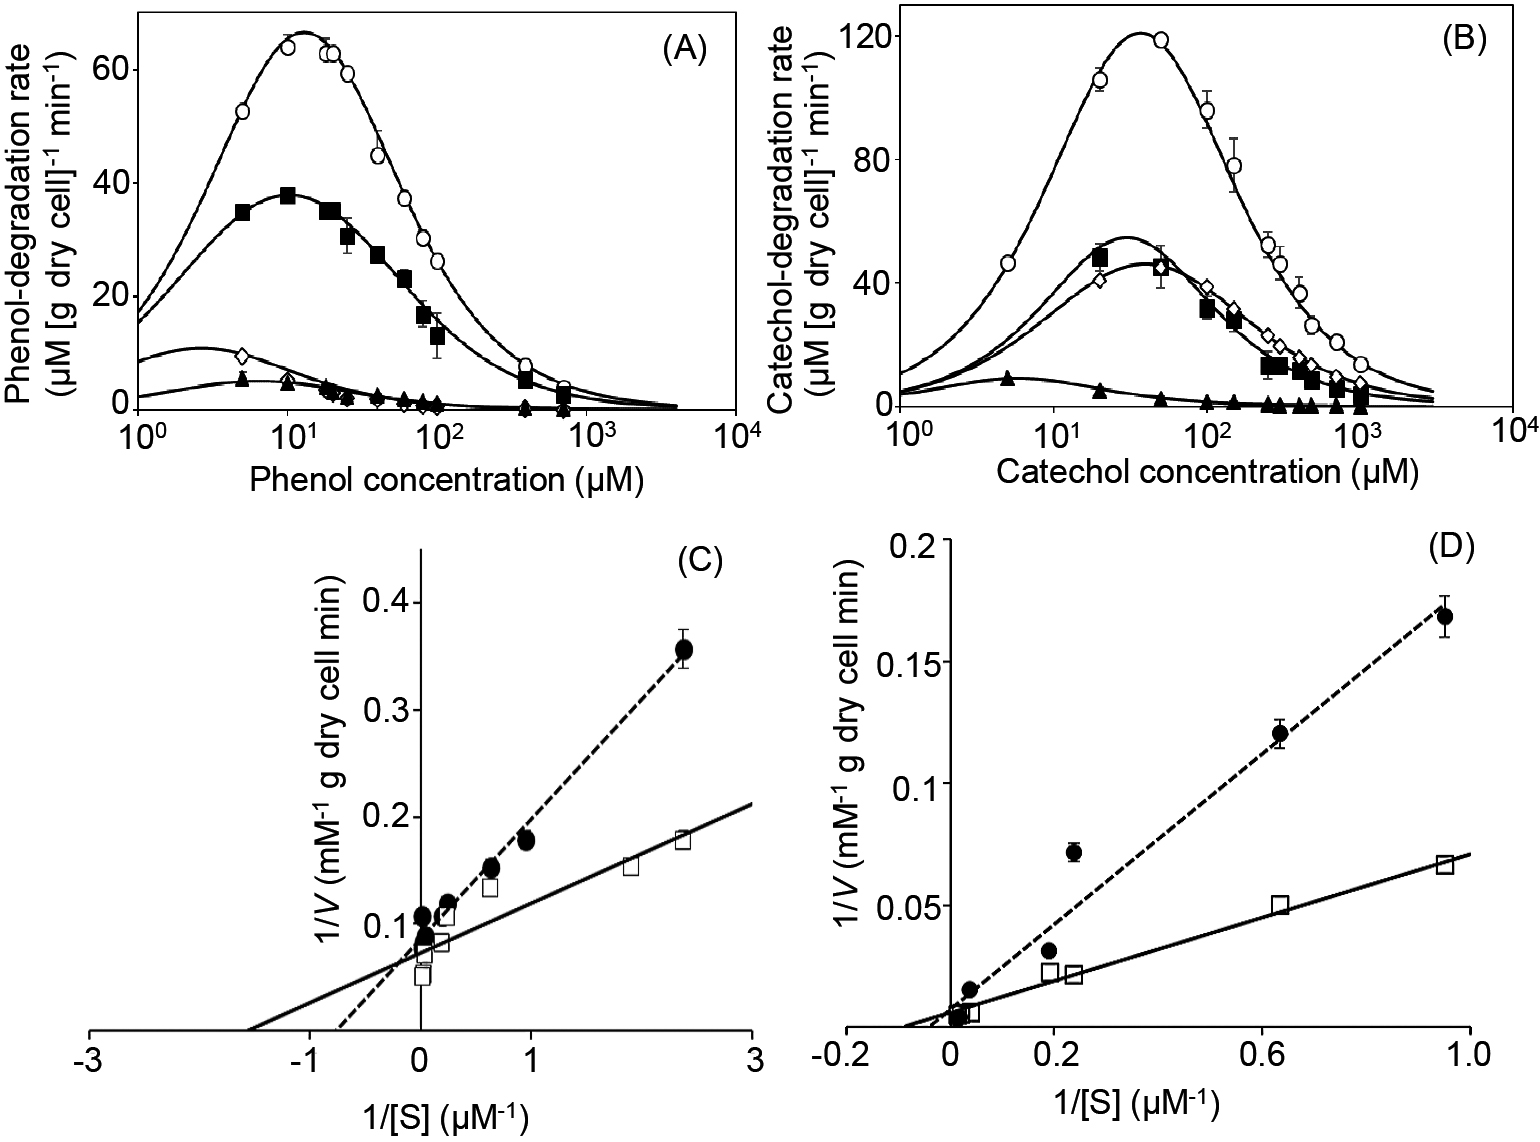
We hypothesized that certain metabolites accumulating in the chemostat culture of strain R2 may be responsible for the collapse of its growth. To clarify this, we investigated the effects of supernatant (SN) collected from chemostat cultures of strain R2 on kinetic parameters for phenol and catechol degradation. As a preliminary test, we fractionated the supernatant using H2O and organic solvents (i.e., hexane, ethyl acetate and butanol) and found that the H2O fraction exerted the strongest negative effects on the relative growth activity of strain R2 (Supplementary Fig. S3). The H2O fraction of supernatant was used to establish whether the activities of PH and catechol dioxygenase were inhibited by metabolites produced from strain R2. Vmax values were not markedly affected, whereas KS values for PH and catechol dioxygenase increased from 0.70±0.050 to 1.3±0.10 μM for phenol and from 14±1.4 to 36±0.70 μM for catechol in the presence of the H2O fraction (Fig. 2C and D).
Change in metabolism from the stable to collapsed status
The results of physiological analyses indicated that the growth collapse of strain R2 under chemostat conditions was triggered by metabolic changes. To elucidate the metabolic shift from the stable to collapsed status, we reproduced two chemostat cultures (namely, reactors I and II) of strain R2 under the same conditions and performed comparative transcriptomics. The population densities and phenol concentrations of strain R2 in chemostat reactors I and II slightly differed, but showed similar changes (Supplementary Fig. S1). We sequenced 10 samples, comprising 5 samples from each reactor in the stable (I-1 and II-1) and collapsed statuses (I-5 and II-5), and successfully retrieved ca. 41–54 million quality-filtered transcript reads per sample (Supplementary Table S1). We observed differences between the transcriptomic data obtained from reactors I and II (Supplementary Table S2, S3, S4, and S5). We hereafter explained potential metabolic changes in strain R2 based on the transcriptomic datasets obtained from reactors I and II. The top 20 up- and down-regulated genes in reactors I and II are shown in Table S5. Approximately 50% of the up-regulated genes were related to nitrogen metabolism in reactors I and II (Supplementary Table S5-1 and S5-2), e.g., the expression of the ammonium transporter Amt family (CTR2_4688) and nitrate/nitrite transport system (CTR2_4163) was ~200-fold higher in the collapsed status (I-5 and II-5) than in the stable status (I-1 and II-1). On the other hand, common functional features were not observed among the down-regulated genes in reactors I and II (Supplementary Table S5-3 and S5-4). A ClueGo analysis (Bindea et al., 2009, 2013) using all up- and down-regulated genes showed similar results, i.e., nitrogen cycle metabolic processes were significantly up-regulated (Supplementary Fig. S4).
Relative transcriptional levels from the stable to collapsed status slightly decreased from 0.5- to 0.7-fold in the main metabolic pathways; glycolysis, gluconeogenesis, the pentose phosphate pathway, 5-phosphate-α-D-ribose 1-diphosphate (PRPP) synthesis (Supplementary Fig. S5 and Supplementary Table S2), and nucleotide synthesis (Supplementary Fig. S6 and Table S3). The relative transcriptional levels of genes encoding enzymes in the pentose phosphate pathway decreased to 0.67±0.20-fold in the collapsed status, whereas those of genes encoding PRPP decreased to 0.44-fold and 0.47-fold in the collapsed status in reactors I and II, respectively (Supplementary Fig. S5C).
On the other hand, relative transcriptional levels in some metabolic pathways were moderately repressed, maintained, or increased. In the phenol-/catechol-degrading pathways, relative transcriptional levels decreased to 0.40±0.28-fold in the collapsed status, with the exception of genes encoding the subunit of PH (dmpK, CTR2_1592) and catechol 2,3-dioxygenase (dmpB, CTR2_1599). The genes encoding PH and catechol 2,3-dioxygenase were up-regulated by approximately 30- and 3.3-fold, respectively, in reactor I, and by 15- and 1.2-fold, respectively, in reactor II (Fig. 3A and 4, Table 1, and Supplementary Table S4-1).
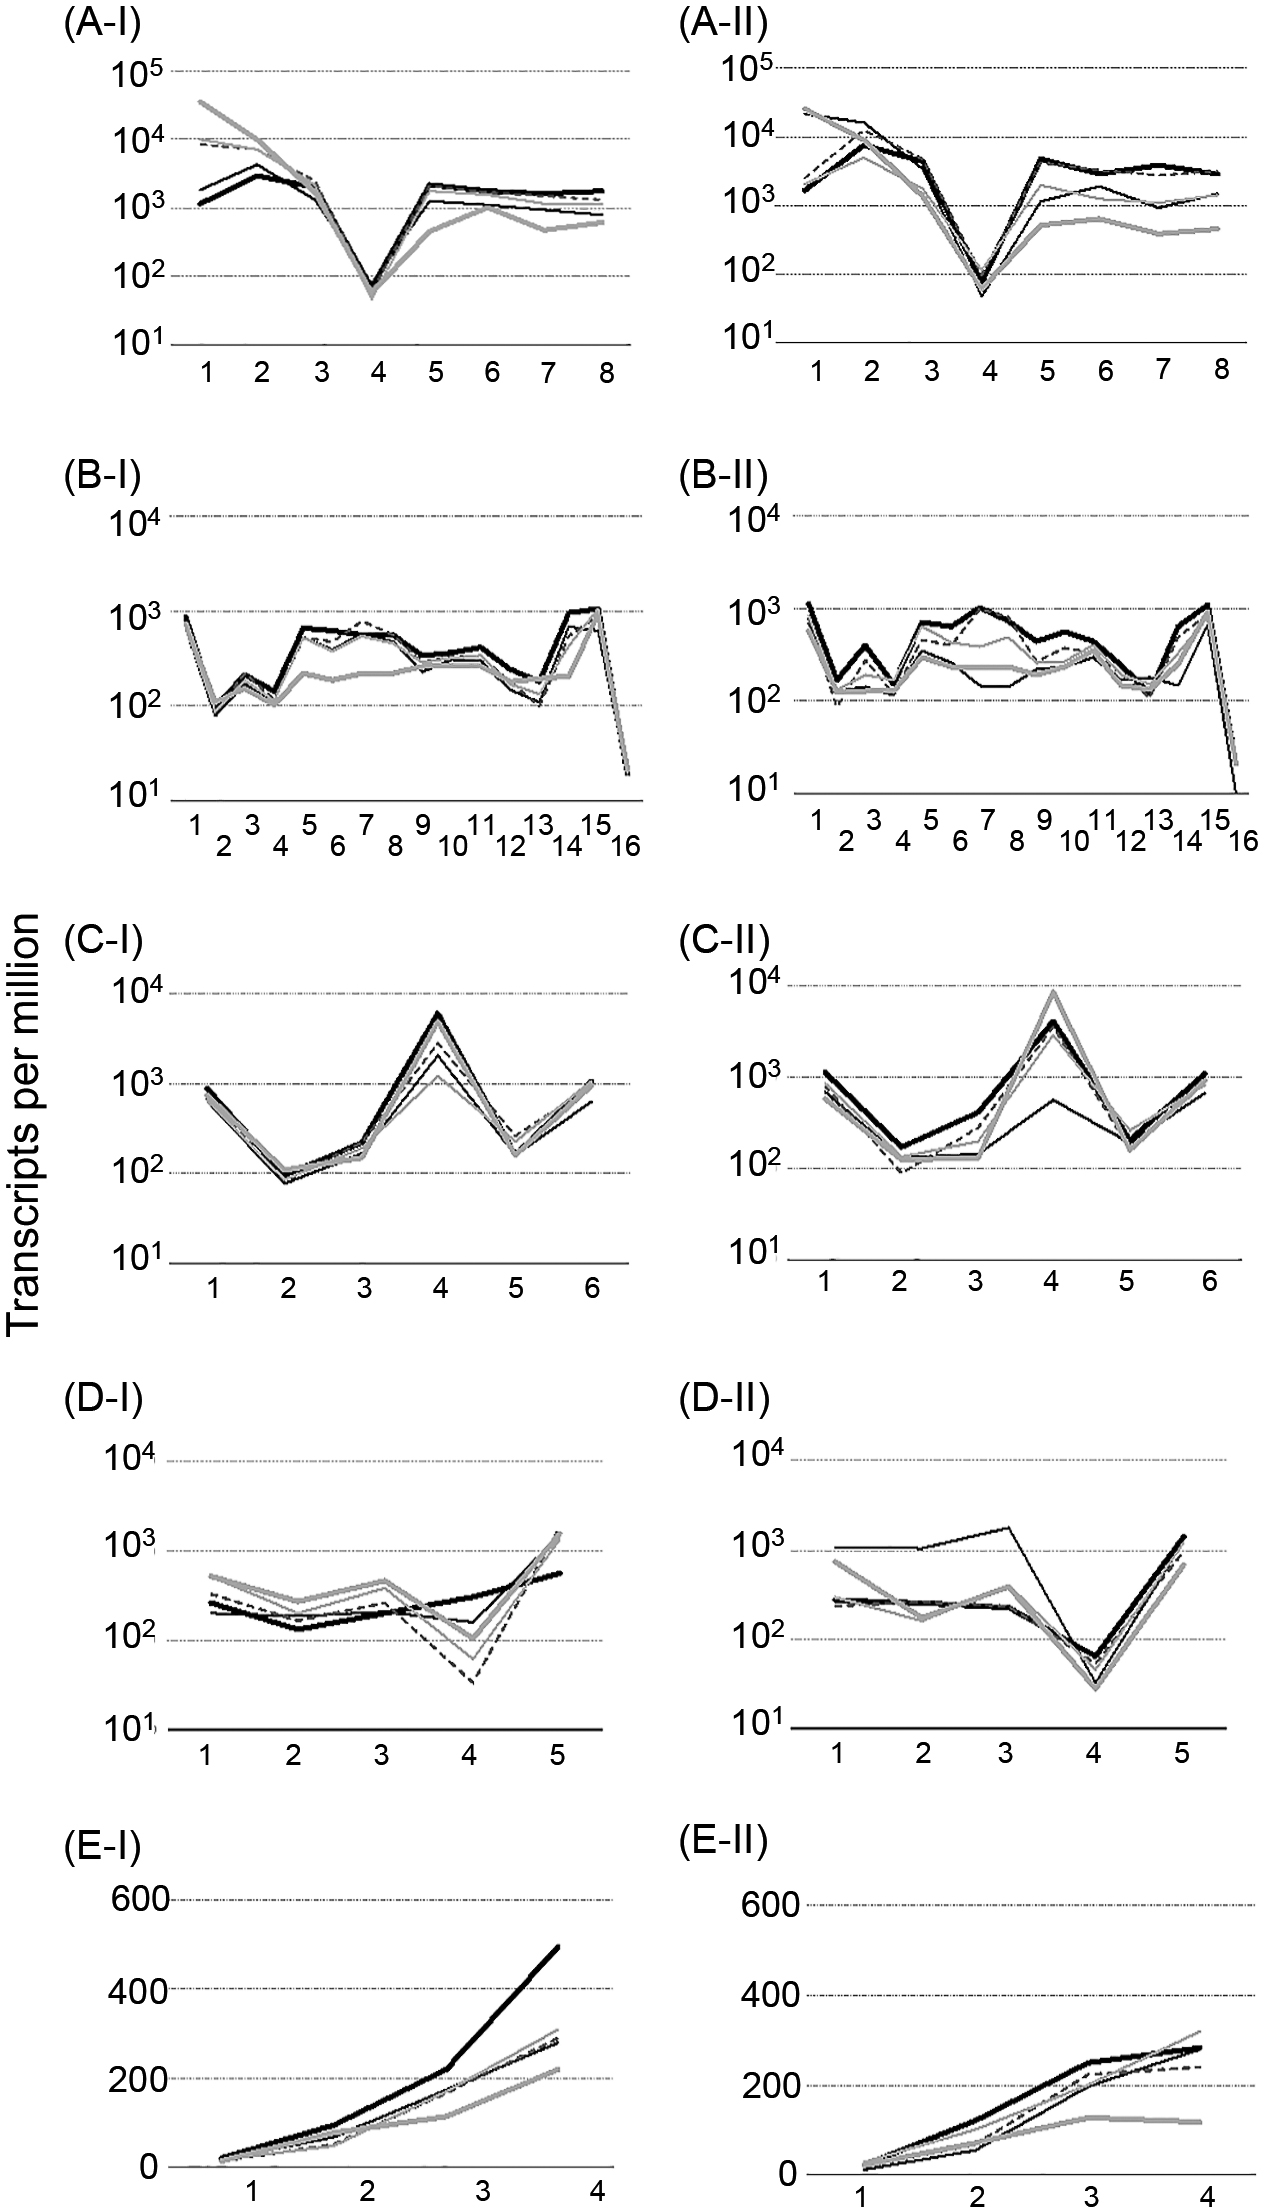

Table 1.
Lists of genes encoding pathways related to the collapsed status.
| Metabolism |
Noa |
Gene |
Locus tag number |
Enzyme |
Substrates |
Products |
ko number |
Fold
change in
reactor Ib |
Fold
change in
reactor IIc |
| Phenol degradation |
1 |
dmpK |
CTR2_1592 |
phenol/toluene 2-monooxygenase (NADH) P0/A0 |
Phenol |
catechol |
K16249 |
31 |
15 |
| Catechol degradation |
2 |
dmpB |
CTR2_1599 |
catechol 2,3-dioxygenase [EC:1.13.11.2] |
catechol |
2-Hydroxymuconic semialdehyde |
K00446 |
3.3 |
1.2 |
| PRPP synthesis |
3 |
prsA |
CTR2_3950 |
ribose-phosphate pyrophosphokinase [EC:2.7.6.1] |
D-Ribose 5-phosphate |
PRPP |
K00948 |
0.44 |
0.47 |
| TCA cycle |
4 |
gltA |
CTR2_1354 |
citrate synthase [EC:2.3.3.1] |
Acetyl-CoA,
Oxaloacetate |
Citrate |
K01647 |
0.90±0.24 |
0.53±0.21 |
| acnA |
CTR2_1384 |
aconitate hydratase [EC:4.2.1.3] |
Citrate |
Isocitrate |
K01681 |
| acnB |
CTR2_1366 |
aconitate hydratase 2/2-methylisocitrate dehydratase [EC:4.2.1.3 4.2.1.99] |
K01682 |
| 5 |
icd |
CTR2_1985 |
isocitrate dehydrogenase [EC:1.1.1.42] |
Isocitrate |
2-oxoglutarate |
K00031 |
0.72 |
0.85 |
| Glyoxylate shunt |
6 |
aceA |
CTR2_1688 |
isocitrate lyase [EC:4.1.3.1] |
Isocitrate |
Glyoxylate |
K01637 |
0.83 |
2.1 |
| 7 |
aceB |
CTR2_0005 |
malate synthase [EC:2.3.3.9] |
Glyoxylate |
Malate |
K01638 |
0.99 |
0.78 |
| GDH |
8 |
gdhA |
CTR2_3645 |
glutamate dehydrogenase (NADP+) [EC:1.4.1.4] |
2-OG, NH3, NADPH |
L-glutamate, NADP+ |
K00262 |
0.34 |
0.44 |
| 9 |
gdhA |
CTR2_4700 |
glutamate dehydrogenase (NAD+) [EC:1.4.1.3] |
L-glutamate, NAD+ |
2-OG, NH3, NADH |
K00261 |
2.8 |
0.49 |
| GOGAT |
10 |
gltD |
CTR2_4073 |
glutamate synthase (NADPH) small chain [EC:1.4.1.13] |
L-glutamine, 2-OG,
NADPH |
L-glutamate |
K00266 |
2.0 |
0.68 |
| gltB |
CTR2_4074 |
glutamate synthase (NADPH) large chain [EC:1.4.1.13] |
L-glutamine, 2-OG,
NADPH |
L-glutamate |
K00265 |
2.3 |
1.7 |
| GS |
11 |
glnA |
CTR2_1472 |
glutamine synthetase [EC:6.3.1.2] |
L-glutamate, NH3, ATP |
L-glutamine |
K01915 |
2.0 |
2.6 |
| Urea cycle |
12 |
argF |
CTR2_1066 |
ornithine carbamoyltransferase [EC:2.1.3.3] |
L-ornithine |
L-citrulline |
K00611 |
0.53 |
0.51 |
| 13 |
argG |
CTR2_5281 |
argininosuccinate synthase [EC:6.3.4.5] |
L-citrulline,
L-aspartate |
L-argininosuccinate |
K01940 |
0.45 |
0.42 |
| 14 |
argH |
CTR2_1809 |
argininosuccinate lyase [EC:4.3.2.1] |
L-argininosuccinate |
L-arginine, fumarate |
K01755 |
0.74 |
1.1 |
| 15 |
rocF |
CTR2_0414 |
arginase [EC:3.5.3.1] |
L-arginine |
L-ornithine, Urea |
K01476 |
0.83 |
0.59 |
| Nucleotide metabolism |
16 |
purF |
CTR2_5274 |
amidophosphoribosyltransferase [EC:2.4.2.14] |
L-glutamine, PRPP |
Ribosylamine-5P |
K00764 |
0.35 |
0.48 |
a; The number corresponds to “#number” shown in Fig. 4
b; TPM value at I-5 divided by TPM value at I-1.
c; TPM value at II-5 divided by TPM value at II-1.
In the TCA cycle, the relative transcriptional levels of genes encoding enzymes related to the conversion of 2-oxoglutarate (2-OG) to succinate (2-OG dehydrogenase [sucA, CTR2_2972, and sucB, CTR2_2971] and succinyl-CoA synthetase [sucC, CTR2_4841, and sucD, CTR2_4842]) significantly decreased by 0.34±0.065-fold in the collapsed status (Fig. 3B and 4), whereas those of the other genes moderately decreased by 0.73±0.25-fold from citrate to 2-OG (citrate synthase [gltA, CTR2_1354], aconitate hydratase [acnA, CTR2_1384, and acnB, CTR2_1366], and isocitrate dehydrogenase [icd, CTR2_1985]), and to 0.80±0.23-fold from succinate to oxaloacetate (succinate dehydrogenase/fumarate reductase [sdhA/frdA, CTR2_1357, sdhB/frdB, CTR2_1356, sdhC/frdC, CTR2_1359, and sdhD/frdD, CTR2_1358], fumarate hydratase [fumA/fumB, CTR2_5301, and fumC, CTR2_5299], and malate dehydrogenase [mdh, CTR2_1362, and mqo, CTR2_1070]) (Fig. 3B and 4, and Supplementary Table S4-2). In the glyoxylate shunt, the relative transcriptional levels of all 6 genes moderately decreased from the stable to collapsed status with the exception of the gene encoding isocitrate lyase (aceA, CTR2_1688) (Fig. 3C and 4, Table 1, and Supplementary Table S4-3). The relative transcriptional levels of the gene encoding isocitrate lyase (aceA, CTR2_1688) fluctuated in the collapsed status and became similar to or higher than those in the stable status.
The relative transcriptional levels of genes encoding enzymes in the biosynthesis of amino acids decreased to 0.63±0.12-fold in the collapsed status, with the exception of the synthesis of L-leucine, L-glutamate, and L-glutamine (Supplementary Fig. S7). The levels of glutamate dehydrogenase (GDH) (gdhA, CTR2_3645) in the collapsed status decreased to ~0.40-fold those in the stable status. The relative transcriptional levels of glutamate synthase (GOGAT) (gltD, CTR2_4073 and gltB, CTR2_4074) and glutamine synthetase (GS) (glnA, CTR2_1472) increased by approximately 2-fold in the collapsed status (Fig. 3D and 4, Table 1, and Supplementary Table S4-4).
In the urea cycle, the relative transcriptional levels of the 4 genes encoding enzymes were separated into two groups: the relative transcriptional levels of genes encoding enzymes related to the conversion of L-argininosuccinate to L-ornithine via L-arginine (argininosuccinate lyase [argH, CRT2_1809] and arginase [rocF, CRT2_0414]) moderately decreased to 0.82±0.22-fold in the collapsed status, whereas those of genes encoding enzymes related to the conversion from L-ornithine to L-arginino succinate via L-citrulline (ornithine carbamoyltransferase [argF, CTR2_1066] and argininosuccinate synthase [argG, CTR2_5281]) significantly decreased to 0.47±0.051-fold in the collapsed status (Fig. 3E and 4, Table 1, and Supplementary Table S4-5).
Effects of amino acids on growth inhibition
We investigated whether the growth inhibition of strain R2 was rescued by amino acids from the urea cycle (L-arginine, L-ornithine, and L-citrulline), L-glutamate, and L-glutamine (Fig. 5). Lag times and μ values in the presence of phenol and amino acids from the urea cycle were similar to those in the positive control incubated in the presence of phenol only, whereas ODmax decreased to between 80 and 90% of the positive control (Table 2). Growth parameters in the presence of a supernatant (SN) collected from the collapsed culture were similar to those of the negative control, with the exception of L-arginine. The negative growth effect was 42±0.6% under control conditions, and 3.2±8.5, 34±11, and 40±15% in the presence of L-arginine, L-ornithine, and L-citrulline, respectively (Table 2). ODmax in the presence of L-glutamate and L-glutamine increased to ~3-fold that of control conditions and two-step growth was observed (Fig. 5B). Negative growth effects under L-glutamate, and L-glutamine conditions were 59±0.36 and 27±10%, respectively (Table 2), even when a higher μ value in two-step growth was used for the calculation. Phenol concentrations were below the detection limit under all conditions after growth reached a plateau.
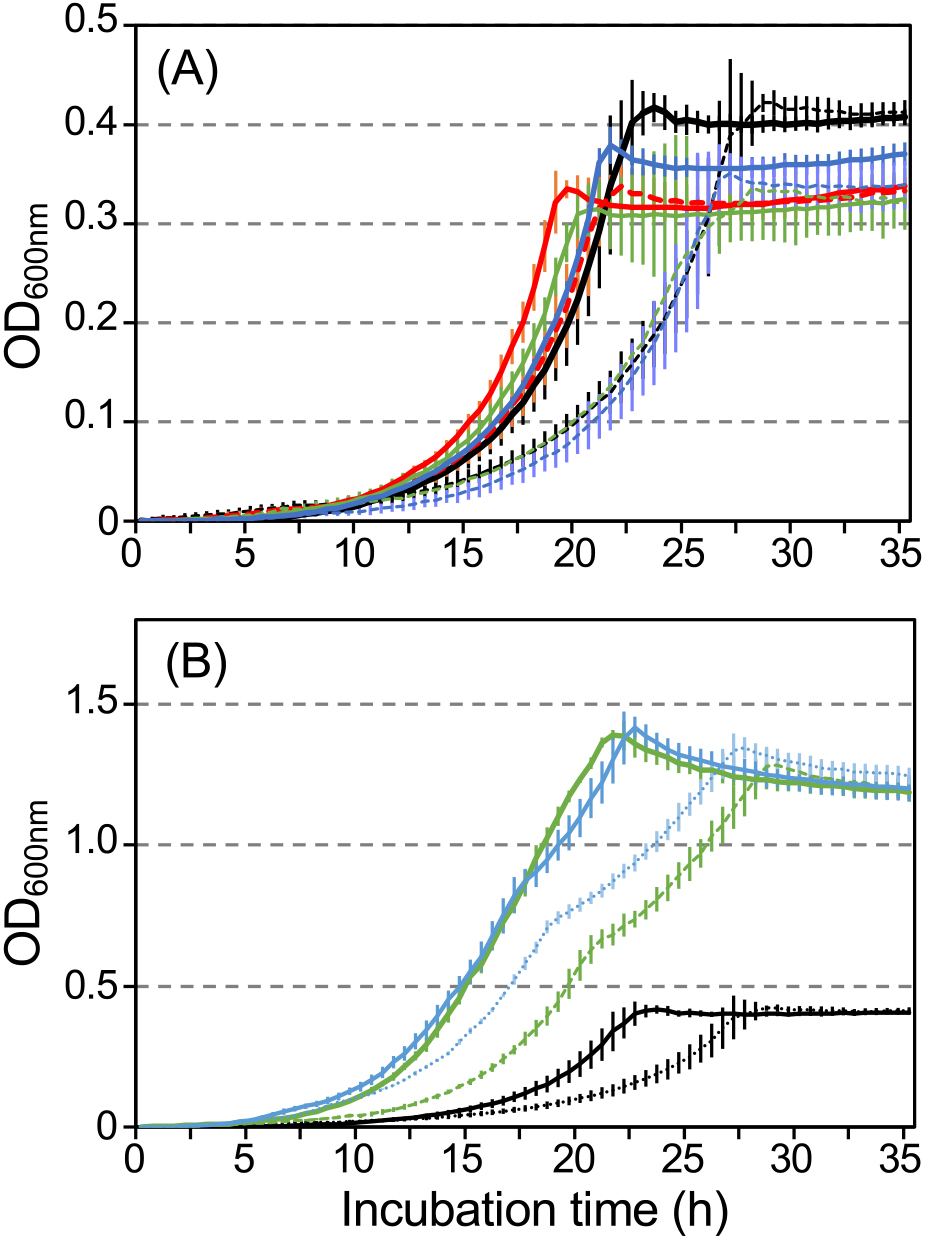
Table 2.
Effects of amino acids on the growth of strain R2
| Conditiona |
Lag time (h) |
Growth rate
constant (μ) |
OD600 nm |
Specific growth
activity (U) |
Negative growth
effect (%)h |
| Positive control |
10±1.2 |
0.25±0.0064 |
0.40±0.0093 |
0.048±0.0027 |
42±0.60 |
| Negative control |
12±1.0 |
0.17±0.011 |
0.40±0.0087 |
0.027±0.0024 |
| Argb |
10±0.50 |
0.29±0.0074 |
0.32±0.0064 |
0.044±0.00070 |
3.2±8.5 |
| Arg+SNc |
8.8±0.58 |
0.25±0.013 |
0.32±0.019 |
0.043±0.0037 |
| Ornd |
9.5±1.0 |
0.26±0.0065 |
0.31±0.039 |
0.041±0.0050 |
34±11 |
| Orn+SN |
11±0.58 |
0.19±0.031 |
0.33±0.029 |
0.027±0.0030 |
| Ctre |
11±0.29 |
0.26±0.0057 |
0.36±0.010 |
0.041±0.0022 |
40±15 |
| Ctr+SN |
11±0.29 |
0.22±0.0090 |
0.27±0.083 |
0.025±0.00061 |
| Gluf |
4.8±0.29 |
0.35±0.0093 |
1.2±0.036 |
0.41±0.015 |
59±6.3 |
| Glu+SN |
8.5±1.5 |
0.25±0.0047 |
1.2±0.035 |
0.17±0.025 |
| Glng |
9.0±1.0 |
0.26±0.0040 |
1.2±0.046 |
0.17±0.021 |
27±10 |
| Gln+SN |
11±0.56 |
0.22±0.0051 |
1.3±0.027 |
0.12±0.0033 |
a; Phenol was added as the sole carbon and energy source in all conditions.
b; Arg: L-arginine, c; SN: supernatant collected from collapsed chemostat cultures. d; Orn: L-ornithine, e; Ctr: L-citrulline, f; Glu: L-glutamate, g; Gln: L-glutamine, h; negative growth effect (%): the effect was calculated by the following equation:
(1–Uamino acid⁄Uamino acid+SN)×100, where Uamino acid is relative growth activity in the presence of phenol and an amino acid, and Uamino acid+SN is relative growth activity in the presence of phenol, the amino acid, and the supernatant.
Discussion
The present study attempted to elucidate the collapsing mechanism induced by feedback growth inhibition in strain R2. Collapse was not observed under batch conditions, it only occurred under chemostat conditions. The results obtained revealed that growth inhibition and metabolic changes had already occurred before the collapse, which was attributed to negative feedback induced by the accumulation of hydrophilic metabolites produced from strain R2. Unexpectedly, increases were noted in the relative transcriptional levels of the genes encoding PH and catechol 2,3-dioxygenase (Fig. 4, Table 1). These genes are located in an operon regulated by the regulator protein DmpR (Azwani et al., 2017, 2021), which accelerates transcription by binding with phenol and its dissociation constant is 16 μM (O’Neill et al., 1998), indicating that phenol concentrations had increased in cells. Since PH and catechol 2,3-dioxygenase were competitively inhibited by the metabolites (Fig. 2), we considered a deficiency in a usable carbon source to be a trigger for collapse. Transcriptomic analyses showed that the actual condition of the collapsing mechanism was metabolically complex; metabolites induced an imbalance in carbon and nitrogen metabolism in cells, which resulted in collapse. We discussed how the imbalance occurred and why L-arginine effectively rescued it.
The transcriptomic analysis demonstrated that relative transcriptional levels decreased in the majority of carbon metabolic pathways, indicating that the supply of carbon skeletons for nitrogen assimilation was limited under growth-inhibiting conditions. On the other hand, the relative transcriptional levels of some metabolic pathways moderately decreased, were maintained, increased, or fluctuated, which were considered to be adaptive processes to negative feedback. The relative transcriptional level of the isocitrate lyase gene (aceA, CTR2_1688) related to the TCA cycle and glyoxylate shunt fluctuated and increased under collapsed conditions (Fig. 3C), indicating that strain R2 adapted to a carbon source deficiency because carbon was not released as CO2 in the glyoxylate shunt. The relative transcriptional levels of the metabolic pathways from citrate to 2-OG in the TCA cycle in the collapsed state were limited to approximately 0.70-fold those in the stable status, whereas the metabolic pathways from 2-OG to succinate were repressed to approximately 0.35-fold (Fig. 3B and 4, and Supplementary Table S4-2). 2-OG may be used in metabolic pathways other than the TCA cycle because it plays a major role in carbon skeletons for the biosynthesis of nitrogenous compounds via L-glutamate and L-glutamine (Merrick and Edwards, 1995). GDH and GS have been widely suggested to play a central role in responses to ammonia stress by converting ammonia to non-toxic or less toxic nitrogenous compounds (Zhang et al., 2020). In the collapsed status, the transcriptional level of GDH (gdhA, CTR2_3645) decreased (Fig. 3D and 4, and Table 1), whereas those of GS (glnA, CTR2_1472) and GOGAT (gltD, CTR2_4073 and gltB, CTR2_4074) (the GS-GOGAT pathway) increased (Fig. 3D and 4, and Table 1). Differences in activities between the GS-GOGAT and GDH pathways are considered to depend on differences in the affinity for ammonium of GS (~0.1 mM) (Sharkey and Engel, 2008) and GDH (more than 1 mM) (Alibhai and Villafranca, 1994), whereas the GS-GOGAT pathway is the main ammonium-assimilatory route even with a high ammonium concentration (10 mM) in E. coli (Yuan et al., 2009). The Km values of GS and GDH for 2-OG are ~0.24 mM (Mantsala and Zalkin, 1976) and ~0.64 mM (Veronese et al., 1975; Sharkey and Engel, 2008), respectively, suggesting that strain R2 is under 2-OG deficiency conditions. The activity of Icd (CTR2_1985) producing 2-OG from isocitrate in the TCA cycle may be repressed because enzyme activity is positively regulated by metabolites derived from glycolysis/gluconeogenesis (Cozzone and El-Mansi, 2005), which supports the hypothesis of a 2-OG pool deficiency in strain R2 in the collapsed state.
2-OG acts as a metabolic signal of small and transient fluctuations in ammonium availability in Escherichia coli, i.e., the concentration of 2-OG increases with ammonium limitations under steady-state growth conditions (Senior, 1975; Reyes-Ramirez et al., 2001) and vice versa (Yuan et al., 2009; Radchenko et al., 2010; Yan et al., 2011). A negative correlation has been reported between ammonium availability and 2-OG accumulation in other microorganisms (Muro-Pastor et al., 2001; Dodsworth et al., 2005; Brauer et al., 2006). This negative correlation contributes to the balance between carbon and nitrogen metabolism: the decrease in 2-OG and increase in L-glutamine facilitate the construction of the complex of the ammonium transporter (AmtB) and regulator protein (GlnK), resulting in the repression of NH4+ influx through the AmtB-GlnK complex (Radchenko et al., 2010), and the replenishment of the 2-OG pool is then achieved by increased transamination after the consumption of ammonium. However, the relative transcriptional levels of nitrogenous compound synthesis decreased not only in nucleotide synthesis (Supplementary Fig. S6), but also in amino acid synthesis, with the exception of L-leucine, L-glutamate, and L-glutamine (Supplementary Fig. S7). Furthermore, the gene encoding the ammonium transporter Amt family (CTR2_4687) was up-regulated by ~190-fold in the collapsed status (Supplementary Table S5-1), suggesting that cellular ammonium concentrations increased in the collapsed status. In parallel, the genes encoding nitrite reductase (nirB, CTR2_4180) and the urea ABC transporter (CTR2_0055) were up-regulated by ~155- and ~20-fold, respectively, in the collapsed status (Supplementary Table S5-1), indicating that strain R2 attempted to decrease endogenous ammonium toxicity and balance carbon and nitrogen metabolism by reducing excess ammonium. The gene encoding AmtB was significantly up-regulated even under conditions of low 2-OG and high glutamine concentrations, which has yet to be resolved with the identification of growth-inhibiting metabolites. This imbalance may affect various metabolic pathways; e.g., outer membrane protein porin (CTR2_5017) and cell division protein (CTR2_0482) were down-regulated (Supplementary Table S5-3 and S5-4), whereas PilA (CTR2_4856) was up-regulated in the collapsed status (Supplementary Table S5-1 and S5-2). The imbalance in metabolism related to the cell structure may have caused the disordered cells observed in the collapsed status (Supplementary Fig. S2B). The mechanisms maintaining the balance between carbon and nitrogen metabolism in strain R2 have not yet been elucidated.
The urea cycle is an essential pathway for the disposal of ammonia in mammals, and the genes encoding enzymes in the urea cycle in mammals are evolutionarily derived from bacterial genes for the detoxification of ammonia (Walsh and Patricia, 1995). A previous study reported that the urea cycle of Helicobacter pylori acts as an effective mechanism to extrude excess nitrogen from cells (Mendz and Hazell, 1996). Therefore, we attempted to enhance the activity of the urea cycle by adding amino acids to the urea cycle because the urea cycle of strain R2 was repressed in the collapsed status (Fig. 3E and 4, and Table 1). Only L-arginine enabled the rescue of strain R2 from growth inhibition without an increase in the number of cells (Fig. 5A and Table 2), indicating that L-arginine was not used in anabolic processes, but functioned as a trigger to enhance the urea cycle. The mechanisms by which L-arginine rescues strain R2 from growth inhibition warrant further study.
Conclusion
The present study revealed the metabolic responses of strain R2 to negative feedback (Fig. 4 and Table 1). The imbalance in carbon and nitrogen metabolism was caused by both an increase in the concentration of NH4+ and a decrease in the supply of carbon skeletons, which resulted in collapse. 2-OG and PRPP are at the metabolic intersection between carbon and nitrogen metabolism, with 2-OG playing a major role as not only a master regulator (Huergo and Dixon, 2015), but also a major carbon skeleton in nitrogen-assimilatory reactions (Commichau et al., 2006). Nitrogen regulates primary and secondary metabolism in various bacteria (Merrick and Edwards, 1995); therefore, a more detailed understanding of the regulatory mechanisms of NH4+ concentrations in cells will be indispensable for managing microorganisms. The monitoring of these compound concentrations in cells will provide insights into collapse and rescue mechanisms and these analyses will contribute to the clarification of bacterial coexisting mechanisms in microbial ecosystems.
Citation
Mohd Din, A. R. J., Suzuki, K., Honjo, M., Amano, K., Nishimura, T., Moriuchi, R., et al. (2021) Imbalance in Carbon and Nitrogen Metabolism in Comamonas testosteroni R2 Is Caused by Negative Feedback and Rescued by L-arginine. Microbes Environ 36: ME21050.
https://doi.org/10.1264/jsme2.ME21050
Acknowledgements
This research was funded in part by KAKENHI 19K22927 and KAKENHI (B) 21H03633. The authors declare no conflict of interest.
References
- Alibhai, M., and Villafranca, J.J. (1994) Kinetic and mutagenic studies of the role of the active site residues sp-50 and Glu-327 of Escherichia coli glutamine synthetase. Biochemistry
33: 682–686.
- Aziz, F.A.A., Suzuki, K., Ohtaki, A., Sagegami, K., Hirai, H., Seno, J., et al. (2015) Interspecies interactions are an integral determinant of microbial community dynamics. Front Microbiol
6: 1148.
- Azwani, F., Suzuki, K., Honjyo, M., Tashiro, Y., and Futamata, H. (2017) Draft genome sequence of Comamonas testosteroni R2, consisting of aromatic compound degradation genes for phenol hydroxylase. Genome Announc
5: e00875-17.
- Azwani, F.A.A., Suzuki, K., Honjo, M., Amano, K., Mohd Din, A.R.J.B., Tashiro, Y., and H. Futamata. (2021) Coexisting mechanisms of bacterial community are changeable even under similar stable conditions in a chemostat conditions. J Biosci Bioeng
131: 77–83.
- Bindea, G., Mlecnik, B., Hackl, H., Charoentong, P., Tosolini, M., Kirilovsky, A., et al. (2009) ClueGO: a Cytoscape plug-in to decipher functionally grouped gene ontology and pathway annotation networks. Bioinformatics
25: 1091–1093.
- Bindea, G., Galon, J., and Mlecnik, B. (2013) CluePedia Cytoscape plugin: pathway insights using integrated experimental and in silico data. Bioinformatics
29: 661–663.
- Bolger, A.M., Lohse, M., and Usadel, B. (2014) Trimmomatic: a flexible trimmer for Illumina sequence data. Bioinformatics
30: 2114–2120.
- Brauer, M.J., Yuan, J., Bennett, B.D., Lu, W., Kimball, E., Botstein, D., and Rabinowitz, J.D. (2006) Conservation of the metabolomic response to starvation across two divergent microbes. Proc Natl Acad Sci U S A
103: 19302–19307.
- Cao, X., Jamilton, J.J., and Venturelli, O.S. (2018) Understanding and engineering distributed biochemical pathways in microbial communities. Biochemistry
58: 94–107.
- Christensen, B.R., Haagensen, J.A.J., Heydorn, A., and Molin, S. (2002) Metabolic commensalism and competition in a two-species microbial consortium. Appl Environ Microbiol
68: 2495–2502.
- Commichau, F.M., Forchhammer, K., and Stülke, J. (2006) Regulatory links between carbon and nitrogen metabolism. Curr Opin Microbiol
9: 167–172.
- Cozzone, A.J., and El-Mansi, M. (2005) Control of isocitrate dehydrogenase catalytic activity by protein phosphorylation in Escherichia coli. J Mol Microbiol Biotechnol
9: 132–146.
- De Roy, K., Marzorati, M., Van den Abbeele, P., Van de Wiele, T., and Boon, N. (2014) Synthetic microbial ecosystems: an exciting tool to understand and apply microbial communities. Environ Microbiol
16: 1472–1481.
- Dodsworth, J.A., Cady, N.C., and Leigh, J.A. (2005) 2-Oxoglutarate and the PII homologues NifI1 and NifI2 regulate nitrogenase activity in cell extracts of Methanococcus maripaludis. Mol Microbiol
56: 1527–1538.
- El-Chakhtoura, J., Prest, E., Saikaly, P., van Loosdrecht, M., Hammers, F., and Vrouwenvelder, H. (2015) Dynamics of bacterial communities before and after distribution in a full-scale drinking water network. Water Res
74: 180–190.
- Fernandez, A., Juang, S., Seston, S., Xing, J., Hickey, R., Criddle, C., and Tiedje, J.M. (1999) How stable is stable? Function versus community composition. Appl Environ Microbiol
65: 3697–3704.
- Fernandez, A.S., Hashsham, S.A., Dollhopf, S.L., Raskin, L., Glagoleva, O., Dazzo, F.B., et al. (2000) Flexible community structure correlates with stable community function in methanogenic bioreactor communities perturbed by glucose. Appl Environ Microbiol
66: 4058–4067.
- Folsom, B.R., Chapman, P.J., and Pritchard, P.H. (1990) Phenol and trichloroethylene degradation by Pseudomonas cepacia G4: kinetics and interactions between substrates. Appl Environ Microbiol
56: 1279–1285.
- Freilich, S., Zarecki, R., Eilarm, O., Segal, E.S., Henry, C.S., Kupiec, M., et al. (2011) Competitive and cooperative metabolic interactions in bacterial communities. Nat Commun
2: 589.
- Friedman, J., Higgins, L.M., and Gore, J. (2017) Community structure follows simple assembly rules in microbial microcosms. Nat Ecol Evol
1: 109.
- Futamata, H., Harayama, S., and Watanabe, K. (2001a) Diversity in kinetics of trichloroethylene-degrading activities exhibited by phenol-degrading bacteria. Appl Microbiol Biotechnol
55: 248–253.
- Futamata, H., Harayama, S., and Watanabe, K. (2001b) Group-specific monitoring of phenol hydroxylase genes for a functional assessment of phenol-stimulated trichloroethylene bioremediation. Appl Environ Microbiol
67: 4671–4677.
- Futamata, H., Nagano, Y., Watanabe, K., and Hiraishi, A. (2005) Unique kinetic properties of phenol-degrading Variovorax strains responsible for efficient trichloroethylene degradation in a chemostat enrichment culture. Appl Environ Microbiol
71: 904–911.
- Haruta, S., Cui, Z., Huang, Z., Li, M., Ishii, M., and Igarashi, Y. (2002) Construction of a stable microbial community with high cellulose-degradation ability. Appl Microbiol Biotechnol
59: 529–534.
- Haruta, S., Yoshida, T., Aoi, Y., Kaneko, K., and Futamata, H. (2013) Challenges for complex microbial ecosystems: Combination of experimental approaches with mathematical modeling. Microbes Environ
28: 285–294.
- Haruta, S., and Yamamoto, K. (2018) Model microbial consortia as tools for understanding complex microbial communities. Curr Genomics
19: 723–733.
- He, X., McLean, J.S., Guo, L., Lux, R., and Shi, W. (2014) The social structure of microbial community involved in colonization resistance. ISME J
8: 564–574.
- Hsu, R.H., Clark, R.L., Tan, J.W., Ahn, J.C., Gupta, S., Romero, P.A., and Venturelli, O.S. (2019) Microbial interaction network inference in microfluidic droplets. Cell Syst
9: 1–14.
- Huergo, L.F., and Dixon, R. (2015) The emergence of 2-oxoglutarate as a master regulator metabolite. Microbiol Mol Biol Rev
79: 419–435.
- Inaba, T., Oura, H., Morinaga, K., Toyofuku, M., and Nomura, N. (2015) The Pseudomonas quinolone signal inhibits biofilm development of Streptococcus mutans. Microbes Environ
30: 189–191.
- Kato, S., Haruta, S., Cui, Z.J., Ishii, M., and Igarashi, Y. (2005) Stable coexistence of five bacterial strains as a cellulose-degrading community. Appl Environ Microbiol
71: 7099–7106.
- Kim, D., Paggi, J.M., Park, C., Bennett, C., and Salzberg, S.L. (2019) Graph-based genome alignment and genotyping with HISAT2 and HISAT-genotype. Nat Biotechnol
37: 907–915.
- Kim, J., and Copley, S.D. (2012) Inhibitory cross-talk upon introduction of a new metabolic pathway into an existing metabolic network. Proc Natl Acad Sci U S A
109: E2856–E2864.
- Liao, Y., Smyth, G.K., and Shi, W. (2014) featureCounts: an efficient general purpose program for assigning sequence reads to genomic features. Bioinformatics
30: 923–930.
- Mantsala, P., and Zalkin, H. (1976) Glutamate synthase. Properties of glutamine-dependent activity. J Biol Chem
251: 3294–3299.
- Mee, M.T., Collins, J.J., Church, G.M., and Wang, H.H. (2014) Syntrophic exchange in synthetic microbial communities. Proc Natl Acad Sci U S A
111: E2149–E2156.
- Mendz, G.L., and Hazell, S.L. (1996) The urea cycle of Helicobacter pylori. Microbiology
142: 2959–2967.
- Merrick, M.J., and Edwards, R.A. (1995) Nitrogen control in bacteria. Microbiol Rev
59: 604–622.
- Morris, B.E.L., Henneberger, R., Huber, H., and Moissl-Eichinger, C. (2013) Microbial syntrophy: interaction for the common good. FEMS Microbiol Rev
37: 384–406.
- Muro-Pastor, M.I., Reyes, J.C., and Florencio, F.J. (2001) Cyanobacteria perceive nitrogen status by sensing intracellular 2-oxoglutarate levels. Biol Chem
276: 38320–38328.
- Narisawa, N., Haruta, S., Arai, H., Ishii, M., and Igarashi, Y. (2008) Coexistence of antibiotic-producing and antibiotic-sensitive bacteria in biofilm is mediated by resistant bacteria. Appl Environ Microbiol
74: 3887–3894.
- O’Neill, E., Ng, L.C., Sze, C.C., and Shingler, V. (1998) Aromatic ligand binding and intramolecular signaling of the phenol-responsive σ54-dependent regulator DmpR. Mol Microbiol
28: 131–141.
- Powlowski, J., and Shingler, V. (1994) Genetics and biochemistry of phenol degradation by Pseudomonas sp. CF600. Biodegradation
5: 219–236.
- Radchenko, M.V., Thornton, J., and Merrick, M. (2010) Control of AmtB-GlnK complex formation by intercellular levels of ATP, ADP, and 2-oxoglutarate. J Biol Chem
285: 31037–31045.
- Reyes-Ramirez, F., Little, R., and Dixon, R. (2001) Role of Escherichia coli nitrogen regulatory genes in the nitrogen response of the Azotobacter vinelandii NifL-NifA complex. J Bacteriol
183: 3076–3082.
- Robinson, M.D., McCarthy, D.J., and Smyth, G.K. (2010) edgeR: a Bioconductor package for differential expression analysis of digital gene expression data. Bioinformatics
26: 139–140.
- Robinson, M.D., and Oshlack, A. (2010) A scaling normalization method for differential expression analysis of RNA-seq data. Genome Biol
11: R25.
- Senior, P.J. (1975) Regulation of nitrogen metabolism in Escherichia coli and Klebsiella aerogenes: studies with the continuous culture technique. J Bacteriol
123: 407–418.
- Sharkey, M.A., and Engel, P.C. (2008) Apparent negative co-operativity and substrate inhibition in overexpressed glutamate dehydrogenase from Escherichia coli. FEMS Microbiol Lett
281: 132–139.
- Tanaka, Y., Hanada, S., Tamaki, H., Nakamura, K., and Kamagata, Y. (2005) Isolation and identification of bacterial strains producing diffusible growth factor(s) for Catellibacterium nectariphilium strain AST4T. Microbes Environ
20: 110–116.
- Tashiro, Y., Yawata, Y., Toyofuku, M., Uchiyama, H., and Nomura, N. (2013) Interspecies interaction between Pseudomonas aeruginosa and other microorganisms. Microbes Environ
28: 13–24.
- Veronese, F.M., Boccu, E., and Conventi, L. (1975) Glutamate dehydrogenase from Escherichia coli: induction, purification and properties of the enzyme. Biochim Biophys Acta
377: 217–228.
- Walsh, P.J.W, and Patricia, A. (1995) Nitrogen Metabolism and Excretion. Walsh, P.J., and Wright, P. (eds). Boca Raton, FL: CRC Press.
- Watanabe, K., Hino, S., Onodera, K., Kajie, S., and Takahashi, N. (1996) Diversity in kinetics of bacterial phenol-oxygenating activity. J Ferment Bioeng
81: 560–563.
- Watanabe, K., Yamamoto, S., Hino, S., and Harayama, S. (1998) Population dynamics of phenol-degrading bacteria in activated sludge determined by gyrB-targeted quantitative PCR. Appl Environ Microbiol
64: 1203–1209.
- Yan, D., Lenz, P., and Hwa, T. (2011) Overcoming fluctuation and leakage problems in the quantification of intracellular 2-oxoglutarate levels in Escherichia coli. Appl Environ Microbiol
77: 6763–6771.
- Yuan, J., Doucette, C.D., Fowler, W.U., Feng, X.J., Piazza, M., Rabitz, H.A., et al. (2009) Metabolomics-driven quantitative analysis of ammonia assimilation in E. coli. Mol Syst Biol
5: 302.
- Zhang, H., Sun, G., Lin, Z., Yao, H., and Dong, Y. (2020) The razor clam Sinonovacula constricta uses the strategy of conversion of toxic ammonia to glutamine in response to high environmental ammonia exposure. Mol Biol Rep
47: 9579–9593.