Abstract
Membrane vesicles (MVs) released from the bacterium Paracoccus denitrificans Pd1222 are enriched with the quorum sensing (QS) signaling molecule N-hexadecanoyl-l-homoserine lactone (C16-HSL). However, the biogenesis of MVs in Pd1222 remains unclear. Investigations on MV formation are crucial for obtaining a more detailed understanding of the dynamics of MV-assisted signaling. In the present study, live-cell imaging showed that P. denitrificans Pd1222 produced MVs through cell lysis under DNA-damaging conditions. DNA sequencing of MVs and a transcriptome analysis of cells indicated that the expression of a prophage region was up-regulated at the onset of MV formation under DNA-damaging conditions. A further sequence analysis identified a putative endolysin (Pden_0381) and holin (Pden_0382) in the prophage region. The expression of these genes was regulated by RecA. Using gene knockout mutants, we showed that prophage-encoded endolysin was critical for MV formation by P. denitrificans Pd1222 under DNA-damaging conditions. MV triggering by endolysin was dependent on the putative holin, which presumably transported endolysin to the periplasmic space. C16-HSL quantification revealed that more signals were released into the milieu as a consequence of the effects of endolysin. Using a QS reporter strain, we found that the QS response in P. denitrificans was stimulated by inducing the expression of endolysin. Collectively, these results provide novel insights into the mechanisms by which a bacterial cell-to-cell communication system is manipulated by phage genes.
Quorum sensing (QS) is a cell-to-cell communication system that is utilized by various bacteria (Whiteley et al., 2017). In this system, signaling molecules are released from cells and recognized by neighboring cells, which allows bacteria to dose-dependently regulate gene expression in the entire bacterial population. An essential process in QS is the transfer of signaling molecules between cells. The conventional QS model assumes that signaling molecules diffuse freely among cells. Consistent with this model, hydrophilic signaling molecules, such as N-butyryl-l-homoserine lactone, have been reported to diffuse freely into and out of cells (Pearson et al., 1999). In contrast, a number of hydrophobic signaling molecules have been shown to accumulate in the cell envelope (Pearson et al., 1999; Chan et al., 2007; Buroni et al., 2009). Therefore, the mode of diffusion of signaling molecules remains unclear.
Recent studies revealed that MVs contain hydrophobic signaling molecules and function as carriers in several bacteria (Mashburn and Whiteley, 2005; Schertzer and Whiteley, 2012; Brameyer et al., 2018). Paracoccus denitrificans is a non-motile Gram-negative bacterium that produces and utilizes the N-acyl-homoserine lactone (AHL) QS signal, N-hexadecanoyl-l-homoserine lactone (C16-HSL). We previously demonstrated that this bacterium enriched C16-HSL in membrane vesicles (MVs) and transmitted them to other cells, which regulated cell aggregation (Toyofuku et al., 2017b). Although C16-HSL alone does not diffuse well in aqueous environments due to its high hydrophobicity, MVs allow C16-HSL to disperse. This indicates that P. denitrificans employs a MV-based bacterial communication system. In systems in which signals are carried by MVs, MV formation is an important step in understanding how QS signals are released. However, the mechanisms underlying MV formation in P. denitrificans remain unclear.
MVs are formed in the cellular membranes of various bacteria. The canonical model for MV formation in Gram-negative bacteria is blebbing of the outer membrane (Jan, 2017). DNA damage was recently found to induce MV formation via explosive cell lysis in P. aeruginosa and through bubbling cell death in Bacillus subtilis and Corynebacterium glutamicum (Turnbull et al., 2016; Toyofuku et al., 2017a; Nagakubo et al., 2021). Prophage genes, namely, lys and hol, play important roles in these processes. The hol-lys system is known to release phage particles from host bacteria through cell lysis during the phage lytic cycle upon the sensing of DNA-damaging stress by host bacteria. lys and hol encode endolysin and holin, respectively, and endolysin is transferred from the cytoplasm to the periplasm through pores created by holin in the inner membrane. Endolysin degrades the bacterial cell wall by enzymatic activity, which causes cell lysis and the release of phage particles. A previous study demonstrated that the DNA-damaging agent, mitomycin C (MMC) induced MV production in P. denitrificans Pd1222 (Toyofuku et al., 2017b); however, the involvement of prophage genes has not yet been investigated.
In the present study, we showed that MV formation in P. denitrificans was stimulated by prophage gene expression, resulting in the release of C16-HSL. Our results revealed that cell-to-cell communication in P. denitrificans may be stimulated by a phage-derived gene via MV production, which indicates a new role for phage genes in bacterial communication.
Materials and Methods
Bacterial strains and growth conditions
The strains used in the present study are listed in Table S1. P. denitrificans was grown in tryptic soy broth (TSB) at 37°C according to standard procedures. Escherichia coli and Chromobacterium violaceum were grown in Luria broth at 37 and 30°C, respectively. The antibiotics used for selection were 50 μg mL–1 kanamycin and 1 μg mL–1 tetracycline. Cumate (Sigma-Aldrich) was added to the culture at OD600=0.1 to induce gene expression where necessary, and the culture was incubated for a further 8 h. MVs were isolated from P. denitrificans Pd1222 cultures that were inoculated at an initial OD600=0.01 after a 24-h incubation at 200 rpm. To induce MV formation using MMC in P. denitrificans Pd1222, strains were inoculated at an initial OD600 of 0.1 and then incubated at 37°C and 200 rpm. When growth reached OD600=0.35, MMC was added to the culture, which was incubated for a further 5 h under the same conditions.
Construction of plasmids and targeted mutations
The primers used in the present study are listed in Table S2. P. denitrificans Pd1222 gene deletion mutants were generated by homologous recombination with pK18mobsacB, as described below (Shearer et al., 1999). To generate a Pden_0381 mutant, the flanking regions of the target gene were amplified using the 0381F1/0381R1 and 0381F2/0381R2 primer sets. PCR products were mixed in equimolar proportions and used for overlap extension PCR with the 0381overF/0381overR primer sets. The PCR product and pK18mobsacB were treated with EcoRI and HindIII, assembled using NEBuilder Hifi DNA assembly (NEB), and delivered into P. denitrificans Pd1222 by conjugation using E. coli S17-1 (Simon et al., 1986). Pden_0382 in WT was deleted using pK18mobsacB-ΔPden_0382_WT which was generated with the 0382wtF1/0382wtR1, 0382F2/0382R2, and 0382wtoverF/0382overR primer sets. Pden_0382 in ΔPden_0381 was deleted using pK18mobsacB-ΔPden_0382_ΔPden_0381 which was generated with the 0382 lysF1/0382 lysR1, 0382F2/0382R2, and 0382 lysoverF/0382overR primer sets. Cumate-inducible plasmids (pQF_0381, pQF_0382, and pQF_0381_0382) were constructed by cloning target genes derived from the Pd1222 genome into pQF using the Ind0381F/Ind0381R, Ind0382F/Ind0382R, and Ind0381_0382F/Ind0381_0382R primer sets, respectively. The amplified fragments and pQF were treated with XbaI and KpnI and ligated using Mighty Mix (Takara Bio).
MV isolation and quantification
MVs were isolated and quantified as previously described (Toyofuku et al., 2017b). The cell culture was centrifuged at 6,000×g at 4°C for 20 min, and the supernatant was filtered through a polyvinylidene difluoride filter with a pore size of 0.22 μm (Merck Millipore) to remove cells. The supernatant was ultracentrifuged at 150,000×g at 4°C for 1 h using an MLA-50 rotor (Beckman Coulter). Regarding larger volumes, the supernatant was ultracentrifuged at 200,000×g at 4°C for 90 min with a Type 45 Ti rotor (Beckman Coulter). The MV pellet was washed and suspended in 10 mM HEPES/0.85% NaCl (pH 6.8).
Regarding density gradient centrifugation, a working solution (10–45% iodixanol/10 mM HEPES [pH 6.8]/0.85% NaCl) was prepared using Optiprep (Alere Technology AS). The MV pellet was suspended in a 45% iodixanol solution and transferred to a centrifuge tube. An iodixanol solution (15–40%) was multilayered by concentration, followed by ultracentrifugation at 100,000×g at 4°C for 3 h using an MLS-50 rotor. After MV fractions were collected using pipette tips, MV samples were washed and suspended in 10 mM HEPES/0.85% NaCl (pH 6.8). The amount of MVs was assessed using membrane and protein assays. In the membrane assay, a Varioskan Flash Reader (Thermo Scientific) was used to measure the relative fluorescent units (RFU) of FM4-64 (Ex/Em=558 nm/734 nm) in a 96-well black plate (Grainer Bio-one). In the protein assay, MVs were quantified using a BCA protein assay kit (Nacalai Tesque). A Varioskan Flash Reader (Thermo Scientific) was used to measure absorbance at 562 nm in a 96-well plate (IWAKI).
Microscopy
Regarding live-cell imaging, confocal laser microscopy was performed using an LSM780 system (Carl Zeiss) and a 100× oil objective lens (Alpha Plan-Apochromat 100×/1.46 Oil DIC M27 Elyra; Carl Zeiss) in the Airyscan mode. FM4-64 (2.5 μg mL–1) was added to the cell culture at the same time as MMC (50 ng mL–1), and the sample was incubated at 200 rpm for 1 h. Stained cells (2 μL) were then placed on a thick agar pad containing TSB, 0.8% Bacto agar, 2.5 μg mL–1 FM4-64, and 50 ng mL–1 MMC. The sample was well dried and placed on a glass-bottomed dish, with the sample facing the glass bottom (IWAKI). Images were obtained every 30 min, and Airyscan processing was performed using ZEN Black software (Carl Zeiss). The ImageJ plugin StackReg (Thevenaz et al., 1998) was used to correct the XY-axis in the movie.
A 100× oil objective lens (EC Plan-Neofluar 100×/1.30 Oil Ph 3 M27; Carl Zeiss) was used to observe phase contrast. Cell samples (2 μL) were placed on a 0.8% purified agar pad on a glass slide and covered with a glass coverslip. Image processing was performed using ZEN Blue software (Carl Zeiss).
Genome data and software
P. denitrificans Pd1222 genome data were obtained from GenBank (GenBank assembly accession: GCA_000203895.1) and used as a reference for prophage region prediction, DNA sequencing (DNA-seq), and RNA sequencing (RNA-seq) analyses. Docker (https://www.docker.com/) was used to run the bioinformatics software. Docker containers of software were obtained from the BioContainers Registry (Bai et al., 2021).
Prophage region prediction
The phage region in the P. denitrificans Pd1222 genome was predicted using PhiSpy software (version 4.2.19) (Akhter et al., 2012) with the VOGDB hmm file (release number vog206, https://vogdb.org/). Prior to predictions, the downloaded hmm files were merged into a single file and formatted into a binary format for PhiSpy using the hmmpress command in HMMER (version 3.3.2) (Eddy, 2011).
DNA extraction and sequencing
DNA was extracted from the isolated MV fraction using ISOPLANT (Nippon Gene) according to the manufacturer’s instructions. A Nextera XT DNA library preparation kit (Illumina) was used for paired-end libraries. DNA-seq was performed using an Illumina MiSeqTM system.
Low-quality read removal and adapter trimming of the raw FASTQ file obtained were performed using fastp software (version 0.20.1) (Chen et al., 2018) with the “-q 20 -3” options. The cleaned FASTQ file was mapped to the P. denitrificans Pd1222 genome using Bowtie2 (version 2.4.4). Prior to mapping, a FASTA file of the genome was indexed using the “Bowtie-build” command in Bowtie2. The resulting BAM files were indexed using SAMtools (version 1.12) (Li et al., 2009). A GTF file of the P. denitrificans Pd1222 genome partitioned into 1,000-bp windows was created using R script, and the number of reads mapped to every 1,000 bp in the genome was counted using featureCounts software (version 2.0.1) (Liao et al., 2014) with the GTF file and “-p -O -M -C -f -t region -g ID -s 0” options. The number of reads mapped to the gene was also counted with the GTF file of P. denitrificans Pd1222 and the “-p -O -M -C -f -t CDS -g gene_id -s 0” options.
RNA extraction and sequencing
Total RNA was extracted using the SV Total RNA Isolation System (Promega) from two biological replicates of P. denitrificans Pd1222 WT and ΔrecA cultured with or without MMC. Furthermore, we performed a DNase treatment to remove residual total DNA using DNase I, a recombinant, RNase-free solution (Roche). All processes were conducted according to the manufacturer’s instructions. RNA samples were sent to an outside facility (Macrogen) for library generation using the TruSeq Stranded Total RNA Library Preparation Kit (Illumina) and NEBNext rRNA Depletion Kit (Bacteria) (NEB), and were sequenced using the NovaSeq 6000 system (Illumina).
Low-quality read removal and adapter trimming of the raw FASTQ files obtained was performed using fastp software with the “-q 30 -3” options. A fasta file of the P. denitrificans Pd1222 genome was indexed with the GTF file of the genome using STAR software (version 2.7.5a) (Dobin et al., 2013) with the “--runMode genomeGenerate --sjdbGTFfeatureExon gene --genomeSAindexNbases 10” options, and the cleaned FASTQ files were mapped to the index using STAR with the “--outSAMtype BAM SortedByCoordinate --alignIntronMax 1” options. The BAM files obtained were indexed using SAMtools, and the number of reads mapped to each gene was counted using featureCounts software with the GFT file of the P. denitrificans Pd1222 genome and the “-p -O -M -C -f -t CDS -g gene_id -s 2” options.
The batch effect between replicates was corrected using ComBat-seq (Zhang et al., 2020) in the R package sva (version 3.38.0) (Leek et al., 2012), and a differential gene expression analysis was performed using the R package edgeR (version 3.32.1) with the corrected count data. Low expression levels of 14 genes were filtered out from the corrected count data using the filterByExpr function with default settings. Filtered count data were normalized using the trimmed mean of M-values method with the calcNormFactors function, and common, trended, and tagwise dispersions were estimated using the Cox-Reid profile-adjusted likelihood method with the estimateGLMCommonDisp, estimateGLMTrendedDisp, and estimateGLMTagwiseDisp functions, respectively. Differentially expressed genes were examined using the quasi-likelihood F-test with the glmQLFit and glmQLFTest functions, and p-values were adjusted using the Benjamini and Hochberg method with the topTags function.
Sequence deposition
Sequence data obtained in the present study have been deposited in the DNA Data Bank of Japan (DDBJ) Sequence Read Archive (DRA) under accession numbers DRA004929 and DRA013013 for DNA-seq and RNA-seq, respectively.
Protein identification
Proteins associated with MVs were identified as follows: Proteins were quantified with a BCA protein assay kit prior to SDS-PAGE, to adjust the amount of protein between samples. MV samples were mixed with an equivalent volume of a sample buffer containing 0.1 M Tris-HCl (pH 6.8), 20% (v/v) glycerol, 4% (w/v) SDS, 5% (v/v) 2-mercaptoethanol, and 0.2% bromophenol blue, and then incubated in a heat block (95°C, 5 min). Five micrograms of protein was applied to each lane of an SDS-polyacrylamide gel comprising a 4.5% stacking gel and 12% separating gel. Gels were stained with Coomassie Brilliant Blue and imaged using FUSION SL (Vilber-Lourmat). Protein bands were excised from the gel and in-gel digested with trypsin, followed by the addition of a carbamidomethyl group to the -SH groups of the cysteine residues in the peptides using iodoacetamide (Nagakubo et al., 2021). The resulting peptides were purified and concentrated using a Zip Tip (Merck Millipore). Peptides were then analyzed using matrix-assisted laser desorption/ionization time-of-flight mass spectrometry (MALDI-TOF MS). The mass spectra derived from these peptides were analyzed using the MASCOT database search (Matrix Science) against the proteobacteria protein database from the NCBI plot. Database searches were performed using trypsin cleavage specificity, with no possible miscleavage. The carbamidomethylation of cysteines was set as a fixed modification, and peptide tolerance was set as 100 ppm. The proteins derived from P. denitrificans Pd1222 that showed the highest MASCOT scores (above the significance threshold) were assigned to the bands.
C16-HSL bioassay
In the C16-HSL bioassay, C. violaceum VIR24/pPROBE-PvioA-gfp (Toyofuku et al., 2017b) and P. denitrificans Pd1222ΔpdnIΔpxm/pPLlas were used as C16-HSL reporter strains. In Pd1222 ΔpdnI/pPLlas, gfp(ASV) expression is induced in response to exogenous C12- to C18-HSL (Toyofuku et al., 2017b; Morinaga et al., 2018). Pxm is involved in extracellular matrix production in P. denitrificans Pd1222 (K. Morinaga, unpublished). Ten microliters of the filtered supernatants of the P. denitrificans Pd1222 culture was added to 1 mL of medium in each well of a 24-well flat-bottomed plate. Overnight cultures of the reporter strains were inoculated at an OD600 of 0.01. The supernatant and reporter strains were incubated at 400 rpm at 30°C for 12 h. Synthetic C16-HSL (Cayman Chemical) was added at final concentrations of 0–10 μM. After the incubation, the cell culture was centrifuged at 16,000×g at 4°C for 1 min. Cells were then washed, dissolved in PBS, and placed in a 96-well black plate (Grainer Bio-one). QS promoter activity was calculated by normalizing RFU (Ex/Em=475 nm/515 nm) with the OD600 value, measured using a Varioskan Flash Reader (Thermo Scientific).
C16-HSL quantification using liquid chromatography and mass spectrometry
Cell cultures were centrifuged at 6,000×g at 4°C for 20 min, and the supernatant was filtered using a polyvinylidene fluoride filter with a pore size of 0.22 μm to remove cells (resulting in the total supernatant). The total supernatant was ultracentrifuged at 150,000×g at 4°C for 1 h and further separated into MV pellets and the remaining supernatant. The pellet was dissolved and washed with 10 mM HEPES/0.85% NaCl and then ultracentrifuged at 150,000×g at 4°C for 1 h. The resulting precipitate was then suspended in the same buffer (producing the MV sample). C16-HSL was extracted as previously described (Morinaga et al., 2020). A three-fold volume of acidified ethyl acetate was added to each sample and mixed well. The solution was centrifuged at 6,000×g at 25°C for 1 min. The organic layer was collected and dried in a draft chamber. C16-HSL samples were dissolved in dimethyl sulfoxide. C16-HSL was quantified using high-performance liquid chromatography-mass spectrometry (HPLC-MS) (Buddrus-Schiemann et al., 2014). This analysis was performed using the Nexera X2 system and LCMS-8050 (Shimadzu) equipped with a Kinetex EVO C8 column (PHENOMENEX). The conditions used were as follows: flow rate, 0.2 mL min–1; temperature, 40°C; solvent A, 1% acetate; solvent B, acetonitrile. The sample was injected into the column, and C16-HSL was eluted from the column using the following gradient: 0–3 min, 60–98% solvent B; 3–9 min, 98% solvent B. After separation, C16-HSL was detected and quantified using the multiple reaction monitoring mode as follows: C16-HSL was fragmented into a product ion with an m/z value of 102.5, and this product ion was detected in the positive ion mode. The amount of C16-HSL in the sample was calculated using linear standard curves for the ion counts of the product ion with m/z 102.5, and the concentrations of synthetic C16-HSL (0–10 μM). Samples were analyzed in triplicate. C16-HSL concentrations were calculated as the mean value of triplicates.
Results and Discussion
DNA-damaging stress triggers MV formation in P. denitrificans through cell lysis
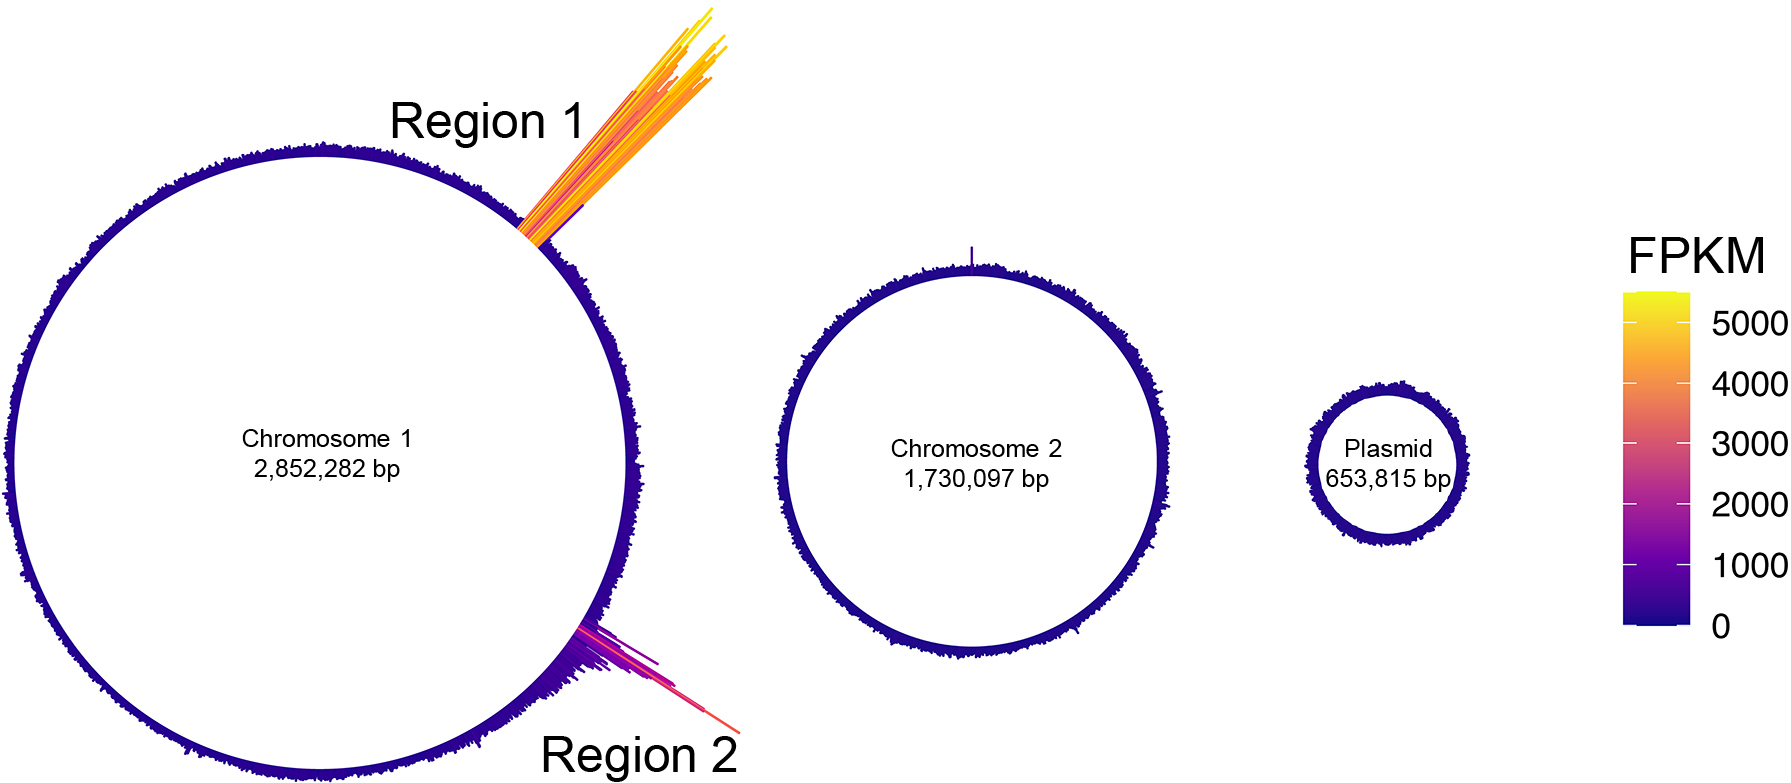
We initially investigated the production of MVs under the MMC treatment using super-resolution live-cell imaging. Live-cell imaging is a powerful approach for investigating the process of MV formation (Pirbadian et al., 2014; Turnbull et al., 2016; Toyofuku et al., 2017a). In the present study, MMC and FM4-64 were simultaneously added to the cell culture, and cells were placed on a TSB agar pad containing MMC and FM4-64 to stain the bacterial membrane. We observed that a subpopulation of cells produced MVs through cell lysis (Fig. 1, Fig. S1A, and Movie 1). A previous study reported that endolysin triggered explosive cell lysis in P. aeruginosa under DNA-damaging stress, during which cells became round in shape and exploded, resulting in a shattered membrane for the formation of MVs (Turnbull et al., 2016). In contrast, round cells were only observed in P. denitrificans Pd1222 under the conditions used, and rod cells were found to explode and release MVs without forming round cells. When different fractions of ultracentrifuged MV samples were inspected using TEM (Fig. S1B), the upper fraction (fraction I) was found to contain many MVs, whereas the lower fraction (fraction II) contained phage-like particles (Fig. S1C).

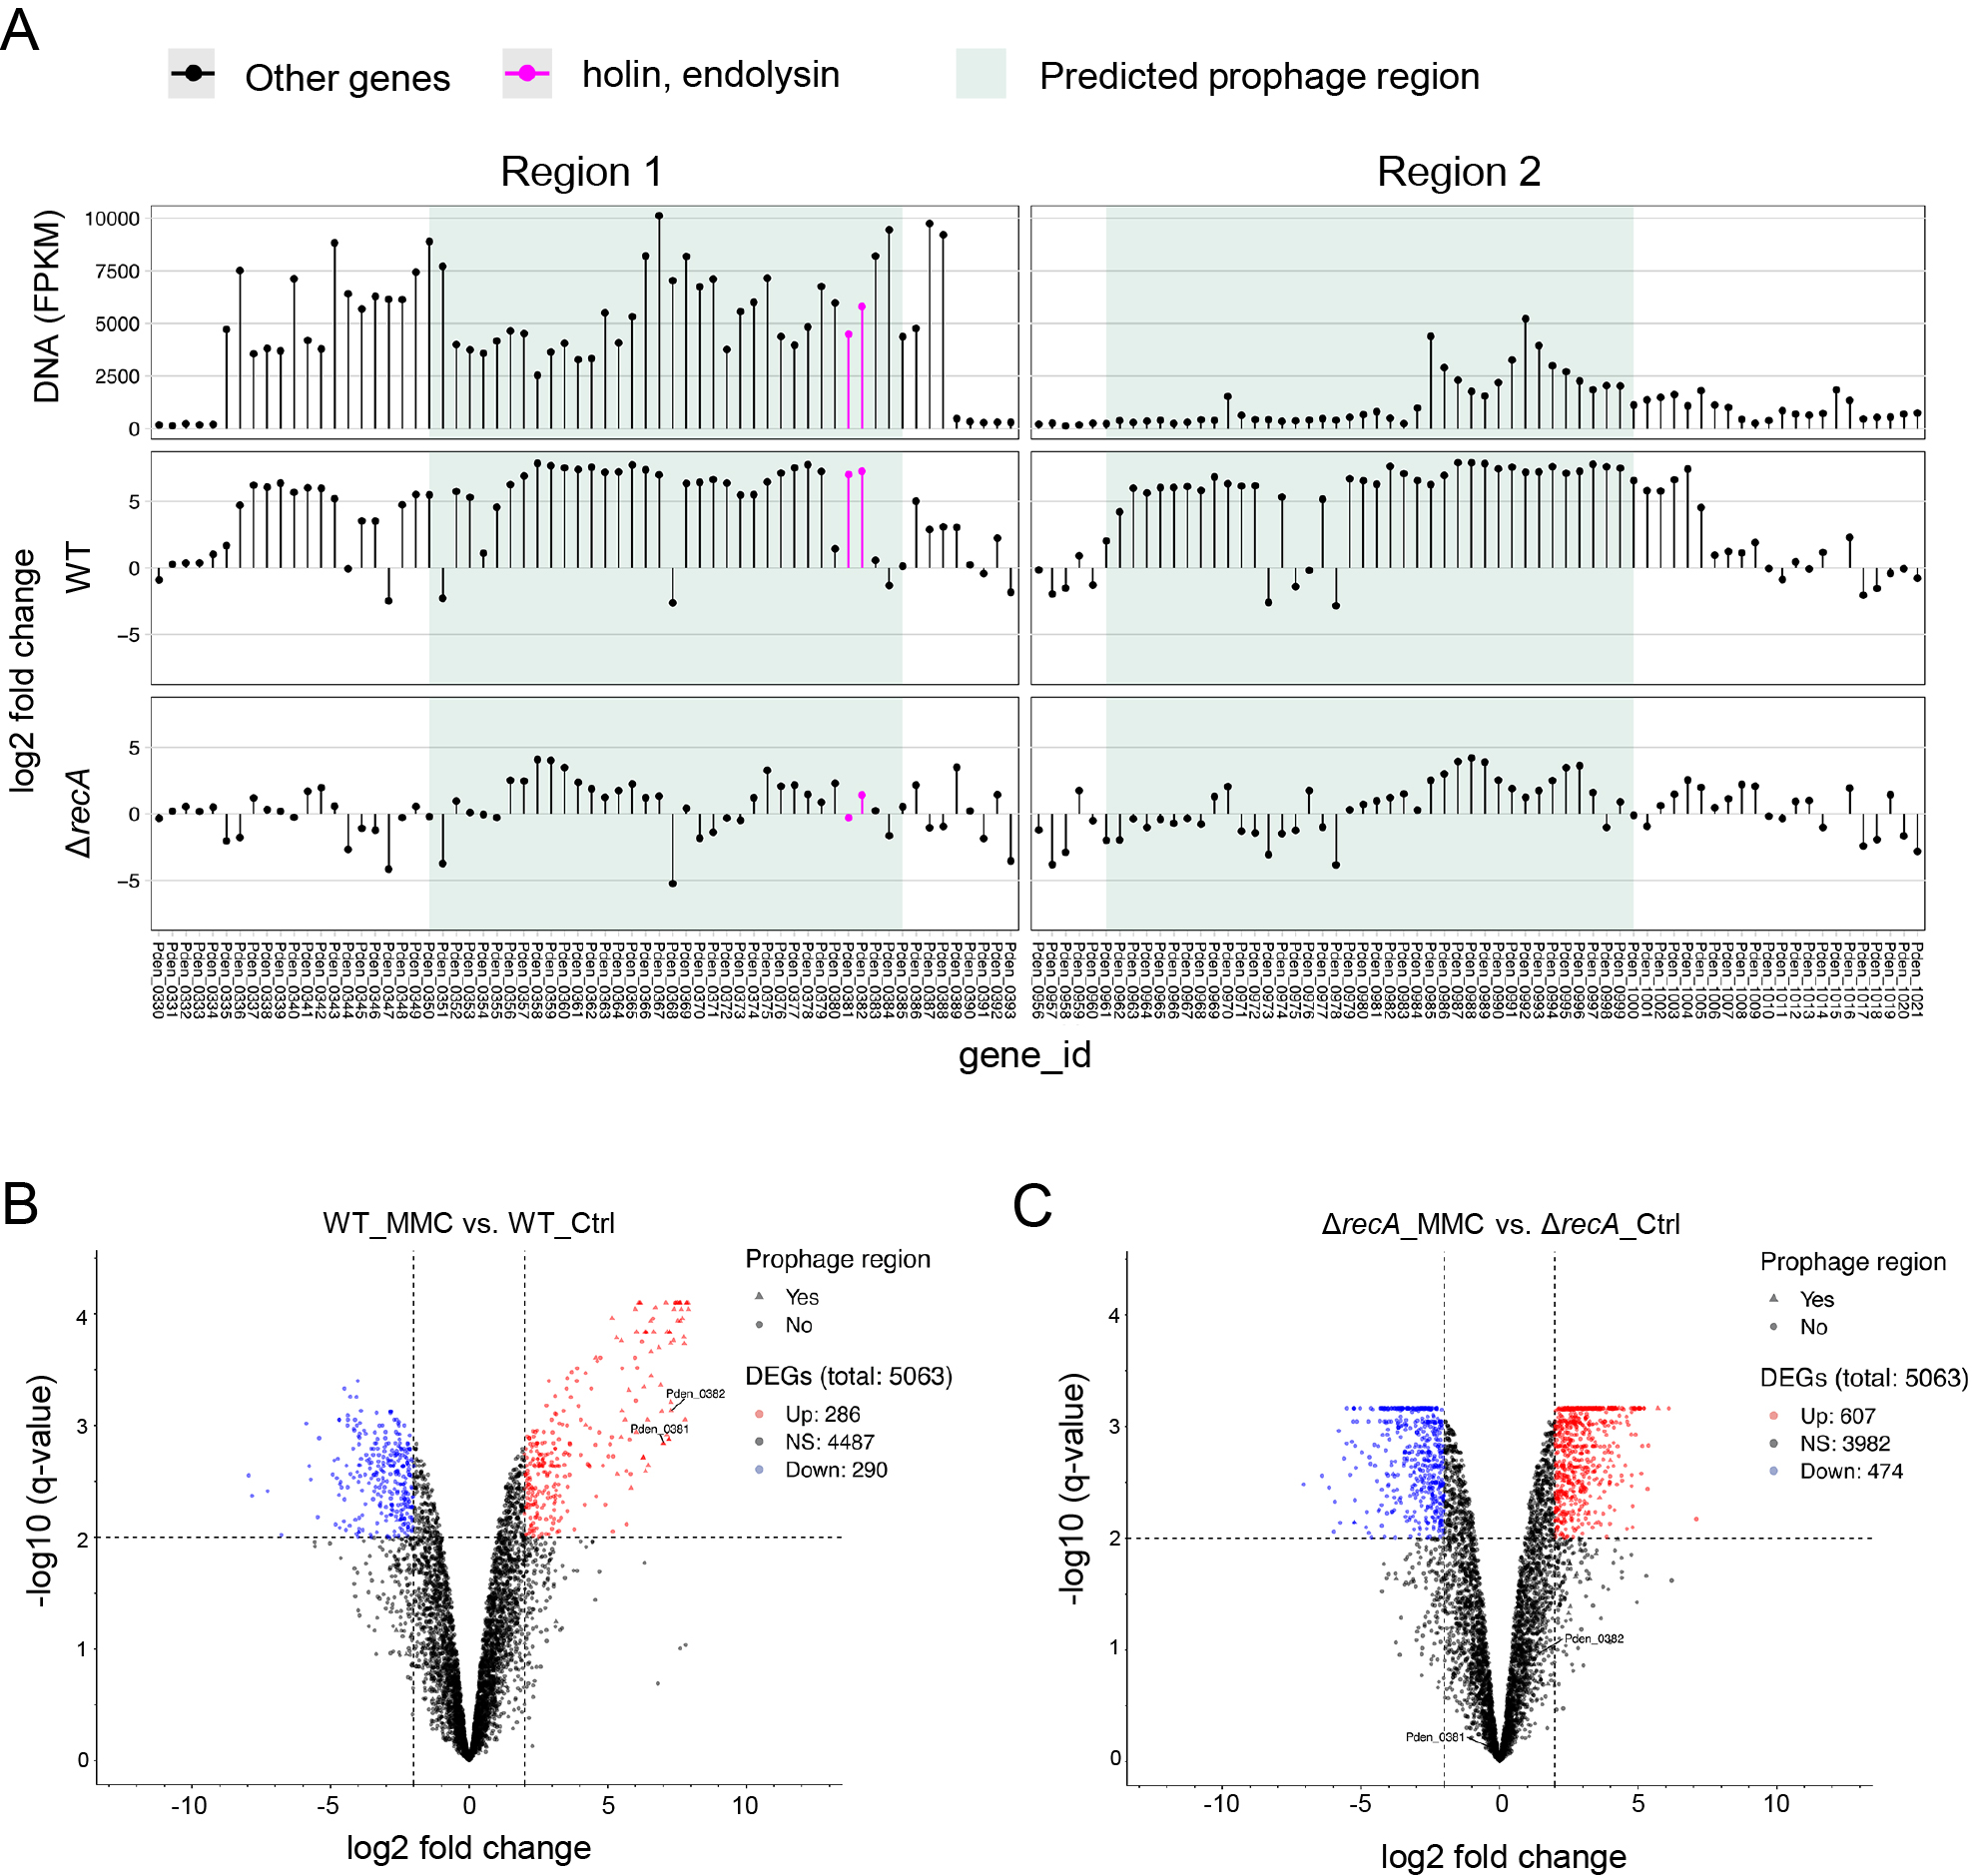
Previous studies demonstrated that holin and endolysin, which trigger MV formation, are encoded in the prophage region (Turnbull et al., 2016; Toyofuku et al., 2017a; Nagakubo et al., 2021). Therefore, we searched the prophage regions of the P. denitrificans Pd1222 genome for holin and endolysin genes (hol and lys) using PhiSpy, a bioinformatics tool that searches for prophages within bacterial genomes (Akhter et al., 2012). P. denitrificans has two chromosomes (CP000489.1: 2,852,282 bp and CP000490.1: 1,730,097 bp) and a large plasmid (CP000491.1: 653,815 bp). The PhiSpy analysis revealed four putative prophage regions on the chromosomes (Table 1). The gene, Pden_0381, encoding a protein that possesses a peptidoglycan degradation domain, a characteristic function of endolysin, was observed in Region 1 (Fig. S2A). Pden_0381 encodes a putative peptidoglycan-binding domain (E-value=0.024) and an N-acetylmuramoyl-l-alanine amidase domain (E-value=8.1e-11), as identified using the KEGG sequence similarity database (Fig. S2B). Since lys and hol have often been found in pairs in the genome, we analyzed Pden_0382, the adjacent gene of Pden_0381, using TMHMM server version 2.0 (Moller et al., 2001). Pden_0382 was estimated to have a single transmembrane domain (Fig. S2C), which is a typical feature of Class III holins (Young, 2002). These lys and hol sequences were not found in Regions 2-4.
Table 1.
List of predicted prophage regions in
Paracoccus denitrificans Pd1222.
| Putative prophage region |
Region length (bp) |
Region position |
| Chromosome 1 (CP000489.1) |
|
|
| Region 1 |
28,984 |
330,301 to 359,285 bp |
| Region 2 |
31,029 |
948,709 to 979,738 bp |
| Chromosome 2 (CP000490.1) |
|
|
| Region 3 |
12,819 |
49,990 to 62,809 bp |
| Region 4 |
28,242 |
876,103 to 904,345 bp |
Previous studies indicated that the content of MVs reflects the physiology of a cell (Toyofuku et al., 2012; Turnbull et al., 2016). Since prophage regions are often excised and replicated during the formation of phage particles, we hypothesized that by examining the DNA enriched in MVs, we may identify the phage region induced when MVs are formed (Gaudin et al., 2014). The DNA-seq of the MVs isolated from MMC-treated cells revealed the accumulation of prophage Regions 1 and 2 in MVs (Fig. 2). The peak detected in Region 1 showed a continuous increase in the number of reads, covering all of the prophage regions predicted by PhiSpy (Fig. 3A). In contrast, only parts of Region 2 were enriched in MVs.
Prophage genes are triggered in response to the MMC treatment
To identify the genes regulated upon DNA damage and those involved in MV formation, we conducted RNA-seq of cells exposed to MMC. RNA was isolated from cells treated with or without MMC. In total, 286 genes were up-regulated and 290 were down-regulated in response to MMC. As expected, many genes derived from the prophage region were up-regulated upon the addition of MMC (Table S3, Fig. 3A and B). We also found that the gene expression of Pden_0381 and Pden_0382, as described above, was significantly up-regulated.
recA is generally involved in prophage induction in other bacteria (Kidambi et al., 1996; Simmons et al., 2008; Binnenkade et al., 2014), and ΔrecA of P. denitrificans Pd1222 did not induce MV formation when treated with MMC (Toyofuku et al., 2017b) (Fig. 4A). We also analyzed the transcriptome of ΔrecA under the MMC treatment. Consistent with previous results, the expression of prophage genes, including Pden_0381 and Pden_0382, did not increase in ΔrecA when treated with MMC (Table S4, Fig. 3A and C). Collectively, these results suggest that the expression of endolysin (Pden_0381) and holin (Pden_0382) was up-regulated by RecA upon the MMC treatment and triggered MV formation.
Prophage genes are responsible for MV production under DNA-damaging stress
To establish whether Pden_0381 and Pden_0382 are involved in MV formation, we constructed mutants of these genes and measured their MV production. In contrast to WT, ΔPden_0381 did not show a dose-dependent increase in MV production (Fig. 4A). ΔPden_0382 showed an increase in MV production; however, the amount of MV in ΔPden_0382 was less than that in WT. These results indicate that Pden_0382 is partially functional — in contrast to Pden_0381, which is essential for MV formation under DNA-damaging stress. Nevertheless, the prophage genes that were crucial for MV induction under DNA-damaging stress, namely, ΔPden_0381, ΔPden_0382, and ΔrecA, showed no significant change in MV production from that in WT when MMC was not added (P>0.05) (Fig. 4). These results suggest that MVs are formed in P. denitrificans through various mechanisms that depend on the surrounding conditions. Recent studies reported that multiple routes for the formation of MVs lead to differences in MV components (Mashburn and Whiteley, 2005; Perez-Cruz et al., 2013; Turnbull et al., 2016; Toyofuku et al., 2017a). We analyzed the protein profiles of MVs produced with and without MMC using SDS-PAGE (Fig. S3) and attempted to identify characteristic protein bands that are specific to MMC-induced MVs by MALDI-TOF MS (Table S5). The results obtained showed that MMC-induced MVs contained typical inner membrane proteins associated with the respiratory chain (Fig. S3 and Table S5, Bands A, B, and C). The presence of inner membrane proteins is indicative of outer-inner MVs, which may also form upon the addition of a DNA-damaging agent in Stenotrophomonas maltophilia (Devos et al., 2017), presumably through cell lysis.
Following the addition of MMC, ΔPden_0381 and ΔrecA showed more “ghost” cells than WT (Fig. 4B, white arrows). Ghost cells are dead or dying cells characterized by a decrease in phase contrast due to the leakage of cytoplasmic components (Faridani et al., 2006; Pospisil et al., 2020). Along with the results shown in Fig. 1 and Movie 1, the absence of ghost cells in WT may be evidence for cell lysis by endolysin. In contrast, the ghost cells of ΔPden_0381 and ΔrecA remained and, thus, did not produce many MVs under DNA-damaging stress. In addition, cell elongation was observed even in the ΔrecA strain in response to MMC, which indicated that cell elongation is not regulated by RecA in this bacterium (Fig. 4B), in contrast to that in other bacteria whose cell elongation is regulated by RecA (Ogino et al., 2008; Keyamura et al., 2013).
Pden_0381 and Pden_0382 are both required to trigger MV production
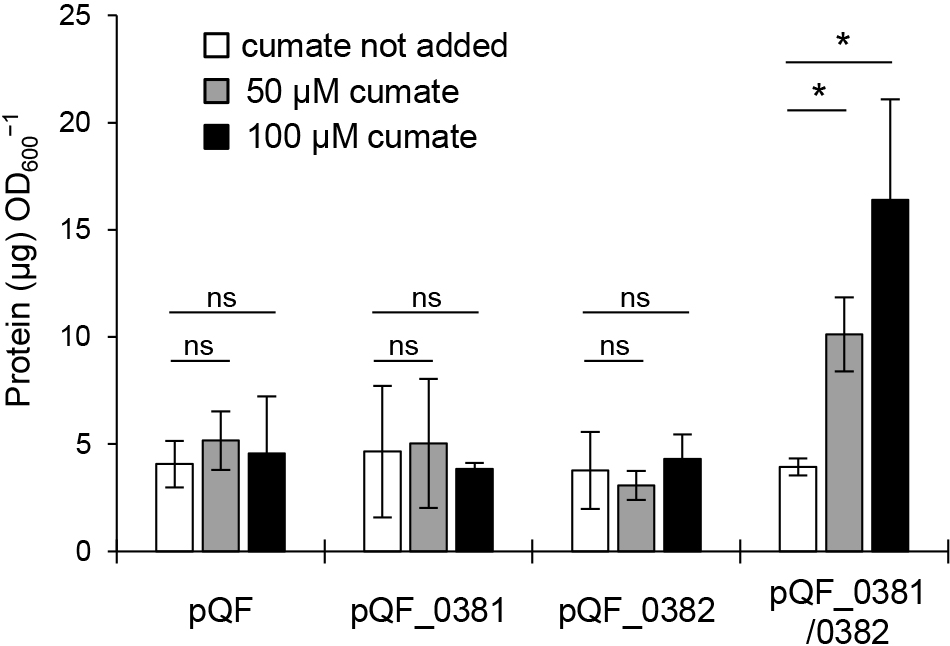
To confirm that Pden_0381 and Pden_0382 induce MV production, we expressed these genes under an inducible promoter using pQF. pQF contains the cym/cmt system from Pseudomonas putida F1 and induces the expression of target genes upon the addition of cumate into the cell culture (Kaczmarczyk et al., 2013). The induction of Pden_0381 or Pden_0382 alone did not increase MV production (Fig. 5). In contrast, MV production increased when the expression of Pden_0381 and Pden_0382 was induced in the same cell. These results indicate that holin is vital for endolysin to trigger MV formation. This is consistent with previous findings showing that holin was required for the translocation of endolysin into the periplasmic space (Young and Blasi, 1995). Although Pden_0381-deficient cells lacked the ability to induce MV production in response to the addition of MMC, Pden_0382-deficient cells only exhibited a partial reduction in their ability to induce MV production (Fig. 4A). This result implies that there are multiple holins in P. denitrificans Pd1222, which is consistent with previous findings on P. aeruginosa (Hynen et al., 2021).
We previously revealed that C16-HSL accumulated in cells and MVs in P. denitrificans and was trafficked between cells via MVs (Toyofuku et al., 2017b). Based on the results shown in Fig. 1 and Movie 1, P. denitrificans released MVs through cell lysis under DNA-damaging stress. Therefore, we hypothesized that increased MV production via prophage genes may promote C16-HSL release into the supernatant and further stimulate bacterial communication. To investigate this possibility, we measured the amount of C16-HSL in the supernatant after the addition of MMC and compared it with that in the mutants.
We initially performed a C16-HSL bioassay using the long-chain AHL reporter strain, C. violaceum VIR24/pPROBE-PvioA-gfp (Toyofuku et al., 2017b). The cell-free supernatant was obtained from the final cell culture following the treatment with MMC and was then added to the reporter strains. ΔPden_0381 and ΔrecA showed no significant changes in C16-HSL concentrations in the supernatant with or without MMC (Fig. S4). In contrast, WT released more C16-HSL into the supernatant in response to MMC. This increase in C16-HSL concentrations in the supernatant corresponded to MV production under DNA-damaging stress (Fig. 4A).
We further fractionated the supernatant and examined the localization of C16-HSL by quantifying it with HPLC. After an incubation with or without MMC, supernatants were collected and MVs were isolated. In accordance with the results shown in Fig. S4, more C16-HSL was detected in the total supernatant (supernatant containing MVs) of WT treated with MMC than in that of untreated WT (Fig. 6A). An increase in C16-HSL levels was also observed in the MV fraction (Fig. 6B). This increase in C16-HSL was not detected in the ΔPden_0381 or ΔrecA mutants, indicating that the release of C16-HSL into the supernatant was triggered by MV formation through endolysin. C16-HSL concentrations in the supernatant were lower than those in our previous study (Toyofuku et al., 2017b), which may be attributed to the different culture conditions employed.

We also examined whether the QS promoter activity of P. denitrificans was stimulated by inducing MV formation. The supernatant of P. denitrificans was collected and added to an AHL reporter strain of P. denitrificans. Accordingly, QS promoter activity in the reporter strain increased with the addition of the WT supernatant in proportion to the amount of MMC (Fig. 6C). This was not observed when the supernatant was collected from ΔPden_0381 or ΔrecA, which suggested that MVs released by the action of endolysin triggered the QS response in P. denitrificans.
Collectively, the present results demonstrated that the release of QS signals may be stimulated by a prophage gene through the formation of MVs. A recent study reported that virulent phages also induce the formation of MVs in E. coli (Mandal et al., 2021). This has yet to be confirmed in P. denitrificans Pd1222, but implies that C16-HSL may be released not only by triggering the prophage gene, but also by phage infection via MVs. Recent studies reported that phages communicate through signaling molecules to control other phage populations. Silpe and Bassler demonstrated that VP882 influenced the lysis-lysogeny fate by recognizing host-produced QS signaling molecules in Vibrio cholerae (Silpe and Bassler, 2019). Furthermore, Erez et al. revealed a phage-to-phage communication system called the arbitrium system (Erez et al., 2017). Although it currently remains unclear whether the promotion of the QS cascade by a prophage gene in P. denitrificans Pd1222 benefits bacteria or phages, the present study provides further insights into the interplay between phages and bacteria. Moreover, given their abundance in nature, our results imply that phages play an important role in MV-mediated bacterial interactions.
Citation
Yasuda, M., Yamamoto, T., Nagakubo, T., Morinaga, K., Obana, N., Nomura, N., and Toyofuku, M. (2022) Phage Genes Induce Quorum Sensing Signal Release through Membrane Vesicle Formation. Microbes Environ 37: ME21067.
https://doi.org/10.1264/jsme2.ME21067
Acknowledgements
M.Y. was supported by a Grant-in-Aid for Scientific Research (19JS20550) from the Japanese Society for the Promotion of Science (JSPS). N.N. was supported by the Japan Science and Technology Agency ERATO (JPMJER1502). M.T. was supported by a Grant-in-Aid for Scientific Research (19H02866 and 19K22411) from the Ministry of Education, Culture, Sports, Science and Technology of Japan (MEXT) and the Suntory Rising Stars Encouragement Program in Life Sciences (SunRiSE). This work was supported by MEXT KAKENHI (221S0002). We would like to thank Prof. Ken Kurokawa, Prof. Tetsuya Hayashi, and Prof. Yoshitoshi Ogura for DNA sequencing. We thank the Life Science Center for Survival Dynamics and the Open Facility Network Office, Research Facility Center for Science and Technology, University of Tsukuba, for allowing us to use UltrafleXtreme-ETA MALDI-TOF MS (Bruker), especially Ms. Mitsue Arimoto for her proficient technical assistance and helpful suggestions. We would like to express our gratitude to the Open Facility Network Office, Research Facility Center for Science and Technology, University of Tsukuba, for facilitating TEM observations in this study using the H7650 transmission electron microscope (Hitachi). We also thank Ms. Yoko Hagiwara for technical assistance.
References
- Akhter, S., Aziz, R.K., and Edwards, R.A. (2012) PhiSpy: a novel algorithm for finding prophages in bacterial genomes that combines similarity- and composition-based strategies. Nucleic Acids Res
40: e126.
- Bai, J., Bandla, C., Guo, J., Vera Alvarez, R., Bai, M., Vizcaino, J.A., et al. (2021) BioContainers registry: searching bioinformatics and proteomics tools, packages, and containers. J Proteome Res
20: 2056–2061.
- Binnenkade, L., Teichmann, L., and Thormann, K.M. (2014) Iron triggers lambdaSo prophage induction and release of extracellular DNA in Shewanella oneidensis MR-1 biofilms. Appl Environ Microbiol
80: 5304–5316.
- Brameyer, S., Plener, L., Muller, A., Klingl, A., Wanner, G., and Jung, K. (2018) Outer membrane vesicles facilitate trafficking of the hydrophobic signaling molecule CAI-1 between Vibrio harveyi cells. J Bacteriol
200: e00740-00717.
- Buddrus-Schiemann, K., Rieger, M., Muhlbauer, M., Barbarossa, M.V., Kuttler, C., Hense, B.A., et al. (2014) Analysis of N-acylhomoserine lactone dynamics in continuous cultures of Pseudomonas putida IsoF by use of ELISA and UHPLC/qTOF-MS-derived measurements and mathematical models. Anal Bioanal Chem
406: 6373–6383.
- Buroni, S., Pasca, M.R., Flannagan, R.S., Bazzini, S., Milano, A., Bertani, I., et al. (2009) Assessment of three Resistance-Nodulation-Cell Division drug efflux transporters of Burkholderia cenocepacia in intrinsic antibiotic resistance. BMC Microbiol
9: 200.
- Chan, Y.Y., Bian, H.S., Tan, T.M., Mattmann, M.E., Geske, G.D., Igarashi, J., et al. (2007) Control of quorum sensing by a Burkholderia pseudomallei multidrug efflux pump. J Bacteriol
189: 4320–4324.
- Chen, S., Zhou, Y., Chen, Y., and Gu, J. (2018) fastp: an ultra-fast all-in-one FASTQ preprocessor. Bioinformatics
34: i884–i890.
- Devos, S., Van Putte, W., Vitse, J., Van Driessche, G., Stremersch, S., Van Den Broek, W., et al. (2017) Membrane vesicle secretion and prophage induction in multidrug-resistant Stenotrophomonas maltophilia in response to ciprofloxacin stress. Environ Microbiol
19: 3930–3937.
- Dobin, A., Davis, C.A., Schlesinger, F., Drenkow, J., Zaleski, C., Jha, S., et al. (2013) STAR: ultrafast universal RNA-seq aligner. Bioinformatics
29: 15–21.
- Eddy, S.R. (2011) Accelerated Profile HMM Searches. PLoS Comput Biol
7: e1002195.
- Erez, Z., Steinberger-Levy, I., Shamir, M., Doron, S., Stokar-Avihail, A., Peleg, Y., et al. (2017) Communication between viruses guides lysis-lysogeny decisions. Nature
541: 488–493.
- Faridani, O.R., Nikravesh, A., Pandey, D.P., Gerdes, K., and Good, L. (2006) Competitive inhibition of natural antisense Sok-RNA interactions activates Hok-mediated cell killing in Escherichia coli. Nucleic Acids Res
34: 5915–5922.
- Gaudin, M., Krupovic, M., Marguet, E., Gauliard, E., Cvirkaite-Krupovic, V., Le Cam, E., et al. (2014) Extracellular membrane vesicles harbouring viral genomes. Environ Microbiol
16: 1167–1175.
- Hynen, A.L., Lazenby, J.J., Savva, G.M., McCaughey, L.C., Turnbull, L., Nolan, L.M., and Whitchurch, C.B. (2021) Multiple holins contribute to extracellular DNA release in Pseudomonas aeruginosa biofilms. Microbiology
167: 000990.
- Jan, A.T. (2017) Outer membrane vesicles (OMVs) of gram-negative bacteria: A perspective update. Front Microbiol
8: 1053.
- Kaczmarczyk, A., Vorholt, J.A., and Francez-Charlot, A. (2013) Cumate-inducible gene expression system for sphingomonads and other Alphaproteobacteria. Appl Environ Microbiol
79: 6795–6802.
- Keyamura, K., Sakaguchi, C., Kubota, Y., Niki, H., and Hishida, T. (2013) RecA protein recruits structural maintenance of chromosomes (SMC)-like RecN protein to DNA double-strand breaks. J Biol Chem
288: 29229–29237.
- Kidambi, S.P., Booth, M.G., Kokjohn, T.A., and Miller, R.V. (1996) recA-dependence of the response of Pseudomonas aeruginosa to UVA and UVB irradiation. Microbiology
142: 1033–1040.
- Leek, J.T., Johnson, W.E., Parker, H.S., Jaffe, A.E., and Storey, J.D. (2012) The sva package for removing batch effects and other unwanted variation in high-throughput experiments. Bioinformatics
28: 882–883.
- Li, H., Handsaker, B., Wysoker, A., Fennell, T., Ruan, J., Homer, N., et al. (2009) The sequence alignment/map format and SAMtools. Bioinformatics
25: 2078–2079.
- Liao, Y., Smyth, G.K., and Shi, W. (2014) featureCounts: an efficient general purpose program for assigning sequence reads to genomic features. Bioinformatics
30: 923–930.
- Mandal, P.K., Ballerin, G., Nolan, L.M., Petty, N.K., and Whitchurch, C.B. (2021) Bacteriophage infection of Escherichia coli leads to the formation of membrane vesicles via both explosive cell lysis and membrane blebbing. Microbiology
167: 001021.
- Mashburn, L.M., and Whiteley, M. (2005) Membrane vesicles traffic signals and facilitate group activities in a prokaryote. Nature
437: 422–425.
- Moller, S., Croning, M.D., and Apweiler, R. (2001) Evaluation of methods for the prediction of membrane spanning regions. Bioinformatics
17: 646–653.
- Morinaga, K., Yamamoto, T., Nomura, N., and Toyofuku, M. (2018) Paracoccus denitrificans can utilize various long-chain N-acyl homoserine lactones and sequester them in membrane vesicles. Environ Microbiol Rep
10: 651–654.
- Morinaga, K., Nagakubo, T., Nomura, N., and Toyofuku, M. (2020) Involvement of membrane vesicles in long-chain-AHL delivery in Paracoccus species. Environ Microbiol Rep
12: 355–360.
- Nagakubo, T., Tahara, Y.O., Miyata, M., Nomura, N., and Toyofuku, M. (2021) Mycolic acid-containing bacteria trigger distinct types of membrane vesicles through different routes. iScience
24: 102015.
- Ogino, H., Teramoto, H., Inui, M., and Yukawa, H. (2008) DivS, a novel SOS-inducible cell-division suppressor in Corynebacterium glutamicum. Mol Microbiol
67: 597–608.
- Pearson, J.P., Van Delden, C., and Iglewski, B.H. (1999) Active efflux and diffusion are involved in transport of Pseudomonas aeruginosa cell-to-cell signals. J Bacteriol
181: 1203–1210.
- Perez-Cruz, C., Carrion, O., Delgado, L., Martinez, G., Lopez-Iglesias, C., and Mercade, E. (2013) New type of outer membrane vesicle produced by the Gram-negative bacterium Shewanella vesiculosa M7T: implications for DNA content. Appl Environ Microbiol
79: 1874–1881.
- Pirbadian, S., Barchinger, S.E., Leung, K.M., Byun, H.S., Jangir, Y., Bouhenni, R.A., et al. (2014) Shewanella oneidensis MR-1 nanowires are outer membrane and periplasmic extensions of the extracellular electron transport components. Proc Natl Acad Sci U S A
111: 12883–12888.
- Pospíšil, J., Vítovská, D., Kofroňová, O., Muchová, K., Šanderová, H., Hubálek, M., et al. (2020) Bacterial nanotubes as a manifestation of cell death. Nat Commun
11: 4963.
- Schertzer, J.W., and Whiteley, M. (2012) A bilayer-couple model of bacterial outer membrane vesicle biogenesis. mBio
3: e00297-11.
- Shearer, N., Hinsley, A.P., Van Spanning, R.J., and Spiro, S. (1999) Anaerobic growth of Paracoccus denitrificans requires cobalamin: characterization of cobK and cobJ genes. J Bacteriol
181: 6907–6913.
- Silpe, J.E., and Bassler, B.L. (2019) A host-produced quorum-sensing autoinducer controls a phage lysis-lysogeny decision. Cell
176: 268–280 e213.
- Simmons, L.A., Foti, J.J., Cohen, S.E., and Walker, G.C. (2008) The SOS regulatory network. EcoSal Plus
3.
- Simon, R., O’Connell, M., Labes, M., and Pühler, A. (1986) Plasmid vectors for the genetic analysis and manipulation of rhizobia and other gram-negative bacteria. In Methods in Enzymology. Cambridge, MA: Academic Press, pp. 640–659.
- Thevenaz, P., Ruttimann, U.E., and Unser, M. (1998) A pyramid approach to subpixel registration based on intensity. IEEE Trans Image Process
7: 27–41.
- Toyofuku, M., Roschitzki, B., Riedel, K., and Eberl, L. (2012) Identification of proteins associated with the Pseudomonas aeruginosa biofilm extracellular matrix. J Proteome Res
11: 4906–4915.
- Toyofuku, M., Carcamo-Oyarce, G., Yamamoto, T., Eisenstein, F., Hsiao, C.C., Kurosawa, M., et al. (2017a) Prophage-triggered membrane vesicle formation through peptidoglycan damage in Bacillus subtilis. Nat Commun
8: 481.
- Toyofuku, M., Morinaga, K., Hashimoto, Y., Uhl, J., Shimamura, H., Inaba, H., et al. (2017b) Membrane vesicle-mediated bacterial communication. ISME J
11: 1504–1509.
- Turnbull, L., Toyofuku, M., Hynen, A.L., Kurosawa, M., Pessi, G., Petty, N.K., et al. (2016) Explosive cell lysis as a mechanism for the biogenesis of bacterial membrane vesicles and biofilms. Nat Commun
7: 11220.
- Whiteley, M., Diggle, S.P., and Greenberg, E.P. (2017) Progress in and promise of bacterial quorum sensing research. Nature
551: 313–320.
- Young, R., and Bläsi, U. (1995) Holins: form and function in bacteriophage lysis. FEMS Microbiol Rev
17: 191–205.
- Young, R. (2002) Bacteriophage holins: deadly diversity. J Mol Microbiol Biotechnol
4: 21–36.
- Zhang, Y., Parmigiani, G., and Johnson, W.E. (2020) ComBat-seq: batch effect adjustment for RNA-seq count data. NAR: Genomics Bioinf
2: lqaa078.