Abstract
Estuarine microbial assemblages are altered by a number of environmental factors, and knowledge of these changes is essential for understanding the functions of microbes in estuarine ecosystems. The aims of the present study were to examine the relationship between microbial assemblages in the water column and sediment surface, and to identify the environmental factors that influence the short-term dynamics of microbial assemblages in these two zones in summer in the inner part of Ariake Bay. The microbial assemblage of each sample consisted of a mean of 71.1% operational taxonomic units (OTUs), which commonly occurred in the water column and sediment surface, although their relative composition markedly differed between the two zones. In the water column, spatiotemporal changes in microbial assemblages correlated with several environmental factors, such as the nitrogen content in suspended particles, turbidity, and salinity. On the other hand, temporal changes in the sediment’s microbial assemblages were governed by a single environmental factor, namely, the oxygen reduction potential. These results suggest that the composition of microbial assemblages in the water column and sediment surface differed even in highly turbid brackish waters with high sediment resuspension, and the environmental factors contributing to the change in the assemblage composition also differed between the water column and sediment.
Ocean biogeochemical cycles are primarily governed by interactions between autotrophic and heterotrophic microbes (Sarmiento and Gruber, 2006); autotrophic phytoplankton actively produces organic matter within the filmly sun-lit layer, whereas heterotrophic bacteria, which are distributed from the surface water to the sediment, decompose organic matter by using it as a respiratory substrate. Due to the supply of diverse organic substrates, microbial processes are complex; each microbial species that specialize in different material cycles coexist in water and sediment (e.g., remineralization, nitrification, and sulfur reduction) (Kaku et al., 2005; Baker et al., 2012; Kirchman, 2012; Sakami, 2012). Consequently, the diversity and abundance of marine microbes are huge (>a million species and ~300 Pg of biomass) (Whitman et al., 1998; Curtis et al., 2002). Ocean physics and chemistry modify the distribution and activity of microbial communities, both in the water column and in sediment (Herlemann et al., 2011; Mahmoudi et al., 2015; Khandeparker et al., 2017; Qian et al., 2018). Dynamic coastal waters are one of the most suitable settings to study the interactions between microbes and the environment because they are characterized by sporadic large variations in temperature and salinity as well as by active organic matter production. In addition to sporadic large variations, water-sediment coupling stimulated by tidal mixing may be a significant factor controlling coastal microbial communities. The significant resuspension of sediment may modify physical and chemical properties, as well as the vertical microbial distribution, consequently affecting biogeochemical cycles and biological activities.
Ariake Bay is a semi-enclosed bay located on the western coast of Kyushu in western Japan, and has the largest tidal range in the country, which reaches a maximum of more than 6 m in the innermost area. There is an evident salinity gradient from the inner part of the bay to the bay mouth (Tsutsumi, 2006; Yanagi and Shimomura, 2006). Furthermore, a strong halocline is known to develop in the inner part of the bay, particularly during the rainy season between June and July (Tsutsumi, 2006; Orita et al., 2015). Moreover, environmental factors, such as water temperature, chlorophyll a (Chl-a), and dissolved oxygen (DO), differ between the upper and lower layers of the halocline in summer (Orita et al., 2015). The strong tidal current significantly resuspends sediment particles in the inner part of the bay at which mud flats are located, forming high-turbidity waters (Sato, 2010). Due to the large variations in turbidity associated with the cycle of spring and neap tides, the amount of sediment resuspended in the water column also changes in the short term, namely, every other week (Koh et al., 2006; Tanaka and Kodama, 2007; Hayami et al., 2019). As a result, environmental fluctuations frequently (i.e., weekly to monthly) occur in Ariake Bay, which modify microbial assemblages in the water column and sediment surface, particularly in the inner part of Ariake Bay in summer.
In the present study, weekly field surveys were conducted on four water layers (i.e., two layers above and below the halocline) and also on the sediment surface. The aims of this study were as follows: 1) to examine the relationship between microbial assemblages in the water column and sediment surface, and 2) to identify environmental factors that influence the short-term dynamics of microbial assemblages in both zones. In addition, the composition of their operational taxonomic units (OTUs) was compared every other week to identify relationships between the water column and sediment microbial assemblages in turbid estuary waters. Furthermore, the analysis considered the environmental factors contributing to spatiotemporal changes in microbial assemblages in the water column and on the sediment surface in summer in the inner part of Ariake Bay.
Materials and Methods
Field surveys
The study area is located in the inner part of Ariake Bay, Japan. To accurately capture the fluid marine environment, three replication sites were established within the study area (Fig. S1). The three sites, located approximately 400 m from each other, were arranged in a triangle and data on environmental factors in each survey were representative of the average of data from these three sites. In the analysis of microbial assemblages, the Site B sample was used as a representative of the study area (Fig. S1). The depth of the study area ranged between 12 and 15 m depending on the tide. A total of four field surveys were conducted, once every week between July 13, 2018 and August 3, 2018. At each sampling site, the vertical profiles of temperature, salinity, DO, turbidity, and Chl-a were measured every meter along the depth profile using multiple water quality sensors (AAQ1183; JFE Advantech), and sediment and water samples were also collected. Specifically, the latter were collected using a Van Dorn water sampler (Rigo) on the surface, at a depth of 2 m, as well as 2 and 0.5 m above the sea floor, and were stored separately for a microbial analysis (660 mL) and particulate organic matter (POM) quantification (100 mL). The water samples to be used for the microbial assemblage analysis were filtered through a 10-μm plankton net to remove large particles before storage in plastic bottles. Sediment samples were collected using a Smith-McIntyre grab sampler (22.5×22.5 cm2), and 10 plastic core samplers (diameter: 29 mm) were used to collect surface sediment up to a depth of 0.5 cm, which were homogenized in a plastic bag to form sediment samples. The in situ oxygen redox potential (ORP) of surface sediment was measured with an ORP meter (RM30P, DKK-TOA). All water and sediment samples were kept in a cooler box and brought back to the laboratory.
Sample analysis
Water samples for the microbial analysis were filtered through membrane filters (cellulose acetate membrane filters, Advantec, 47 mm in diameter, pore size 0.2 μm), and microbial DNA was extracted from the residues on the filters using an ISOIL for the Beads Beating kit (Nippon Gene). In the analysis of microbial assemblages, the V4–V5 region of the 16S rRNA gene was sequenced with the primer pair 515F (5′-GTGCCAGCMGCCGCGG-3′) and 907R (5′-CCGTCAATTCCTTTGAGTTT-3′). Paired-end libraries (paired-end sequenced 250×2) were sequenced using an Illumina HiSeq 2500 platform. The amount of sequence data for all samples was more than 100,000 reads (Mean: 142,660 reads, Max: 159,741 reads, Min: 113,310 reads). Raw sequencing data were deposited in DDBJ as DRA013351.
Water samples for the POM quantification were filtered through pre-combusted glass-fiber filters (25 mm in diameter; Whatman), which were then freeze-dried. After inorganic carbonates were eliminated with HCl, particulate organic carbon (POC) and particulate nitrogen (PN) were measured using a carbon-hydrogen/nitrogen (CHN) elemental analyzer (CHN coder JM-10; J-Science Lab).
Following the adequate homogenization of sediment samples, subsamples were divided to perform microbial (0.5 g) and physicochemical analyses. DNA extraction and DNA sequence analyses of sediment samples were performed using the same procedures as those for water samples. The physicochemical characteristics of sediment samples were evaluated in terms of the mud content, total organic carbon (TOC) and total nitrogen (TN) contents, and acid-volatile sulfide (AVS). The mud content of the sediment was assessed by wet sieving (the fraction <63 μm). In the analysis of TOC and TN contents, the sample was freeze-dried and powdered. After the removal of inorganic carbonates with HCl, the sample was re-dried, powdered, and TOC and TN contents were then measured using a CHN elemental analyzer. The measurement of AVS was conducted based on the methods described in Orita et al. (2015).
Data analysis
Reads were processed using the bioinformatic platform QIIME2, version 2019.7. Barcodes and adapter sequences and reads with low quality were removed using the “trimmomatic” tool (Bolger et al., 2014). Trimmed sequence data (threshold for trimming: ≥99%) were converted into the fasta format for taxonomic annotation. Taxonomic classification was conducted through the “Greengene” database, version gg-13-8-99nb-classifier.qza, released in 2013, with >97% similarity based on the 16S rRNA V4–V5 region.
To evaluate the similarity of the microbial assemblage composition, a cluster analysis based on the Bray–Curtis similarity (Bray and Curtis, 1957) was performed using the group average method. A redundancy analysis (RDA) was conducted to examine the primary environmental factors (temperature, salinity, DO, turbidity, Chl-a, POM, PN, and CN ratio) affecting microbial assemblages in the water column during the sampling period. Regarding data related to these environmental factors, the average obtained from the three replication sites was used as the representative value for the area (Table S1). In the RDA analysis, the Hellinger transformation was applied to microbial assemblage data (Legendre and Gallagher, 2001). The significance of the relationships between microbial assemblages and environmental factors was assessed by Monte Carlo permutation tests (999 randomized runs). PERMANOVA, with the Adonis function in the R package vegan, was used to examine the significance of differences between the microbial assemblage groups classified by RDA (Anderson, 2001). The SIMPER analysis was performed to evaluate the OTUs that contributed to differences between microbial assemblage groups in the sediment. Differences between the environmental factors of the sediment surface were tested using the Wilcoxon rank-sum test. All multivariate and statistical analyses were performed in R (version 4.0.3).
Results
Relationship between microbial assemblages in the water column and in the sediment
The number of OTUs included in the microbial assemblages in each sample ranged between 101 and 264, with a mean OTU count of 169.4 (Fig. 1). The total OTU count did not markedly change among sampling days or in the water column or surface sediment. The total OTU count varied with depth, with the maximum value in the water column being recorded in the 0.5-m layer above the seafloor every sampling day (layer 4 in Fig. 1). In addition, the total OTU count was slightly higher in surface sediment than in the water column.

The OTUs detected in both the water column and surface sediment accounted for 71.1% of all samples on average, 58.9 to 83.2% of the total OTUs in the water column, and 54.2 to 66.2% of the total OTUs in the sediment. The number of OTUs detected only in the water column ranged between 17 and 90 (16.8 to 41.1% of the total number of OTUs), and their proportion was slightly higher in the 0.5-m layer above the seafloor. The number of OTUs detected only in surface sediment ranged between 72 and 121, accounting for between 33.8 and 45.8% of the total number of OTUs occurring in sediment. OTUs detected only in the water column or surface sediment were markedly smaller as a relative composition of the microbial assemblage (water-specific OTUs: 1~6%, sediment-specific OTUs: 7~13%, Fig. S2).
The microbial assemblage composition during the monitoring period markedly differed between the water column and sediment (Fig. 2). Furthermore, the assemblage composition within the water column differed between the first week and other weeks, whereas that within sediment differed between the second week and other weeks. Since the assemblage composition and its temporal variations differed between the water column and sediment, the environmental factors involved in changes in the microbial assemblage were analyzed separately in the following sections.
Environmental factors affecting microbial assemblages in the water column
The microbial assemblages in the four layers of the water column during the monitoring period were divided into four groups by RDA (Fig. 3). The classified assemblage groups (Group I: 2W-L1, 2W-L2, 3W-L1, 3W-L2, 4W-L1, and 4W-L2; Group II: 2W-L3, 2W-L4, 3W-L3, 3W-L4, 4W-L3, and 4W-L4; Group III: 1W-L1 and 1W-L2; and Group IV: 1W-L3 and 1W-L4) showed significantly different compositions among the groups (PERMANOVA, P<0.001), which was consistent with the results of the cluster analysis (Fig. S3). The top three dominant OTUs in each group and their compositions were as follows: Synechococcus (30.0%), Rhodobacteraceae (8.0%), Pelagibacter ubique (7.2%), and other Pelagibacteraceae (7.2%) in Group I; Rhodobacteraceae (13.7%), OCS155 (9.7%), and Flavobacteriaceae (9.0%) in Group II; Cyclobacteriaceae (14.4%), Stramenopiles (13.9%), and Rhodobacteraceae (12.0%) in Group III; and Cyclobacteriaceae (41.7%), Synechococcus (14.6%), and Candidatus Aquiluna rubra (8.2%) in Group IV (Table 1).
Table 1.
Dominant OTUs of four microbial groups in the water column classified by RDA.
| Rank |
Group I |
|
Group II |
|
Group III |
|
Group IV |
| OTUs |
RCa |
CCb |
OTUs |
RCa |
CCb |
OTUs |
RCa |
CCb |
OTUs |
RCa |
CCb |
| 1 |
Synechococcus |
30.0 |
30.0 |
|
Rhodobacteraceae |
13.7 |
13.7 |
|
Cyclobacteriaceae |
14.4 |
14.4 |
|
Cyclobacteriaceae |
41.7 |
41.7 |
| 2 |
Rhodobacteraceae |
8.0 |
38.0 |
|
OCS155 |
9.7 |
23.4 |
|
Stramenopiles |
13.9 |
28.3 |
|
Synechococcus |
14.6 |
56.3 |
| 3 |
Pelagibacter ubique |
7.2 |
45.2 |
|
Flavobacteriaceae |
9.0 |
32.4 |
|
Rhodobacteraceae |
12.0 |
40.3 |
|
Candidatus Aquiluna rubra |
8.2 |
64.5 |
| 4 |
other Pelagibacteraceae |
7.2 |
52.4 |
|
Synechococcus |
8.3 |
40.7 |
|
Flavobacteriaceae |
8.3 |
48.6 |
|
Rhodobacteraceae |
7.0 |
71.5 |
| 5 |
Stramenopiles |
5.7 |
58.1 |
|
other Pelagibacteraceae |
4.2 |
44.9 |
|
Pelagibacter ubique |
5.0 |
53.6 |
|
Flavobacteriaceae |
6.7 |
78.2 |
| 6 |
Flavobacteriaceae |
5.2 |
63.3 |
|
Cryomorphaceae |
4.0 |
48.9 |
|
OCS155 |
4.3 |
57.9 |
|
Stramenopiles |
4.0 |
82.2 |
| 7 |
OCS155 |
4.6 |
67.9 |
|
Pelagibacter ubique |
3.7 |
52.6 |
|
Synechococcus |
3.6 |
61.5 |
|
Cryomorphaceae |
2.9 |
85.1 |
| 8 |
Cryomorphaceae |
3.3 |
71.2 |
|
Balneola |
3.3 |
55.9 |
|
Nitrosopumilus |
3.0 |
64.5 |
|
Fluviicola |
2.3 |
87.4 |
| 9 |
Balneola |
2.4 |
73.6 |
|
Coccinimonas marina |
2.6 |
58.5 |
|
Ruegeria |
2.5 |
67.0 |
|
Altererythrobacter ishigakiensis |
0.9 |
88.3 |
| 10 |
Mamiellaceae |
2.1 |
75.7 |
|
Tenacibaculum |
2.3 |
60.8 |
|
Cryomorphaceae |
2.2 |
69.2 |
|
Algoriphagus aquatilis |
0.8 |
89.1 |
|
Others |
24.3 |
100.0 |
|
Others |
39.2 |
100.0 |
|
Others |
30.8 |
100.0 |
|
Others |
10.9 |
100.0 |
a Relative composition (%)
b Cumulative composition (%)

The environmental factors affecting the composition of microbial assemblages in the water column were evaluated using temperature, salinity, DO, turbidity, Chl-a, POC, PN, and the CN ratio of POM (Table S1). RDA outputs showed that four variables significantly accounted for the differences observed among the four assemblage groups, namely, PN, turbidity, salinity, and the CN ratio of POM (Monte Carlo permutation tests, P<0.001, P<0.01, P<0.01, and P<0.05, respectively). Groups I and II presented environmental characteristics with higher CN ratios of POM and lower PN than Groups III and IV. Furthermore, Groups I and IV showed lower salinity and turbidity than Groups II and III.
Environmental factors affecting microbial assemblages in surface sediment
The microbial assemblage in surface sediment was divided into two groups by a cluster analysis: Group A consisting of 2W-S and Group B consisting of 1W-S, 3W-S, and 4W-S (Fig. 4). The top three dominant OTUs in each group and their compositions were as follows: Sulfurimonas (7.6%), Desulfuromonadaceae (7.6%), and GCA004 (5.0%) in Group A; and Piscirickettsiaceae (11.8%), Desulfobulbaceae (7.0%), and Desulfococcus (5.1%) in Group B (Table 2). The differences observed between microbial assemblage groups were due to decreases in Piscirickettsiaceae and Desulfobulbaceae (contributions: 7.1 and 3.6%, respectively) and increases in Sulfurimonas, Desulfuromonadaceae, and Fusibacter (contributions: 6.6, 5.9, and 3.8%, respectively) in Group A from those in Group B.
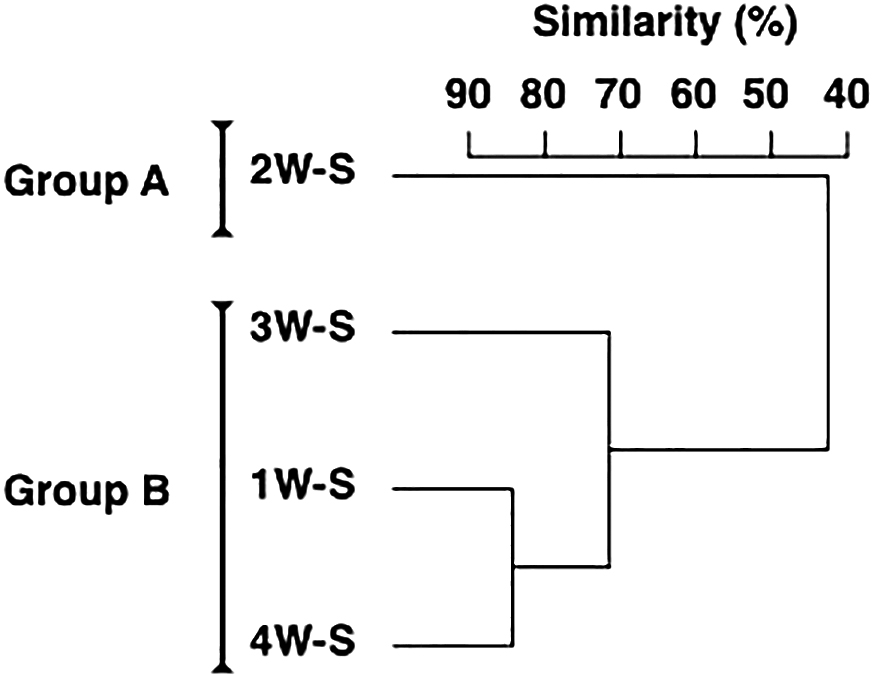
Table 2.
Dominant OTUs of two sediment microbial groups classified by a cluster analysis. The main OTUs contributing to differences between groups were evaluated using SIMPER.
| Rank |
Group A |
|
Group B |
|
Influential OTUs |
Contr.
(%) |
| OTUs |
RCa |
CCb |
OTUs |
RCa |
CCb |
| 1 |
Sulfurimonas |
7.6 |
7.6 |
|
Piscirickettsiaceae |
11.8 |
11.8 |
|
Piscirickettsiaceae |
7.1 |
| 2 |
Desulfuromonadaceae |
7.6 |
15.2 |
|
Desulfobulbaceae |
7.0 |
18.8 |
|
Sulfurimonas |
6.6 |
| 3 |
GCA004 |
5.0 |
20.2 |
|
Desulfococcus |
5.1 |
23.9 |
|
Desulfuromonadaceae |
5.9 |
| 4 |
Fusibacter |
4.3 |
24.5 |
|
Marinicellaceae |
4.7 |
28.6 |
|
Fusibacter |
3.8 |
| 5 |
Helicobacteraceae |
4.0 |
28.5 |
|
GCA004 |
3.5 |
32.1 |
|
Desulfobulbaceae |
3.6 |
| 6 |
Photobacterium |
3.9 |
32.4 |
|
other Gammaproteobacteria |
3.2 |
35.3 |
|
Helicobacteraceae |
3.4 |
| 7 |
Piscirickettsiaceae |
3.6 |
36.0 |
|
Stramenopiles |
3.2 |
38.5 |
|
Photobacterium |
3.4 |
| 8 |
other Bacteroidetes |
3.5 |
39.5 |
|
Chromatiales |
3.0 |
41.5 |
|
Desulfococcus |
2.9 |
| 9 |
Bacteroidales |
3.2 |
42.7 |
|
other Deltaproteobacteria |
2.5 |
44.0 |
|
other Bacteroidetes |
2.7 |
| 10 |
Desulfobulbaceae |
2.8 |
45.5 |
|
OS-K |
2.4 |
46.4 |
|
Stramenopiles |
2.6 |
|
Others |
54.5 |
100.0 |
|
Others |
53.6 |
100.0 |
|
Total |
42.0 |
a Relative composition (%)
b Cumulative composition (%)
To examine the environmental factors corresponding to the two sediment microbial assemblage groups divided by the cluster analysis, the environmental factors of surface sediment were compared between the groups (Fig. 5). Only the ORP significantly differed between microbial assemblage groups among the environmental factors of surface sediment, with mean values of –180.0 and –169.8 mV for Groups A and B, respectively (Wilcoxon rank-sum test, P<0.05).
Discussion
Relationship between microbial assemblages in the water column and sediment
The present study demonstrated water-sediment coupling in shallow turbid water, inferred from the co-occurrence of ~70% of microorganisms, found both in the water column and in surface sediment, using a high-throughput sequence analysis (Fig. 1). Although a few studies reported the proportion of OTUs shared between communities in water and those in sediment, a meta-analysis revealed that communities in coastal waters shared an average of only 7.2% OTUs with the communities in sediment (Zinger et al., 2011). In addition, a study conducted on the Yellow River, which is a highly turbid river, also found low numbers of shared OTUs between the communities in water and those in sediment (Xia et al., 2014). The high percentage of OTUs commonly found in water and sediment samples in the present study may be unique to the estuaries at which vertical mixing frequently occurs with large tides. While the proportion of OTUs present in water and sediment was high, the composition and diversity of microorganisms differed between these two environments (Fig. 1 and 2). Multiple studies have reported this difference, and diversity in the microbial community in some cases was greater in sediment than in water (e.g., coastal water [Zinger et al., 2011], an estuary [Feng et al., 2009; Zhang et al., 2014; Wei et al., 2016], hot spring [Cole et al., 2013], lake [Ye et al., 2009], and river [Staley et al., 2015]), while the opposite was shown in other cases (e.g., a river [Xia et al., 2014] and open sea [Walsh et al., 2016]). The present study detected higher OTU numbers in sediment than in the water column, which is consistent with the findings of previous studies conducted on coastal water and estuaries.
Environmental factors affecting microbial assemblages in the water column
The first axis of the RDA reflected differences in sampling dates, namely, the first week and following weeks (Fig. 3). Between July 6 and 7, 2018, one week before sampling, daily mean flow from the Chikugo River, the largest river flowing into Ariake Bay, reached 2589.1~3887.5 m3 s–1 due to heavy rainfall (Ministry of Land, Infrastructure, Transport and Tourism, 2021). On day 1 of sampling, flow was recorded at 172.1 m3 s–1, the highest during the sampling period (after the second sampling, flow ranged between 52.4 and 106.9 m3 s–1). Therefore, the influence of this runoff may have been greater during the first week of sampling. The aquatic environment at this time showed higher turbidity in the water column and lower salinity as well as higher Chl-a in the surface layers than in the other sampling weeks (Table S1 and Fig. S4). In addition, the amounts of POC and PN in each layer in the water column were high in the first week (Table S1), and the CN ratio of POM suggested that a large amount of phytoplankton-derived organic matter was produced (Meyers, 1994). The microbial assemblage groups in the first week corresponded to Groups III and IV, which were both dominated by Cyclobacteriaceae (Table 1). Although this bacterial family is very versatile, some of its species are known to markedly increase their biomass after algal blooms (Eckert et al., 2012; Fu et al., 2020). During the sampling period, the occurrence of bloom by diatoms (taxa [maximum cell density]: Skeletonema spp. [167,600 cells mL–1], Thalassiosira spp. [1,480 cells mL–1], Chaetoceros spp. [4,490 cells mL–1]) was reported in the study area (Kyushu Fisheries Coordinate Office, 2018). Therefore, Cyclobacteriaceae in this study may be copiotrophic when organic matter is supplied from autotrophic phytoplankton.
The second axis of the RDA reflected the difference in water depth, with positive and negative values indicating the upper and lower two layers, respectively (Fig. 3). On all sampling days, the thermocline and halocline were observed at a depth of between 3 and 5 m (Fig. S4); therefore, the upper and lower two layers in the present study represented different water mass environments within the water column. The surface layer presented lower salinity, a higher water temperature, and a higher DO environment than the bottom layer (Fig. 3 and Table S1). The microbial assemblage group on the surface (Group I) was dominated by Synechococcus and Rhodobacteraceae (as well as Pelagibacter ubique), which may partially include light-related bacteria. The genus Synechococcus comprises autotrophic cyanobacteria; therefore, species belonging to this genus were predominant in the two surface layers for oxygenic photosynthesis. Moreover, some Rhodobactericeae (e.g., Rhodobacter spp.) contain bacteriochlorophylls for their aerobic anoxygenic photosynthetic activity (Deisenhofer et al., 1985; Pujalte et al., 2014; Pohlner et al., 2019). In addition, Synechococcus negatively correlated with salinity (Table S3). The capacity of Synechococcus to adapt to changes in salinity was previously reported to be high (Kim et al., 2018), and this characteristic may also be a reason for its dominance in low-salinity surface layers. A member of the most commonly distributed bacteria SAR11, Pelagibacter, particularly P. ubique, may also utilize light energy via proteorhodopsin (Steindler et al., 2011) for proton pumping and the consequent generation of ATP (Béjá et al., 2001; Sabehi et al., 2005). On the other hand, Group II, corresponding to the microbial assemblage group of the bottom layer, was dominated by Rhodobacteraceae and OCS155 as well as Flavobacteriaceae. Rhodobactraceae were predominant in the bottom layers, while also being abundant in the sun-lit upper layers. This microbial family has a highly diverse physiology and ecology (Pujalte et al., 2014), and the species found in the bottom layers may have either fallen to the bottom from the upper layer or may have actively grown by switching to heterotrophy. Flavobacteriaceae and OCS155 were previously reported to proliferate with a supply of organic detritus (e.g., senescent/dead algal cells) (Bernardet and Bowman, 2006; Alonso et al., 2007; Mann et al., 2013; Chen et al., 2016; Easson and Lopez, 2019), indicating that heterotrophic bacteria were dominant in the light-limited bottom layer.
Environmental factors affecting microbial assemblages in surface sediment
Sulfurimonas, Desulfuromonadaceae, Piscirickettsiaceae, and Desulfobulbaceae were mostly found in the sediment (Table 1 and 2). Among them, Sulfurimonas oxidize sulfur compounds, while Desulfuromonadaceae and Desulfobulbaceae reduce them and, together, these bacterial species are involved in sulfur cycling in sediment (Rodriguez-Mora et al., 2015; Suter et al., 2018; see also van Vliet et al., 2021). The composition of bacteria involved in the sulfur cycle has been reported to vary with salinity (Kondo et al., 2007). In the present study, changes in salinity were observed in the surface layer of the water column during the sampling period, while few changes were noted in salinity in the bottom waters (Table S1), suggesting that changes in the bacterial assemblages involved in the sulfur cycle were caused by other factors. Sulfur oxidation/reduction generally indicates a lack of major electron donors (i.e., oxygen and manganese); therefore, the sulfur cycle is activated by the redox state in the sediment becoming more reductive (Emerson and Hedges, 1988; Reimers et al., 1992; Takii et al., 2002; Sarmiento and Gruber, 2006). Since the DO of the bottom water during the sampling period was hypoxic (Table S1), sulfur-related bacteria may have been dominant in surface sediment. Furthermore, increases in bacteria associated with sulfur cycling contributed to the difference in the sediment assemblage composition in the second week when the ORP was more reduced (Fig. 4 and 5). Microbial assemblages in surface sediment were similar between the first and fourth weeks, indicating the process of gradual recovery from the changed composition in the second week to the original composition of the microbial assemblage (Fig. 4). The results of the present study indicate that changes in the redox environment markedly affected microbial communities in estuarine sediment, and that changes in microbial compositions in surface sediment, which were associated with the reduction of bottom sediment, occurred in less than one week, while changes in the microbial composition after recovery from this reduction may take approximately two weeks.
Conclusions
In the present study, weekly field surveys were conducted on four layers corresponding to different water depths and sediment surfaces to examine the relationship between microbial assemblages in the water column and sediment surface and identify the environmental factors that influence the short-term dynamics of microbial assemblages in these two zones. Although the results obtained suggested water–sediment coupling, as inferred from the high proportion of OTUs present in both water and sediment (Fig. 1), the composition of microbial assemblages between the two zones differed even in highly turbid brackish waters with high sediment resuspension (Fig. 2). In the water column, microbial assemblages changed in response to the different environmental factors in water before and after heavy rainfall runoff, and in water above and below the thermocline and halocline (Fig. 3). On the other hand, microbial assemblages in sediment were altered by changes in the redox environment (Fig. 5). The microbial assemblages in the water column and sediment surface in the inner part of Ariake Bay during summer shows that the timing of changes in the microbial composition and the environmental factors associated with these changes were different.
Citation
Orita, R., Yoshida, K., Terazono, H., Nagano, Y., Goto, M., Kimura, K., and Kobayashi, G. (2022) Weekly Observations of Estuarine Microbial Assemblages during Summer in the Inner Part of Ariake Bay, Japan; Microbial Water-sediment Coupling in Turbid Shallow Waters. Microbes Environ 37: ME22015.
https://doi.org/10.1264/jsme2.ME22015
Acknowledgements
This work was supported by the project “COMPAS (Cooperative Monitoring Program of Ariake Sea)” in Saga University and partially by JSPS KAKENHI Grant number 20H03327.
References
- Alonso, C., Warnecke, F., Amann, R., and Pernthaler, J. (2007) High local and global diversity of Flavobacteria in marine plankton. Environ Microbiol
9: 1253–1266.
- Anderson, M.J. (2001) A new method for non-parametric multivariate analysis of variance. Austral Ecol
26: 32–46.
- Baker, B.J., Appler, K.E., and Gong, X. (2012) New microbial biodiversity in marine sediments. Ann Rev Mar Sci
13: 161–175.
- Béjá, O., Spundich, E.N., Spundich, J.L., Lecierc, M., and DeLong, E.F. (2001) Proteorhodopsin phototrophy in the ocean. Nature
411: 786–789.
- Bernardet, J.F., and Bowman, J.P. (2006) The Genus Flavobacterium. In The Prokaryotes, 3rd edn. Dworkin, M., Falkow, S., Rosenberg, E., Schleifer, K.H., and Stackebrandt, E. (eds). New York, NY: Springer, pp. 481–531.
- Bolger, A.M., Lohse, M., and Usadel, B. (2014) Trimmomatic: A flexible trimmer for Illumina sequence data. Bioinformatics
30: 2114–2120.
- Bray, J.R., and Curtis, J.T. (1957) An ordination of the upland forest communities of southern Wisconsin. Ecol Monogr
27: 325–349.
- Chen, H., Zhang, H., Xiong, J., Wang, K., Zhu, J., Zhu, X., et al. (2016) Successional trajectories of bacterioplankton community over the complete cycle of a sudden phytoplankton bloom in the Xiangshan Bay, East China Sea. Environ Pollut
219: 750–759.
- Cole, J.K., Peacock, J.P., Dodsworth, J.A., Williams, A.J., Thompson, D.B., Dong, H., et al. (2013) Sediment microbial communities in Great Boiling Spring are controlled by temperature and distinct from water communities. ISME J
7: 718–729.
- Curtis, T.P., Sloan, W.T., and Scanneell, J.W. (2002) Estimating prokaryotic diversity and its limits. Proc Natl Acad Sci U S A
99: 10494–10499.
- Deisenhofer, J., Epp, O., Huber, M.R., and Michel, H. (1985) Structure of the protein subunits in the photosynthetic reaction centre of Rhodopseudomonas viridis at 3Å resolution. Nature
318: 618–624.
- Easson, C.G., and Lopez, J.V. (2019) Depth-dependent environmental drivers of microbial plankton community structure in the northern Gulf of Mexico. Front Microbiol
9: 3175.
- Eckert, E.M., Salcher, M.M., Posch, T., Eugster, B., and Pernthaler, J. (2012) Rapid successions affect microbial N-acetyl-glucosamine uptake patterns during a lacustrine spring phytoplankton bloom. Environ Microbiol
14: 794–806.
- Emerson, S., and Hedges, J.I. (1988) Processes controlling the organic carbon content of open ocean sediments. Paleoceanogr Paleoclimatol
3: 621–634.
- Feng, B.W., Li, X.R., Wang, J.H., Hu, Z.Y., Meng, H., Xiang, L.Y., and Quan, Z.X. (2009) Bacterial diversity of water and sediment in the Changjiang estuary and coastal area of the East China Sea. FEMS Microbiol Ecol
70: 236–248.
- Fu, H., Smith, C.B., Sharma, S., and Moran, M.A. (2020) Genome sequences and metagenome-assembled genome sequences of microbial communities enriched on phytoplankton exometabolites. Microbiol Resour Announce
9: e00724-20.
- Hayami, Y., Wada, M., Umezawa, Y., Fujii, N., Nakamura, A., and Mori, F. (2019) Hypoxic water mass in the highly turbid well-mixed macrotidal Rokkaku River Estuary, Ariake Sea, Japan. Estuarine, Coastal Shelf Sci
219: 210–222.
- Herlemann, D.P., Labrenz, M., Jürgens, K., Bertilsson, S., Waniek, J.J., and Andersson, A.F. (2011) Transitions in bacterial communities along the 2000 km salinity gradient of the Baltic Sea. ISME J
5: 1571–1579.
- Kaku, N., Ueki, A., Ueki, K., and Watanabe, K. (2005) Methanogenesis as an important terminal electron accepting process in estuarine sediment at the mouth of Orikasa river. Microbes Environ
20: 41–52.
- Khandeparker, L., Kuchi, N., Kale, D., and Anil, A.C. (2017) Microbial community structure of surface sediments from a tropical estuarine environment using next generation sequencing. Ecol Indic
74: 172–181.
- Kim, Y., Jeon, J., Kwak, M.S., Kim, G.H., Koh, I., and Rho, M. (2018) Photosynthetic functions of Synechococcus in the ocean microbiomes of diverse salinity and seasons. PLoS One
13: e0190266.
- Kirchman, D.L. (2012) Processes in Microbial Ecology. Oxford, UK: Oxford University Press.
- Koh, C.H., Khim, J.S., Araki, H., Yamanishi, H., Mogi, H., and Koga, K. (2006) Tidal resuspension of microphytobenthic chlorophyll a in a Nanaura mudflat, Saga, Ariake Sea, Japan: flood–ebb and spring–neap variations. Mar Ecol Prog Ser
312: 85–100.
- Kondo, R., Purdy, K.J., de Queiroz Silva, S., and Nedwell, D.B. (2007) Spatial dynamics of sulphate-reducing bacterial compositions in sediment along a salinity gradient in a UK estuary. Microbes Environ
22: 11–19.
- Kyushu Fisheries Coordinate Office. (2018) Red Tides in the Coastal Waters of Kyushu. URL https://www.jfa.maff.go.jp/kyusyu/sigen/attach/pdf/akashio_kyusyu-10.pdf
- Legendre, P., and Gallagher, E.D. (2001) Ecologically meaningful transformations for ordination of species data. Oecologia
129: 271–280.
- Mahmoudi, N., Robeson, M.S., Castro, H.F., Fortney, J.L., Techtmann, S.M., Joyner, D.C. et al. (2015) Microbial community composition and diversity in Caspian Sea sediments. FEMS Microbiol Ecol
91: 1–11.
- Mann, A.J., Hahnke, R.L., Huang, S., Werner, J., Xing, P., Barbeyron, T., et al. (2013) The genome of the alga-associated marine Flavobacterium Formosa agariphila KMM 3901T reveals a broad potential for degradation of algal polysaccharides. Appl Environ Microbiol
79: 6813–6822.
- Meyers, P.A. (1994) Preservation of elemental and isotopic source identification of sedimentary organic matter. Chem Geol
114: 289–302.
- Ministry of Land, Infrastructure, Transport and Tourism. (2021) Water Information System (in Japanese). URL http://www1.river.go.jp/
- Orita, R., Umehara, A., Komorita, T., Choi, J.W., Montani, S., Komatsu, T., and Tsutsumi, H. (2015) Contribution of the development of the stratification of water to the expansion of dead zone: a sedimentological approach. Estuarine, Coastal Shelf Sci
164: 204–213.
- Pohlner, M., Dlugosch, L., Wemheuer, B., Milis, H., Engelen, B., and Reese, B.R. (2019) The majority of active Rhodobacteraceae in marine sediments belong to uncultured genera: a molecular approach to link their distribution to environmental conditions. Front Microbiol
10: 659.
- Pujalte, M.J., Lucena, T., Ruvira, M.A., Arahal, D.A., and Macián, M.C. (2014) The Family Rhodobacteraceae. In The Prokaryotes: Alphaproteobacteria and Betaproteobacteria. Rosenberg, E., DeLong, E.F., Lory, S., Stackebrandt, E., and Thompson, F. (eds). Berlin, Heidelberg: Springer, pp. 439–512.
- Qian, G., Wang, J., Kan, J., Zhang, X., Xia, Z., Zhang, X., et al. (2018) Diversity and distribution of anammox bacteria in water column and sediments of the Eastern Indian Ocean. Int Biodeterior Biodegrad
133: 52–62.
- Reimers, C.E., Jahnke, R.A., and McCorkle, D.C. (1992) Carbon fluxes and burial rates over continental slope and rise off central California with implications for the global carbon cycle. Global Biogeochem Cycles
6: 199–224.
- Rodriguez-Mora, M.J., Scranton, M.I., Taylor, G.T., and Chistoserdov, A.Y. (2015) The dynamics of the bacterial diversity in the redox transition and anoxic zones of the Cariaco Basin assessed by parallel tag sequencing. FEMS Microbiol Ecol
91: fiv088.
- Sabehi, G., Loy, A., Jung, K.H., Partha, R., Spudich, J.L., Isaacson, T., et al. (2005) New insights into metabolic properties of marine bacteria encoding proteorhodopsins. PLoS Biol
8: e273.
- Sakami, T. (2012) Distribution of ammonia-oxidizing archaea and bacteria in the surface sediments of Matsushima Bay in relation to environmental variables. Microbes Environ
27: 61–66.
- Sarmiento, J.L., and Gruber, N. (2006) Ocean Biogeochemical Dynamics. Princeton, NJ: Princeton University Press.
- Sato, M. (2010) Anthropogenic decline of the peculiar fauna of estuarine mudflats in Japan. Plankton Benthos Res
5: 202–213.
- Staley, C., Gould, T.J., Wang, P., Phillips, J., Cotner, J.B., and Sadowsky, M.J. (2015) Species sorting and seasonal dynamics primarily shape bacterial communities in the Upper Mississippi River. Sci Total Environ
505: 435–445.
- Steindler, L., Schwalbach, M.S., Smith, D.P., Chan, F., and Giovannoni, S.J. (2011) Energy starved Candidatus Pelagibacter Ubique substitutes light-mediated ATP production for endogenous carbon respiration. PLoS One
6: e19725.
- Suter, E.A., Pachiadaki, M., Taylor, G.T., Astor, Y., and Edgcomb, V.P. (2018) Free-living chemoautotrophic and particle-attached heterotrophic prokaryotes dominate microbial assemblages along a pelagic redox gradient. Environ Microbiol
20: 693–712.
- Takii, S., Tanaka, H., Kohata, K., Nakamura, Y., Ogura, H., and Takeshita, S. (2002) Seasonal changes in sulfate reduction in sediments in the inner part of Tokyo Bay. Microbes Environ
17: 10–17.
- Tanaka, K., and Kodama, M. (2007) Effects of resuspended sediments on the environmental changes in the inner part of Ariake Bay, Japan. Bull Fish Res Agency
19: 9–15.
- Tsutsumi, H. (2006) Critical events in the Ariake Bay ecosystem: clam population collapse, red tides, and hypoxic bottom water. Plankton Benthos Res
1: 3–25.
- van Vliet, D.M., von Meijenfeldt, F.A.B., Dutilh, B.A., Villanueva, L., Damsté, J.S.S., Stams, A.J.M., and Sánchez-Andrea, I. (2021) The bacterial sulfur cycle in expanding dysoxic and euxinic marine waters. Environ Microbiol
23: 2834–2857.
- Walsh, E.A., Kirkpatrick, J.B., Rutherford, S.D., Smith, D.C., Sogin, M., and D’Hondt, S. (2016) Bacterial diversity and community composition from seasurface to subseafloor. ISME J
10: 979–989.
- Wei, G., Li, M., Li, F., Li, H., and Gao, Z. (2016) Distinct distribution patterns of prokaryotes between sediment and water in the Yellow River estuary. Appl Microbiol Biotechnol
100: 9683–9697.
- Whitman, W.B., Coleman, D.C., and Wiebe, W.J. (1998) Prokaryotes: the unseen majority. Proc Natl Acad Sci U S A
95: 6578–6583.
- Xia, N., Xia, X., Liu, T., Hu, L., Zhu, B., Zhang, X., and Dong, J. (2014) Characteristics of bacterial community in the water and surface sediment of the Yellow River, China, the largest turbid river in the world. J Soils Sediments
14: 1894–1904.
- Yanagi, T., and Shimomura, M. (2006) Seasonal variation in the transverse and layered structure of estuarine circulation in Ariake Bay, Japan. Cont Shelf Res
26: 2598–2606.
- Ye, W., Liu, X., Lin, S., Tan, J., Pan, J., Li, D., and Yang, H. (2009) The vertical distribution of bacterial and archaeal communities in the water and sediment of Lake Taihu. FEMS Microbiol Ecol
70: 263–276.
- Zhang, W., Bougouffa, S., Wang, Y., Lee, O.O., Yang, J., Chan, C., et al. (2014) Toward understanding the dynamics of microbial communities in an estuarine system. PLoS One
9: e94449.
- Zinger, L., Amaral-Zettler, L.A., Fuhrman, J.A., Horner-Devine, M.C., Huse, S.M., Welch, D.B.M., et al. (2011) Global patterns of bacterial beta-diversity in seafloor and seawater ecosystems. PLoS One
6: e24570.

