Abstract
To investigate functional plant growth-promoting rhizobacteria in sugar beet, seasonal shifts in bacterial community structures in the lateral roots of sugar beet were examined using amplicon sequencing analyses of the 16S rRNA gene. Shannon and Simpson indexes significantly increased between June and July, but did not significantly differ between July and subsequent months (August and September). A weighted UniFrac principal coordinate analysis grouped bacterial samples into four clusters along with PC1 (43.8%), corresponding to the four sampling months in the order of sampling dates. Taxonomic analyses revealed that bacterial diversity in the lateral roots was exclusively dominated by three phyla (Actinobacteria, Bacteroidetes, and Proteobacteria) in all samples examined. At the lower taxonomic levels, the dominant taxa were roughly classified into three groups. Therefore, the relative abundances of seven dominant genera (Janthinobacterium, Kribbella, Pedobacter, Rhodanobacter, Sphingobium, Sphingopyxis, and Streptomyces) were the highest in June and gradually decreased as sugar beet grew. The relative abundances of eight taxa (Bradyrhizobiaceae, Caulobacteraceae, Chitinophagaceae, Novosphingobium, Phyllobacteriaceae, Pseudomonas, Rhizobiaceae, and Sphingomonas) were mainly high in July and/or August. The relative abundances of six taxa (unclassified Comamonadaceae, Cytophagaceae, unclassified Gammaproteobacteria, Haliangiaceae, unclassified Myxococcales, and Sinobacteraceae) were the highest in September. Among the dominant taxa, 12 genera (Amycolatopsis, Bradyrhizobium, Caulobacter, Devosia, Flavobacterium, Janthinobacterium, Kribbella, Kutzneria, Pedobacter, Rhizobium, Rhodanobacter, and Steroidobacter) were considered to be candidate groups of plant growth-promoting bacteria based on their previously reported beneficial traits as biopesticides and/or biofertilizers.
Approximately 20% of the world’s sucrose production is derived from sugar beet (Beta vulgaris L.), which is the most important crop in temperate regions for sugar industry (Godshall, 2012). Sugar beet has been attracting increasing interest as a source of bioenergy (Koga, 2008) because of its higher biomass production than other temperate crops under harsh environmental conditions (Steingrobe, 2001, 2005; de Vries et al., 2010). However, the mechanisms underlying the high productivity and tolerance of sugar beet against diverse biotic and abiotic stresses have not yet been elucidated in detail. One possible explanation for these features of sugar beet may be colonization by plant growth-promoting bacteria (PGPB), which confer stress tolerance and growth-promoting effects on crops (Steingrobe, 2005; Toyota and Watanabe, 2013). Therefore, a more detailed understanding of the diversity and functionality of plant-associated microbes is considered to be a very important key step in the construction of a sustainable agricultural system that takes advantage of the beneficial functionalities of PGPB as a green technology (Bulgari et al., 2019).
Previous studies reported diverse species of bacteria as PGPB in sugar beet (Kloepper et al., 1980; Dunne et al., 1998; Çakmakçi et al., 1999, 2001, 2006; Shi et al., 2009; Okazaki et al., 2021). However, difficulties are associated with the practical utilization of PGPB (Raymaekers et al., 2020); the use of PGPB as a biopesticide or biofertilizer often fails to produce stable growth-promoting effects under field conditions. One possible explanation for this failure is the insufficient consideration of the colonization ability of PGPB on a plant tissue under field conditions (Lugtenberg and Kamilova, 2009; Compant et al., 2010). Microbial community analyses recently revealed that the relative abundance of plant-associated bacteria was affected by a number of environmental factors, such as the plant growth stage. and agronomical practices, including the application of fertilizers and pesticides, in diverse plant species (Ikeda et al., 2014; Unno et al., 2015; Masuda et al., 2016; Hara et al., 2019). Under these environmental factors, the stable colonization of PGPB on and/or in plant tissues during crop cultivation needs to be regarded as a key characteristic of PGPB for their practical use in agriculture. It is also reasonable to consider the colonization ability of a plant-associated microorganism to be reflected by its abundance in a plant tissue, as demonstrated by molecular community analyses in conjunction with current environmental DNA sequencing technologies. However, the impact of plant growth stages on the microbial community of an underground plant tissue has not been widely examined in a time series analysis under field conditions due to the associated high costs and labor demands.
In the case of sugar beet, underground plant tissues are anatomically divided into two types of tissues: the taproot and lateral roots. While the taproot is structurally durable and mainly contributes to the uptake of water from deep soil layers as well as the accumulation of sugar, the lateral roots are fragile and involved in the uptake of nutrients and water from the surface soil layer. Therefore, the lateral roots are regarded as an active site for PGPB to enhance nutrient uptake from soil to sugar beet. Okazaki et al. (2021) successfully isolated several novel PGPB from the lateral roots of sugar beet. Although a bacterial community analysis of the lateral roots has been conducted, it did not provide many ecological aspects for PGPB due to the use of a classical clone library analysis without a sufficient amount of sequence data at one time point during the cultivation of sugar beet. Similarly, the reported persistency of other PGPB in the tissues of sugar beet was not investigated under field conditions.
Regarding the rhizosphere of sugar beet, microbial community analyses with recent molecular biological technologies have targeted rhizosphere soil (Mendes et al., 2011; Zachow et al., 2014; Hudz and Skivka, 2021) and the taproot (Shi et al., 2014; Tsurumaru et al., 2015), but not the lateral roots, except in our study described above (Okazaki et al., 2021). A microbial community analysis using an automated ribosomal intergenic spacer previously demonstrated that plant growth stages influenced the diversity of the rhizosphere microbial community in tuber peelings of sugar beet (Houlden et al., 2008). Similarly, the growth stage of sugar beet is expected to have an impact on the microbial community of lateral roots. Based on these findings, we herein investigated the impact of sugar beet growth stages (late seedling, vigorous growth, and sugar accumulation) on bacterial community structures in lateral roots using high-throughput sequencing to identify dominant bacterial groups at each growth stage and also understand the dynamics of these groups under field conditions for the practical and efficient use of PGPB in agriculture.
Materials and Methods
Plant materials and soil sampling
Seeds of the sugar beet cultivar “Rycka” were sown in pots (paper pot no. 1; Nippon Beet Sugar Manufacturing) filled with field soil supplemented with chemical fertilizer and soil conditioner (Matsuhira et al., 2022) under greenhouse conditions on March 13, 2014. The seedlings of sugar beet were planted in a plot (eight rows with a row length of 6.75 m) of an Andosol experimental field at the Hokkaido Agricultural Research Center (Memuro, Hokkaido, Japan, 42°89′20″N, 143°07′70″E, 94 m a.s.l.) on April 22, 2014. Inter- and intra-row distances were 60 and 22.5 cm, respectively. The field was dressed with the commercial fertilizer S014 (150, 315, and 210 kg ha–1 for N, P2O5, and K2O, respectively; Hokuren Fertilizer) as basal fertilization. Based on a visual inspection, six healthy plants were randomly sampled from the plot every month between June and September (June 16, July 15, August 12, and September 17, 2014). At the experimental site, sampling dates roughly corresponded to the late seedling (June), vigorous growth (July and August), and sugar accumulation (September) stages (Fig. S1). The roots of individual plants were carefully washed with tap water to remove loosely adhering soil and organic debris and were then rinsed with sterilized water. The lateral roots on the taproot were individually collected using a sterilized forceps. Six lateral root samples per month were stored at –30°C until used for DNA preparation. Soil samples were collected from five sampling sites in the plot by an auger (between a depth of 5 and 15 cm) after the removal of surface soil on July 15, 2014 and were combined as a composite soil sample. The chemical characteristics of the soil sample were assessed by the Tokachi Nokyoren Agricultural Research Institute (Obihiro, Hokkaido, Japan) as described elsewhere (Okada and Harada, 2007) (Table S1).
Sequencing and editing of sequence data prior to statistical analyses
The lateral roots of an individual plant (approximately 1 g) were grounded in liquid nitrogen with a mortar and pestle. A portion of the pulverized sample (0.4 g) was transferred into a Lysing Matrix E tube (MP Biomedicals), and a DNA sample was prepared as previously described (Ikeda et al., 2004), except that a homogenizer (FastPrep®24, MP Biomedicals) was used for the bead beating step (30 s at 5.5 ms–1 and room temperature) and a DEAE-cellulose column treatment was omitted. Pelleted DNA was then washed with 85% ethanol and suspended in 100 μL of TE buffer (pH 7.6).
In the bacterial community analysis, PCR amplification for the bacterial 16S rRNA gene was conducted using the 1st-515f_MIX and 1st-806r_MIX primer set that amplified the V3–V4 region of the bacterial 16S rRNA gene (Caporaso et al., 2011). PCR amplification was performed as follows: 94°C for 2 min, 30 cycles of a program (94°C for 30 s, 50°C for 30 s, and 72°C for 30 s), and then final extension at 72°C for 5 min. PCR amplicons were used as template DNA for second PCR and the paired-end sequence (2×300 bp) on a MiSeq sequencer using MiSeq Reagent Kit v3 (Illumina) as described by Nakamura et al. (2020).
The extraction of raw reads containing a perfect primer sequence, the removal of the primer and 50 bases of the 3′end sequences, and trimming (minimum length of 40 bases; minimum average quality score of 20) were performed as described by Nakamura et al. (2020). Trimmed reads were merged (minimum overlap 10 bases; average merged length 250 bases; average length of individual reads 230 bases) using FLASH software (Magoc and Salzberg, 2011). Taxonomic assignment for the merged sequences was performed using a script of Qiime (Caporaso et al., 2010), and sequences classified into archaea, chloroplasts, mitochondria, and unassigned sequences at the domain level were removed. The removal of chimera and noise sequences, the generation of amplicon sequence variants (ASVs), and their representative sequences were conducted using the data2 Qiime2 plugin with default settings (Bolyen et al., 2019). After rarefaction to 5,491 reads per sample, taxonomic assignment for the representative sequences was performed with the feature-classifier Qiime2 plugin by comparisons with 97% OTUs of Greengenes, and alpha-diversity measures and UniFrac principal coordinate analysis (PCoA) were conducted with the script of Qiime.
Statistical analysis
A one-way ANOVA and Tukey’s HSD (honestly significant difference) test were performed using JMP software version 12 (SAS Institute) for multiple comparisons of the relative abundances of bacterial taxa among sampling months.
Nucleotide sequence accession numbers.
The raw reads used in the present study were deposited into the NCBI SRA database (BioProject accession number: PRJNA826328).
Results
Alpha-diversity measures and UniFrac PCoA
Alpha-diversity measures with the relative abundance data of ASVs based on 5,491 reads per sample revealed that all diversity indexes examined for the lateral root-associated bacteria (LR bacteria) of sugar beet significantly increased between June and July or August (Table 1). The numbers of singleton, ASV, Chao1, and ACE significantly increased between June and August and no significant differences were observed between August and September. Shannon and Simpson indexes significantly increased between June and July, but did not significantly differ between July and subsequent months (August and September).
Table 1.
Diversity indexes for lateral root-associated bacteria of sugar beet grown in an Andosol experimental field in Japan between June and September
| Diversity indexa |
Sampling monthb |
Sig.c |
| June |
|
July |
|
August |
|
September |
|
| No. of singletons |
14.0±12.9 |
b |
39.5±32.6 |
ab |
91.3±33.6 |
a |
72.0±49.1 |
a |
** |
| No. of ASVs |
230.0±64.0 |
b |
332.5±96.3 |
ab |
444.3±78.4 |
a |
440.2±111.2 |
a |
** |
| Chao1 |
235.5±69.7 |
b |
353.8±115.4 |
ab |
504.3±107.2 |
a |
484.2±146.8 |
a |
** |
| ACE |
235.5±69.3 |
b |
354.6±119.5 |
ab |
508.3±107.5 |
a |
485.9±150.0 |
a |
** |
| Shannon |
6.4±0.4 |
b |
7.1±0.3 |
a |
7.3±0.2 |
a |
7.5±0.3 |
a |
*** |
| Simpson |
0.968±0.016 |
b |
0.984±0.004 |
a |
0.986±0.002 |
a |
0.989±0.002 |
a |
*** |
a Diversity indexes are calculated based on 5,491 reads per sample.
b Results are shown as the average±S.D. (n=6). The same letter indicates no significant difference among sampling months.
c ** and *** indicate a significant difference among sampling months by a one-way ANOVA at P<0.01 and P<0.001, respectively.
The results of unweighted and weighted UniFrac PCoA showed that bacterial samples were mainly grouped into four clusters along with PC1 (19.7 and 43.8%, respectively), corresponding to the four sampling months in the order of the sampling time (between June and September) (Fig. 1). PCoA results also indicated shifts in July and August samples along with PC2 (8.5 and 19.4%, respectively) relative to June and September samples. June, July, and August samples were more tightly clustered together in weighted UniFrac PCoA than in unweighted UniFrac PCoA. June and September samples in UniFrac PCoA were more loosely clustered than July and August samples.
Analyses of taxonomic compositions of and seasonal shifts in bacterial communities in lateral roots of sugar beet
The analysis of the taxonomic compositions of all combined sequence data in the present study identified 32 phyla, 85 classes, 174 orders, 295 families, 473 genera, and 542 species. A clustering analysis of sequence data with 100% identity generated 2,734 ASVs. Among these taxa and ASVs, 6 phyla, 9 classes, 14 orders, 24 families, 40 genera, 40 species, and 39 ASVs were identified as dominant taxa or ASVs with relative abundances of 1% or more than 1% in any one of the sampling months. At the phylum level, the relative abundances of three dominant phyla (Actinobacteria,
Bacteroidetes, and Proteobacteria) accounted for more than 90% (92.2 to 96.1%) in all sampling months (Fig. 2A and Table S2). At the class and order levels, the relative abundances of six dominant classes (Actinobacteria, Alphaproteobacteria, Betaproteobacteria, Gammaproteobacteria,
Saprospirae, and Sphingobacteriia) and eight dominant orders
(Actinomycetales, Burkholderiales, Caulobacterales, Rhizobiales,
Saprospirales, Sphingobacteriales, Sphingomonadales, and Xanthomonadales) accounted for more than 80% (84.3 to 92.6%) and 70% (74.8 to 85.9%), respectively, in all sampling months (Fig. 2B, C, and Table S2).
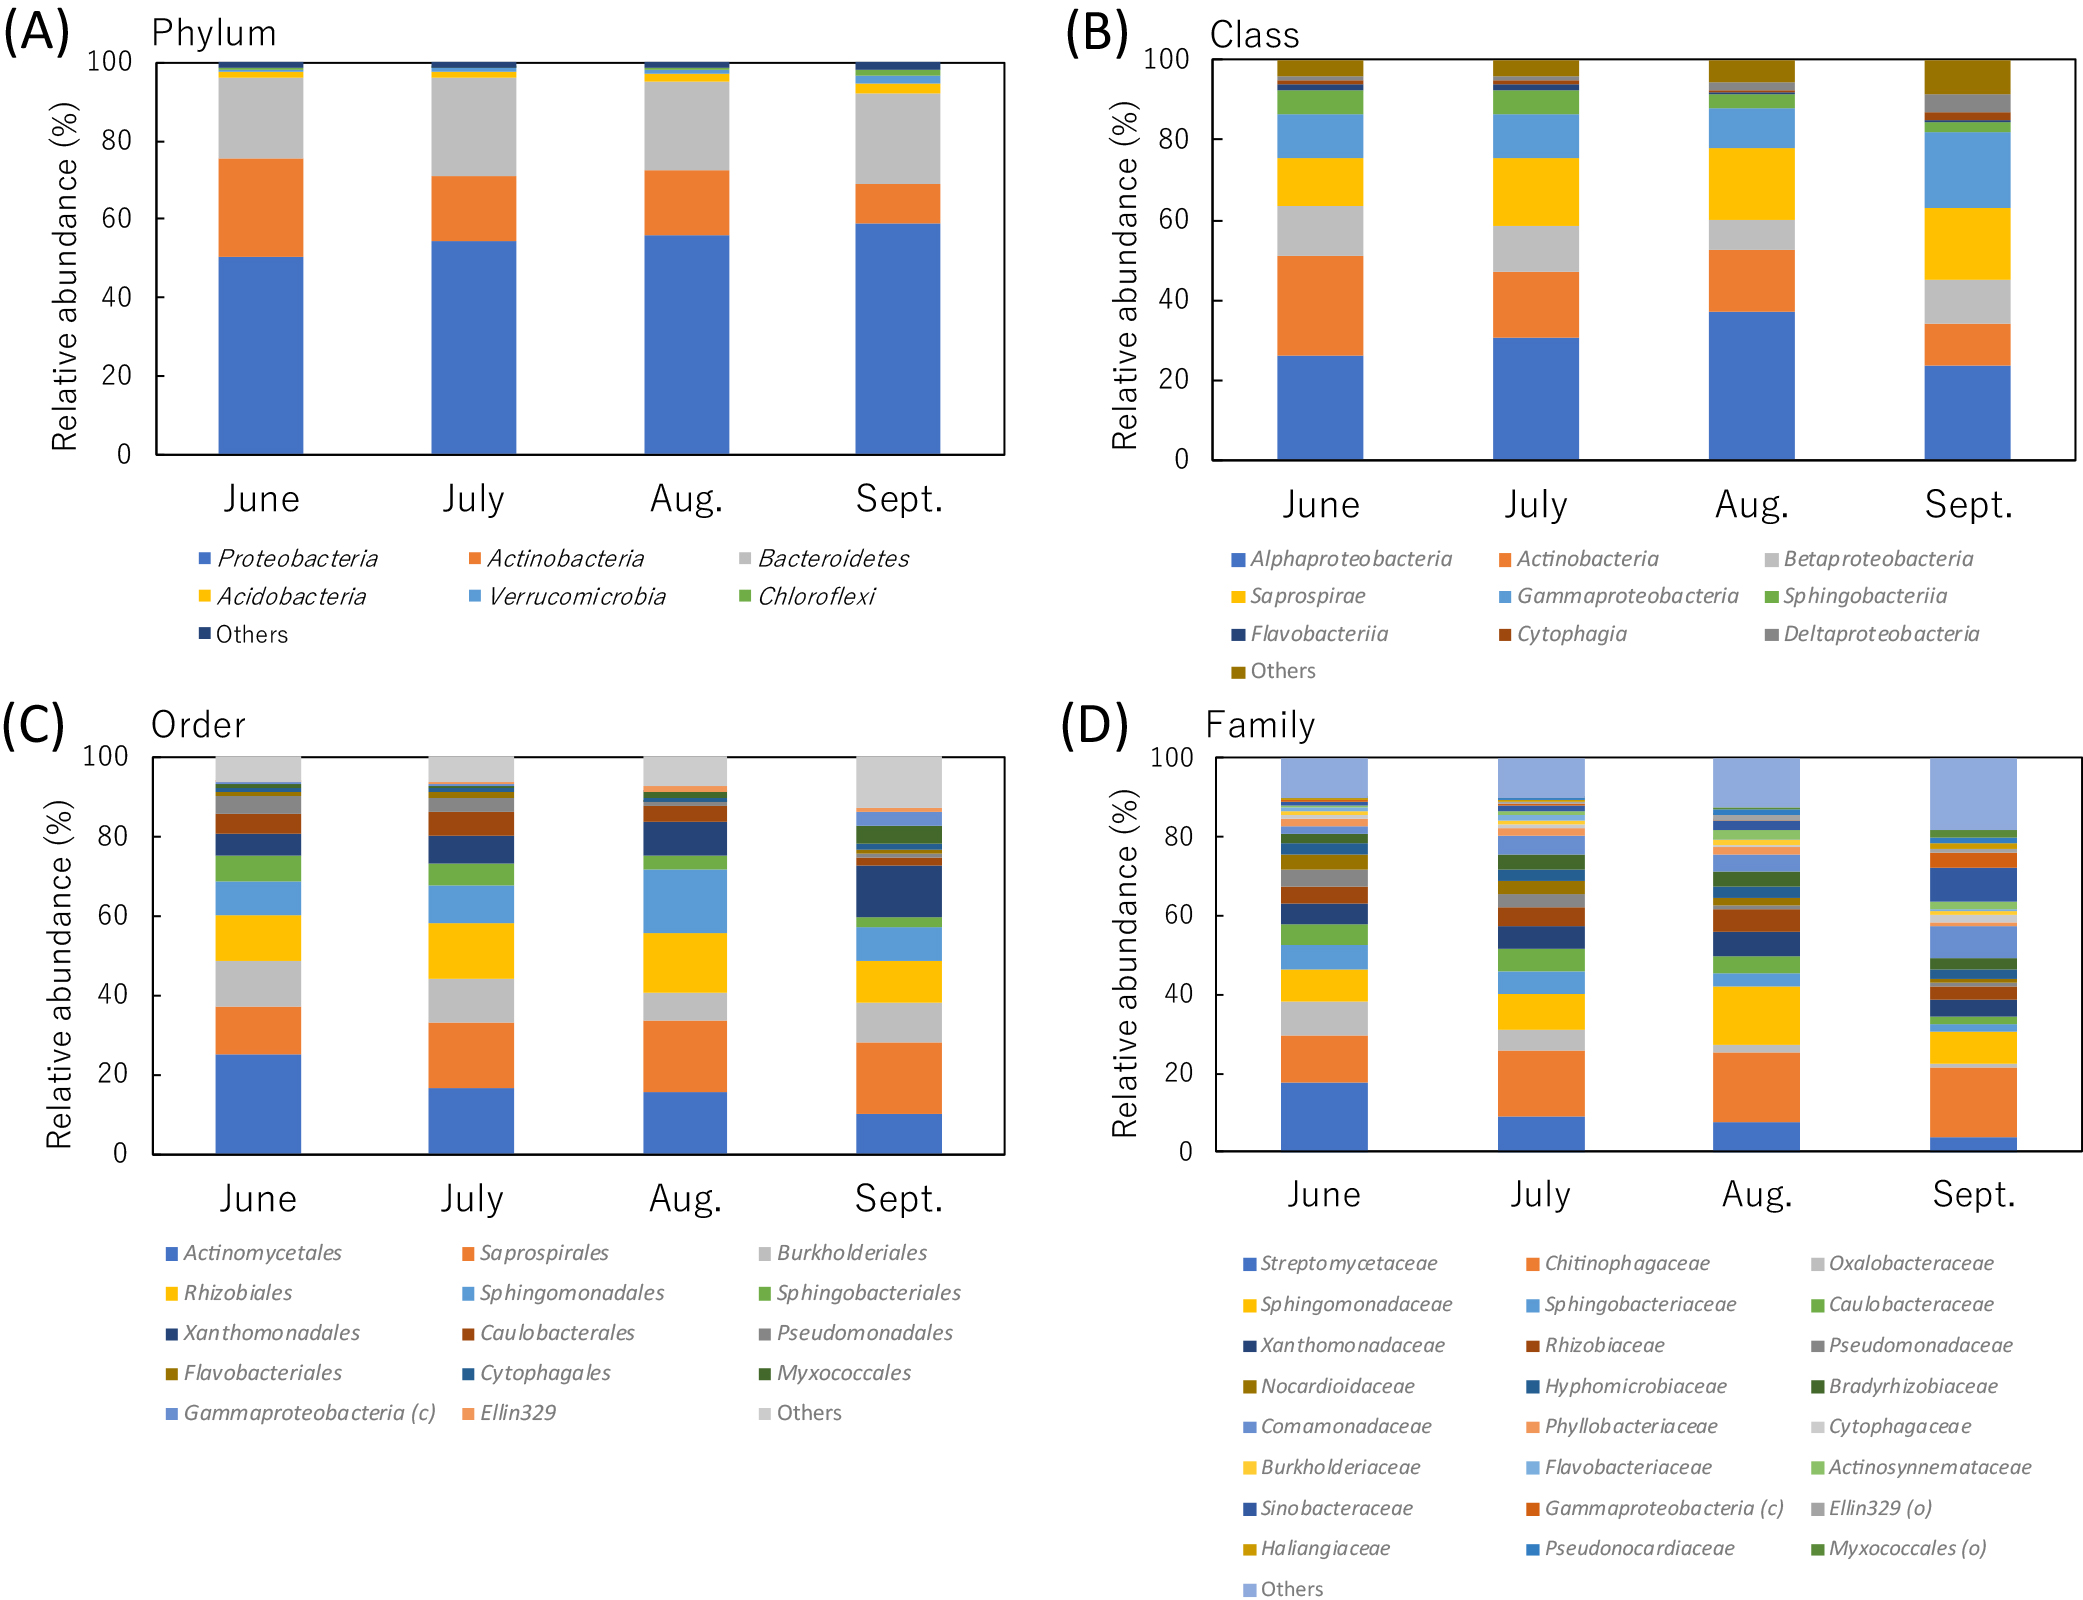
The taxonomic compositions of the dominant bacterial groups at the lower taxonomic levels from family to ASV markedly differed among sampling months. At the family level, eleven dominant families (Bradyrhizobiaceae, Caulobacteraceae, Chitinophagaceae, Comamonadaceae, Hyphomicrobiaceae, Nocardioidaceae, Rhizobiaceae, Sphingomonadaceae, Sphingobacteriaceae, Streptomycetaceae, and Xanthomonadaceae) were present in all sampling months (Fig. 2D). Their relative abundances accounted for more than 70% in June, July, and August (70.2, 71.7, and 73.1%, respectively), but less than 60% in September (55.9%) (Table S2). At the genus level, only eleven dominant genera (Caulobacter, Chitinophaga, Devosia, Kribbella, Niastella, Novosphingobium, Rhizobium, Sphingomonas, Streptomyces, unclassified Chitinophagaceae, and unclassified Comamonadaceae) were present in all sampling months and their relative abundances accounted for less than 50% (37.3 to 44.8%) in all sampling months (Table S3). The taxonomic compositions of eleven dominant groups at the species level corresponded to those of eleven dominant groups at the genus level as described above, whereas only two groups were taxonomically resolved at the species level (Caulobacter henricii and Chitinophaga arvensicola) in the Greengenes database. At the ASV level, only five ASVs (ASV_001 [Streptomyces], ASV_002 [Chitinophagaceae], ASV_003 [C. henricii], ASV_005 [C. arvensicola], and ASV_006 [Rhizobium]) were present as dominant ASVs in all sampling months and their relative abundances accounted for only 22.1, 16.9, 16.3, and 7.8% in June, July, August, and September, respectively (Table 2).
Table 2.
Sugar beet lateral root-associated bacteria showing significant differences in relative abundances among sampling months at the ASV level
| ASV IDa |
Closest taxonb |
Sampling monthc |
Sig.d |
| June |
|
July |
|
August |
|
September |
|
| ASV_001 |
Streptomyces (g) |
13.9±5.1 |
a |
7.2±2.7 |
b |
6.0±1.1 |
b |
2.6±1.0 |
c |
*** |
| ASV_003 |
Caulobacter henricii |
3.4±0.6 |
a |
3.5±1.1 |
a |
2.3±0.7 |
a |
1.0±0.4 |
b |
*** |
| ASV_030 |
Janthinobacterium (g) |
3.0±1.4 |
a |
1.3±0.5 |
b |
0.2±0.1 |
c |
0.2±0.1 |
c |
*** |
| ASV_014 |
Pedobacter (g) |
2.8±1.1 |
a |
1.7±0.9 |
ab |
0.8±0.5 |
bc |
0.2±0.4 |
c |
*** |
| ASV_015 |
Sphingobium (g) |
2.0±0.9 |
a |
1.1±0.4 |
a |
1.2±0.6 |
a |
0.4±0.2 |
b |
*** |
| ASV_005 |
Chitinophaga arvensicola |
1.9±0.7 |
ab |
1.2±0.7 |
ab |
2.4±1.2 |
a |
1.0±0.5 |
b |
* |
| ASV_019 |
Rhodanobacter (g) |
1.9±1.0 |
a |
1.2±0.3 |
a |
0.9±0.3 |
ab |
0.3±0.3 |
b |
*** |
| ASV_022 |
Oxalobacteraceae (f) |
1.8±0.7 |
a |
1.5±0.5 |
a |
0.7±0.2 |
b |
0.3±0.2 |
b |
*** |
| ASV_008 |
Niastella (g) |
1.8±0.9 |
|
1.5±0.5 |
|
0.9±0.4 |
|
2.0±1.0 |
|
— |
| ASV_012 |
Kribbella (g) |
1.8±0.7 |
a |
1.5±0.4 |
a |
1.2±0.5 |
ab |
0.7±0.4 |
b |
** |
| ASV_006 |
Rhizobium (g) |
1.8±0.6 |
ab |
1.5±0.4 |
ab |
2.2±0.4 |
a |
1.2±0.3 |
b |
** |
| ASV_020 |
Pseudomonas (g) |
1.4±1.2 |
ab |
2.1±2.0 |
a |
0.2±0.1 |
c |
0.4±0.3 |
bc |
** |
| ASV_038 |
Kribbella (g) |
1.4±0.3 |
a |
1.0±0.5 |
ab |
0.5±0.2 |
bc |
0.2±0.3 |
c |
*** |
| ASV_002 |
Chitinophagaceae (f) |
1.2±0.4 |
b |
3.4±1.1 |
a |
3.4±2.0 |
a |
2.0±1.0 |
ab |
** |
| ASV_039 |
Streptomyces (g) |
1.2±0.3 |
a |
0.7±0.2 |
b |
0.6±0.3 |
b |
0.4±0.2 |
b |
*** |
| ASV_007 |
Sphingomonas (g) |
1.2±0.5 |
b |
1.1±0.3 |
b |
2.5±0.8 |
a |
0.9±0.9 |
b |
** |
| ASV_064 |
Streptomycetaceae (f) |
1.2±0.4 |
a |
0.5±0.3 |
ab |
0.2±0.2 |
b |
0.1±0.2 |
b |
*** |
| ASV_032 |
Asticcacaulis biprosthecium |
1.1±0.2 |
a |
1.1±0.4 |
a |
0.8±0.4 |
a |
0.1±0.2 |
b |
*** |
| ASV_033 |
Niastella (g) |
1.0±0.3 |
|
0.8±0.5 |
|
0.8±0.2 |
|
0.5±0.1 |
|
— |
| ASV_004 |
Bradyrhizobium (g) |
0.9±0.3 |
b |
1.8±0.5 |
a |
2.3±0.4 |
a |
2.2±0.7 |
a |
*** |
| ASV_023 |
Novosphingobium (g) |
0.8±0.6 |
ab |
0.5±0.3 |
ab |
1.4±0.9 |
a |
0.2±0.3 |
b |
** |
| ASV_018 |
Devosia (g) |
0.8±0.2 |
|
1.1±0.4 |
|
1.0±0.2 |
|
0.9±0.4 |
|
— |
| ASV_016 |
Sphingomonas azotifigens |
0.7±0.2 |
b |
1.6±0.4 |
a |
0.9±0.4 |
b |
0.9±0.5 |
ab |
** |
| ASV_009 |
Agrobacterium (g) |
0.4±0.1 |
b |
1.2±0.4 |
a |
1.8±1.0 |
a |
1.1±0.4 |
a |
*** |
| ASV_031 |
Sphingobacteriaceae (f) |
0.4±0.2 |
|
1.0±1.2 |
|
0.8±0.5 |
|
0.6±0.2 |
|
— |
| ASV_026 |
Steroidobacter (g) |
0.3±0.1 |
b |
0.5±0.2 |
b |
0.6±0.4 |
b |
1.8±0.3 |
a |
*** |
| ASV_024 |
Sinobacteraceae (f) |
0.2±0.2 |
b |
0.5±0.2 |
b |
0.4±0.1 |
b |
1.9±0.8 |
a |
*** |
| ASV_010 |
Novosphingobium (g) |
0.2±0.3 |
b |
0.8±0.6 |
ab |
1.3±0.5 |
a |
1.8±0.8 |
a |
*** |
| ASV_034 |
Kutzneria (g) |
0.2±0.2 |
b |
0.3±0.2 |
b |
1.2±0.3 |
a |
0.8±0.8 |
ab |
** |
| ASV_021 |
Chitinophaga (g) |
0.2±0.3 |
b |
0.3±0.2 |
ab |
0.7±0.3 |
ab |
2.0±3.0 |
a |
* |
| ASV_054 |
Gammaproteobacteria (c) |
0.2±0.4 |
b |
0.1±0.2 |
b |
0.0±0.1 |
b |
1.9±1.7 |
a |
*** |
| ASV_017 |
Amycolatopsis (g) |
0.2±0.1 |
b |
0.4±0.2 |
b |
1.1±0.2 |
a |
1.3±0.5 |
a |
*** |
| ASV_027 |
Dokdonella (g) |
0.1±0.1 |
c |
0.5±0.1 |
b |
1.0±0.2 |
a |
0.9±0.4 |
ab |
*** |
| ASV_040 |
Comamonadaceae (f) |
0.1±0.2 |
c |
0.2±0.2 |
bc |
0.4±0.2 |
b |
1.3±0.6 |
a |
*** |
| ASV_025 |
Comamonadaceae (f) |
0.1±0.2 |
c |
0.5±0.2 |
b |
0.5±0.3 |
b |
2.1±0.5 |
a |
*** |
| ASV_013 |
Novosphingobium (g) |
0.1±0.2 |
c |
0.5±0.4 |
bc |
1.8±1.3 |
a |
0.6±0.5 |
b |
*** |
| ASV_011 |
Steroidobacter (g) |
0.0±0.0 |
c |
0.1±0.1 |
c |
0.7±0.3 |
b |
3.2±1.2 |
a |
*** |
| ASV_046 |
Gammaproteobacteria (c) |
0.0±0.0 |
b |
0.0±0.1 |
b |
0.1±0.1 |
b |
1.1±1.0 |
a |
*** |
a ASVs with relative abundances of 1% or more than 1% in any one of the sampling months are shown. Relative abundance was calculated based on 5,491 reads per sample. ASVs indicated in bold font showed no significant differences in relative abundance among the sampling months.
b Letters (c, f, and g) in parentheses indicate taxonomic units (class, family, and genus, respectively).
c Results are shown as the average±S.D. (n=6). The same letter indicates no significant difference among the months, and months with high, low, and moderate abundances are highlighted with dark gray, white, and light gray backgrounds, respectively.
d *, **, and *** indicate a significant difference among sampling months by a one-way ANOVA at P<0.05, P<0.01, and P<0.001, respectively. “—” indicates no significant difference among the sampling months.
Statistical analyses revealed that the relative abundances of 11 phyla, 32 classes, 52 orders, 84 families, 120 genera, 137 species, and 263 ASVs significantly differed among the sampling months. Among these taxa and ASVs, 4 phyla, 9 classes, 14 orders, 21 families, 33 genera, 34 species, and 34 ASVs were identified as dominant taxa or ASVs with relative abundances of 1% or more than 1% in any of the sampling months. At the phylum level, the relative abundances of three phyla (Chloroflexi, Proteobacteria, and Verrucomicrobia) increased between June and September, while that of Actinobacteria markedly decreased between June to September (Table 3). Among the dominant phyla, the relative abundances of Bacteroidetes and Acidobacteria did not significantly differ among the sampling months (Table S2). At the class level, the relative abundances of the dominant classes belonging to Proteobacteria and Actinobacteria significantly differed among the sampling months, while those belonging to Bacteroidetes (Cytophagia,
Flavobacteriia, Saprospirae, and Sphingobacteriia) did not (Table S2). In Proteobacteria, the relative abundances of Alpha- and Betaproteobacteria were the highest and lowest, respectively, in August. The relative abundances of Gamma- and Deltaproteobacteria were the highest in September. At the order level, the relative abundances of all dominant orders (Fig. 2C and Table S2) significantly differed among the sampling months (Table 3). The relative abundances of three orders in Alphaproteobacteria (Caulobacterales, Rhizobiales, and Sphingomonadales) were slightly higher in July and/or August, while that of Ellin329 was high in August and September. The relative abundances of orders in Gamma-, and Deltaproteobacteria were high in September, except for Pseudomonadales, the abundance of which was high in June and July. In Bacteroidetes, the relative abundances of Sphingobacteriales and Flavobacteriales were both high in June and July, while that Cytophagales was significantly high in September. The relative abundances of Burkholderiales and Saprospirales remained steady between June and September, but were significantly low in August and June, respectively.
Table 3.
Sugar beet lateral root-associated bacteria showing significant differences in relative abundances (%) among sampling months at phylum, class, and order levels
| Taxona |
Sampling monthb |
Sig.c |
| June |
|
July |
|
August |
|
September |
|
| Proteobacteria |
50.3±5.4 |
b |
54.3±2.1 |
ab |
56.1±3.6 |
ab |
58.7±5.5 |
a |
* |
| Alphaproteobacteria |
26.1±2.0 |
bc |
30.5±2.5 |
b |
37.0±5.7 |
a |
23.7±3.0 |
c |
*** |
| Rhizobiales |
11.6±1.2 |
b |
13.8±1.3 |
a |
15.2±1.4 |
a |
10.6±1.6 |
b |
*** |
| Sphingomonadales |
8.5±1.2 |
b |
9.5±0.9 |
b |
15.8±3.9 |
a |
8.5±1.4 |
b |
*** |
| Caulobacterales |
5.5±0.8 |
a |
6.0±1.6 |
a |
4.2±0.9 |
a |
2.1±0.6 |
b |
*** |
| Ellin329 |
0.3±0.1 |
b |
0.7±0.3 |
ab |
1.2±0.7 |
a |
1.1±0.3 |
a |
*** |
| Betaproteobacteria |
12.6±3.1 |
a |
11.7±1.7 |
a |
7.5±1.4 |
b |
11.3±1.8 |
a |
** |
| Burkholderiales |
11.7±3.1 |
a |
11.0±1.7 |
a |
6.9±1.3 |
b |
10.0±1.4 |
a |
** |
| Gammaproteobacteria |
10.8±3.3 |
b |
11.3±2.1 |
b |
9.8±1.0 |
b |
18.8±3.6 |
a |
*** |
| Xanthomonadales |
5.5±1.2 |
c |
7.0±1.1 |
bc |
8.7±1.3 |
b |
13.1±2.4 |
a |
*** |
| Pseudomonadales |
4.1±2.3 |
a |
3.4±2.1 |
a |
0.6±0.4 |
b |
0.8±0.5 |
b |
*** |
| Unclassified Gammaproteobacteria (c) |
0.5±0.7 |
b |
0.4±0.3 |
b |
0.2±0.1 |
b |
3.6±2.2 |
a |
*** |
| Deltaproteobacteria |
0.9±0.5 |
b |
0.8±0.3 |
b |
1.7±0.7 |
b |
4.8±2.0 |
a |
*** |
| Myxococcales |
0.8±0.4 |
b |
0.6±0.2 |
b |
1.5±0.6 |
b |
4.5±1.9 |
a |
*** |
| Actinobacteria |
25.3±6.9 |
a |
16.7±4.3 |
b |
16.1±2.0 |
bc |
10.5±3.3 |
c |
*** |
| Actinomycetales |
25.0±6.9 |
a |
16.4±4.4 |
b |
15.6±2.1 |
b |
10.2±3.3 |
b |
*** |
| Verrucomicrobia |
0.5±0.3 |
b |
0.8±0.4 |
b |
0.9±0.3 |
b |
2.0±0.7 |
a |
*** |
| Chloroflexi |
0.4±0.2 |
b |
0.3±0.2 |
b |
0.6±0.2 |
b |
1.2±0.6 |
a |
*** |
| Bacteroidetes |
20.5±2.9 |
|
25.1±3.0 |
|
22.6±2.6 |
|
23.0±5.1 |
|
— |
| Saprospirales |
12.0±1.4 |
b |
16.8±1.7 |
a |
18.0±3.2 |
a |
17.8±4.7 |
a |
** |
| Sphingobacteriales |
6.2±1.2 |
a |
5.9±2.2 |
a |
3.6±0.7 |
b |
2.5±0.5 |
b |
*** |
| Flavobacteriales |
1.3±0.6 |
a |
1.4±0.6 |
a |
0.4±0.1 |
b |
0.9±0.5 |
ab |
** |
| Cytophagales |
1.0±0.3 |
b |
1.0±0.2 |
b |
0.7±0.2 |
b |
1.7±0.6 |
a |
*** |
a Taxa with relative abundances of 1% or more than 1% in any one of the sampling months are shown. When the same value for relative abundance is obtained at different taxonomic levels for a bacterial group, only the lowest taxonomic group is shown. Relative abundance was calculated based on 5,491 reads per sample. Letters (c) in parentheses indicate taxonomic units (class). Bacteroidetes showed no significant differences in relative abundance among the sampling months, but is listed as a reference for the order of this phylum.
b Results are shown as the average±S.D. (n=6). The same letter indicates no significant difference among the months, and months with high, low, and moderate abundances are highlighted with dark gray, white, and light gray backgrounds, respectively.
c *, **, and *** indicate a significant difference among months by a one-way ANOVA at P<0.05, P<0.01, and P<0.001, respectively. “—” indicates no significant difference among the sampling months.
Consistent with the results shown in Table 1 and Fig. 1, statistical analyses of changes in relative abundance at the level from family to ASV revealed a marked shift in community structures and an increase in diversity occurred between June and September at low taxonomic levels, mainly in Actinobacteria, Bacteroidetes, and Proteobacteria (Table 4). Therefore, the relative abundances of dominant taxa in June significantly decreased in September, while those of a number of minor taxa (relative abundance less than 1) in June significantly increased in September as dominant taxa. This was clearly observed at the ASV level (Table 2).
Table 4.
Sugar beet lateral root-associated bacteria showing significant differences in relative abundances (%) among sampling months at family, genus, and species levels
| Taxona |
Sampling monthb |
Sig.c |
| June |
|
July |
|
August |
|
September |
|
| Streptomycetaceae |
17.7±6.4 |
a |
9.1±3.0 |
b |
7.6±1.5 |
b |
3.6±1.3 |
c |
*** |
| Streptomyces |
15.7±5.7 |
a |
8.3±3.0 |
b |
7.0±1.4 |
b |
3.4±1.2 |
c |
*** |
| Unclassified Streptomycetaceae (f) |
2.0±1.1 |
a |
0.8±0.5 |
b |
0.6±0.2 |
b |
0.2±0.3 |
b |
*** |
| Chitinophagaceaed |
11.9±1.4 |
b |
16.7±1.7 |
a |
17.9±3.2 |
a |
17.7±4.7 |
a |
** |
| Unclassified Chitinophagaceae (f)’ |
4.7±0.6 |
b |
7.8±1.1 |
a |
7.6±2.0 |
a |
5.9±1.0 |
ab |
*** |
| Unclassified Chitinophagaceae (f)” |
0.7±0.2 |
c |
1.6±0.5 |
b |
1.8±0.5 |
ab |
2.5±0.6 |
a |
*** |
| Chitinophaga arvensicola |
1.9±0.7 |
ab |
1.2±0.7 |
ab |
2.4±1.2 |
a |
1.0±0.5 |
b |
* |
| Oxalobacteraceae |
8.5±1.7 |
a |
5.1±0.8 |
b |
1.7±0.3 |
c |
0.9±0.1 |
d |
*** |
| Janthinobacterium |
3.9±1.3 |
a |
1.5±0.7 |
b |
0.3±0.1 |
c |
0.2±0.1 |
c |
*** |
| Unclassified Oxalobacteraceae (f) |
2.8±0.7 |
a |
2.5±0.4 |
a |
0.9±0.2 |
b |
0.6±0.1 |
b |
*** |
| Sphingomonadaceae |
8.3±1.1 |
b |
9.0±0.7 |
b |
14.8±3.5 |
a |
8.2±1.3 |
b |
*** |
| Sphingobium |
2.3±1.0 |
a |
1.3±0.4 |
b |
1.2±0.6 |
b |
0.5±0.2 |
c |
*** |
| Novosphingobium |
2.0±0.6 |
c |
2.5±0.3 |
c |
7.1±2.9 |
a |
4.4±0.7 |
b |
*** |
| Sphingomonas |
1.9±0.6 |
c |
3.8±0.8 |
ab |
4.4±0.8 |
a |
2.7±1.3 |
bc |
*** |
| Sphingomonas azotifigens |
0.7±0.2 |
b |
1.6±0.4 |
a |
0.9±0.4 |
b |
0.9±0.5 |
ab |
** |
| Sphingopyxis |
1.4±0.8 |
a |
0.9±0.5 |
a |
0.9±0.4 |
a |
0.1±0.1 |
b |
*** |
| Sphingobacteriaceae |
6.2±1.2 |
a |
5.7±2.2 |
a |
3.5±0.7 |
b |
1.9±0.7 |
b |
*** |
| Pedobacter |
4.6±1.3 |
a |
3.2±1.3 |
ab |
1.8±0.8 |
b |
0.6±0.4 |
c |
*** |
| Caulobacteraceae |
5.5±0.8 |
a |
6.0±1.6 |
a |
4.2±0.9 |
a |
2.1±0.6 |
b |
*** |
| Caulobacter |
3.6±0.6 |
ab |
3.9±1.2 |
a |
2.5±0.8 |
b |
1.3±0.4 |
c |
*** |
| Caulobacter henricii |
3.6±0.6 |
a |
3.6±1.1 |
ab |
2.3±0.7 |
b |
1.0±0.4 |
c |
*** |
| Asticcacaulis biprosthecium |
1.1±0.2 |
a |
1.1±0.4 |
a |
0.8±0.4 |
a |
0.1±0.2 |
b |
*** |
| Rhizobiaceae |
4.6±0.8 |
ab |
5.0±0.8 |
a |
5.9±1.1 |
a |
3.6±0.5 |
b |
*** |
| Rhizobium |
3.0±1.1 |
a |
2.7±0.7 |
a |
3.5±0.5 |
a |
1.6±0.4 |
b |
** |
| Agrobacterium |
0.5±0.2 |
b |
1.2±0.4 |
a |
1.8±1.0 |
a |
1.2±0.4 |
ab |
** |
| Pseudomonas |
4.1±2.3 |
a |
3.4±2.1 |
a |
0.6±0.4 |
b |
0.8±0.6 |
b |
*** |
| Nocardioidaceae |
4.1±0.9 |
a |
3.4±0.7 |
ab |
2.3±0.8 |
bc |
1.3±0.8 |
c |
*** |
| Kribbella |
3.6±0.8 |
a |
3.0±0.7 |
ab |
2.0±0.8 |
bc |
1.2±0.8 |
c |
*** |
| Rhodanobacter |
2.5±1.2 |
a |
2.2±0.7 |
ab |
1.9±1.1 |
ab |
0.9±0.8 |
b |
* |
| Bradyrhizobiaceae |
2.3±0.3 |
b |
3.5±0.5 |
a |
4.1±0.7 |
a |
3.1±0.8 |
ab |
*** |
| Unclassified Bradyrhizobiaceae (f) |
1.3±0.7 |
a |
1.3±0.2 |
a |
1.3±0.2 |
a |
0.4±0.2 |
b |
*** |
| Bradyrhizobium |
0.9±0.3 |
b |
2.0±0.4 |
a |
2.7±0.5 |
a |
2.5±0.8 |
a |
*** |
| Devosia |
2.2±0.5 |
ab |
2.4±0.7 |
a |
1.7±0.6 |
ab |
1.5±0.2 |
b |
* |
| Comamonadaceae |
2.1±1.1 |
c |
4.8±1.0 |
b |
4.0±1.0 |
b |
8.2±1.9 |
a |
*** |
| Unclassified Comamonadaceae (f) |
1.7±0.8 |
c |
3.5±0.8 |
b |
3.0±1.0 |
b |
6.2±1.5 |
a |
*** |
| Phyllobacteriaceae |
1.7±0.4 |
a |
2.1±0.3 |
a |
1.9±0.4 |
a |
0.9±0.3 |
b |
*** |
| Mesorhizobium |
1.3±0.2 |
a |
1.6±0.2 |
a |
1.5±0.4 |
a |
0.7±0.2 |
b |
*** |
| Cytophagaceae |
1.0±0.3 |
b |
1.0±0.2 |
b |
0.7±0.2 |
b |
1.7±0.6 |
a |
*** |
| Flavobacterium |
0.9±0.5 |
a |
1.1±0.6 |
a |
0.2±0.1 |
b |
0.4±0.5 |
ab |
** |
| Actinosynnemataceae |
0.8±0.3 |
b |
1.1±0.4 |
b |
2.2±0.2 |
a |
1.9±0.9 |
a |
*** |
| Kutzneria |
0.2±0.2 |
b |
0.3±0.2 |
b |
1.2±0.3 |
a |
0.8±0.8 |
ab |
** |
| Sinobacteraceae |
0.6±0.2 |
c |
1.5±0.5 |
b |
2.4±0.6 |
b |
8.9±2.0 |
a |
*** |
| Steroidobacter |
0.3±0.1 |
d |
0.7±0.2 |
c |
1.6±0.5 |
b |
5.9±1.0 |
a |
*** |
| Unclassified Sinobacteraceae (f) |
0.3±0.1 |
c |
0.7±0.3 |
b |
0.8±0.1 |
b |
3.0±1.1 |
a |
*** |
| Dokdonella |
0.3±0.1 |
c |
0.9±0.1 |
b |
1.6±0.3 |
a |
1.5±0.5 |
a |
*** |
| Unclassified Gammaproteobacteria (c) |
0.5±0.7 |
b |
0.4±0.3 |
b |
0.2±0.1 |
b |
3.6±2.2 |
a |
*** |
| Unclassified Ellin329 (o) |
0.3±0.1 |
b |
0.7±0.3 |
ab |
1.2±0.7 |
a |
1.1±0.3 |
a |
*** |
| Haliangiaceae |
0.2±0.1 |
b |
0.2±0.2 |
b |
0.4±0.2 |
b |
1.4±0.9 |
a |
*** |
| Amycolatopsis |
0.2±0.1 |
b |
0.4±0.2 |
b |
1.1±0.2 |
a |
1.3±0.5 |
a |
*** |
| Unclassified Myxococcales (o) |
0.1±0.1 |
c |
0.1±0.1 |
c |
0.4±0.2 |
b |
2.2±0.7 |
a |
*** |
a Taxa with relative abundances of 1% or more than 1% in any one of the sampling months are shown. Relative abundance was calculated based on 5,491 reads per sample. Letters (f, c, and o) in parentheses indicate taxonomic units (family, class, and order, respectively).
b Results are shown as the average±S.D. (n=6). The same letter indicates no significant difference among the months, and months with high, low, and moderate abundances are highlighted with dark gray, white, and light gray backgrounds, respectively.
c *, **, and *** indicate a significant difference among months by a one-way ANOVA at P<0.05, P<0.01, and P<0.001, respectively.
d Unclassified Chitinophagaceae (f)’ and (f)” stand for “f__Chitinophagaceae;g__” and “f__Chitinophagaceae;__”, respectively, as outputs with taxonomic analyses at the genus level.
At the family to species levels (Table 4), the relative abundances of seven dominant taxa in June (C. henricii, Janthinobacterium, Kribbella, Pedobacter, Rhodanobacter, Sphingobium, and Streptomyces) were the highest and then gradually decreased in subsequent months. The relative abundances of 12 other dominant taxa in June (Asticcacaulis biprosthecium, Unclassified Bradyrhizobiaceae, unclassified
Chitinophagaceae [classified as “Chitinophagaceae;g__” in the Greengenes database], C. arvensicola, Devosia, Mesorhizobium, Novosphingobium, unclassified Oxalobacteraceae, Pseudomonas, Rhizobium, Sphingomonas, and Sphingopyxis) were higher in July and/or August. Among the minor taxa in June, the relative abundances of eight taxa (Agrobacterium, Amycolatopsis, Bradyrhizobium, Dokdonella, unclassified Ellin329, Flavobacterium, Kutzneria, and Sphingomonas azotifigens) were higher in July and/or August as dominant taxa. In contrast, the relative abundances of ten minor taxa in June (Amycolatopsis, Bradyrhizobium, unclassified Chitinophagaceae [classified as “Chitinophagaceae;__” in the Greengenes database], unclassified Comamonadaceae, Dokdonella, unclassified Gammaproteobacteria, Haliangiaceae, unclassified Myxococcales, unclassified Sinobacteraceae, and Steroidobacter) were higher in September as dominant taxa. The relative abundances of only two dominant taxa in June (unclassified Comamonadaceae and Cytophagaceae) were significantly higher in September. In contrast to the taxa described above, the relative abundances of ten dominant taxa (Burkholderia, Unclassified Cytophagaceae, Unclassified Haliangiaceae, Hyphomicrobiaceae, Lysobacter, Niastella, Unclassified Rhizobiaceae, Unclassified Rhodanobacter, and Unclassified Sphingobacteriaceae), which were 1% or more than 1% in any one of the sampling months, did not significantly differ among sampling months (Table S2 and S3).
At the ASV level, the relative abundances of 12 dominant ASVs in June (ASV_001 [Streptomyces], ASV_003 [C. henricii], ASV_012 [Kribbella], ASV_014 [Pedobacter], ASV_015 [Sphingobium], ASV_019 [Rhodanobacter], ASV_022
[Oxalobacteraceae], ASV_030 [Janthinobacterium], ASV_032
[A. biprosthecium], ASV_038 [Kribbella], ASV_039 [Streptomyces], and ASV_064 [Streptomycetaceae]) decreased in the later months and were all the lowest in September (Table 2). The relative abundances of five dominant ASVs in June (ASV_002 [Chitinophagaceae], ASV_005 [C. arvensicola], ASV_006 [Rhizobium], ASV_007 [Sphingomonas], and ASV_020 [Pseudomonas]) were the highest in July and/or August and the lowest or low in September. The relative abundances of 17 minor ASVs in June were dominant ASVs in the later months, while 12 (ASV_004 [Bradyrhizobium], ASV_009 [Agrobacterium], ASV_010 [Novosphingobium], ASV_011 [Steroidobacter], ASV_017 [Amycolatopsis], ASV_021 [Chitinophaga], ASV_024 [Sinobacteraceae], ASV_025 [Comamonadaceae], ASV_026 [Steroidobacter], ASV_040 [Comamonadaceae], ASV_046 [Gammaproteobacteria], and ASV_054 [Gammaproteobacteria]) were the highest or high in September. The relative abundances of the remaining five minor ASVs in June (ASV_013 [Novosphingobium], ASV_016 [S. azotifigens], ASV_023 [Novosphingobium], ASV_027 [Dokdonella], ASV_034 [Kutzneria], and ASV_046 [Gammaproteobacteria]) were the highest in July and/or August. In contrast to the taxa described above, the relative abundances of four dominant ASVs, which were 1% or more than 1% in any one of the sampling months (ASV_008 [Niastella], ASV_018 [Devosia], ASV_031 [Sphingobacteriaceae], and ASV_033 [Niastella]), did not significantly differ among the sampling months (Table 2).
An analysis of taxonomic compositions at the ASV level revealed marked differences among taxa for the level of diversity within a taxon. Seven dominant taxa with relative abundances of 1% or more than 1% in any one of the sampling months (Amycolatopsis, A. biprosthecium, C. arvensicola, Kutzneria, and S. azotifigens) were represented by one ASV (Table S4). Although the numbers of ASVs for most of the dominant taxa with relative abundances of 1% or more than 1% in any one of the sampling months were less than 20, those for eight taxa showing high abundances in September (Chitinophagaceae, unclassified Comamonadaceae, Cytophagaceae, unclassified Ellin329, unclassified Gammaproteobacteria, Haliangiaceae, unclassified Myxococcales, and Sinobacteraceae) were 170, 24, 56, 23, 32, 33, 94, and 39, respectively, suggesting high genetic diversity within these taxa (Table S4).
Discussion
Alpha-diversity measures and UniFrac PCoA
Regarding the diversity indexes in Table 1, a singleton indicates the number of a unique sequence in a sample (the number of ASVs containing only one read). Chao1 and ACE are estimators for the lower limit of the expected numbers of ASVs based on a theoretically extended sufficiently large data set employing slightly different weighting methods. Shannon and Simpson indexes are diversity indexes that are calculated based on an experimentally obtained data set employing slightly different weighting methods. Based on overall changes in these alpha-diversity measurements, the diversity of LR bacteria increased between June and August and was saturated in August and September (Table 1). Slight differences between the numbers of ASVs and those of Chao1 and ACE suggested that the amount of sequence data in the present study was technically sufficient to evaluate the diversity of LR bacteria. Marked differences in all diversity indexes among sampling months indicated the importance of a time series analysis for evaluating the diversity of LR bacteria of sugar beet. Shannon and Simpson indexes revealed that the abundance of the dominant groups rapidly changed between June and July, while other indexes confirmed a gradual increase in the taxonomic composition mainly in the minor groups between June and August.
The unweighted UniFrac distance represents qualitative differences in microbial community structures among samples based on the presence/absence of data on each of the microbial taxa observed, while the weighted UniFrac distance represents quantitative differences in those based on both of the presence/absence of data on microbial taxa and the abundance of data on each of these taxa (Wu et al., 2010). Unweighted and weighted UniFrac PCoA (Fig. 1) revealed that the continuous succession of bacterial communities during the growth of sugar beet had occurred in the lateral roots. Houlden et al. (2008) reported distinct differences in microbial community structures in the rhizosphere (tuber peelings) among the different growth stages of sugar beet. Shifts in clusters in July and August samples to the same direction along with PC2 in unweighted and weighted UniFrac PCoA (8.5 and 19.4% in Fig. 1A and B, respectively) indicated that the bacterial community structures in July and August samples were more similar to each other than to those in June and September samples. The loose cluster of June samples may reflect the small influence of the root on the rhizosphere microbiome due to the low daily minimum temperature and precipitation in June at the experimental site (Fig. S2). The large loose cluster of September samples (Fig. 1B) most likely reflects the senescence of rhizosphere-related organic matter because sugar beet gradually stops vegetative growth in September at the experimental site (Fig. S1) and begins to accumulate sugar from above-ground tissues to the taproot. These results revealed that the bacterial community structure in lateral roots rapidly, markedly, and continuously changed during the growth period of sugar beet, indicating the importance of time series analyses to evaluate bacterial diversity in the rhizosphere.
Overview of taxonomic features of lateral root-associated bacteria
Although sugar beet is one of the major crops in temperate regions, only a few studies have conducted a bacterial community analysis of its phytosphere. By using PhyloChip, Mendes et al. (2011) reported that Proteobacteria was the most dominant phylum followed by Firmicutes, Actinobacteria, and Bacteroidetes in the rhizosphere soil of sugar beet seedlings grown in arable soil, while Hudz and Skivka (2021) showed that the rhizosphere soil bacteria of sugar beet were exclusively dominated by Proteobacteria and Actinobacteria. Shi et al. (2014) demonstrated that the endophytic bacteria of the taproot were exclusively dominated by Proteobacteria, particularly Alphaproteobacteria, throughout the entire growth stages of sugar beet. By using a metagenomic analysis, Tsurumaru et al. (2015) showed that the endophytic bacteria of the taproot were dominated by Proteobacteria, particularly Alphaproteobacteria, and Actinobacteria. In the present study, Proteobacteria, Actinobacteria, and Bacteroidetes were identified as the dominant phyla in the lateral roots of sugar beet (Fig. 2A and Table S2). We previously demonstrated the dominance of these phyla in the lateral roots of sugar beet based on clone library analyses (Okazaki et al., 2021). Consistent with previous findings from community analyses of taproot-associated bacteria, the dominance of Alphaproteobacteria was noted in the present study because this class potentially includes a number of beneficial bacterial groups (Garrido-Oter et al., 2018; Okazaki et al., 2021). In contrast to previous studies conducted on the taproot of sugar beet, the dominance of Bacteroidetes in the lateral roots and rhizosphere soil indicates the high affinity of this phylum bacteria for the exudates of lateral roots because Bacteroidetes is generally considered to be a copiotrophic bacterial group using abundant labile C sources (Fierer et al., 2007). However, since the soil types used in experiments may result in marked differences in rhizosphere bacterial diversities, even at the high taxonomic level, such as the phylum level, as shown by Zachow et al. (2014), the findings of bacterial community analyses conducted in different experimental sites need to be carefully compared and interpretated. In addition, since the morphology and physiology of the underground tissues of sugar beet markedly changed during plant growth, time series analyses of the bacterial communities of holistic rhizosphere compartments with different soil types are needed to obtain a more detailed understanding of the characteristics of sugar beet rhizosphere bacteria.
Seasonal shifts in lateral root-associated bacterial community structures
Examinations of seasonal changes of bacterial community structures in lateral roots revealed significant changes in the relative abundances of small numbers of dominant taxa at high taxonomic levels, from phylum to order, during sugar beet growth (Table 3), and the diversity of the bacterial community increased at low taxonomic levels, from family to ASV, as sugar beet grew (Table 2 and 4). The dominant taxa showing high abundances in July and/or August may contribute to the rapid growth of sugar beet (Fig. S1) and may explain the shifts in bacterial community structures along with PC2 for July and August samples in Fig. 1. Five genera in Rhizobiales (Agrobacterium, Bradyrhizobium, Devosia, Mesorhizobium, and Rhizobium) and four genera in Sphingomonadales (Novosphingobium, Sphingobium, Sphingomonas, and Sphingopyxis) detected as LR bacteria in the present study (Table 4) are all known to include a number of beneficial bacterial groups for plant growth promotion (Antoun et al., 1998; Vurukonda et al., 2016; Zhang et al., 2016; Garrido-Oter et al., 2018; Okazaki et al., 2021; Chhetri et al., 2022). S. azotifigens (Table 2 and 4) is also expected to have the potential to promote plant growth as a nitrogen-fixing bacterium in roots (Xie and Yokota, 2006). Although the ecological role of Caulobacterales in the roots is largely unknown and plant growth-promoting effects have not been reported for C. henricii or A. biprosthecium, isolates belonging to the genera Caulobacter and Asticcacaulis were recently shown to exert these effects (Luo et al., 2019; Yang et al., 2019; Berrios, 2021; Okazaki et al., 2021).
Since four orders (Burkholderiales, Pseudomonadales, Actinomycetales, Sphingobacteriales, and Flavobacteriales) listed in Table 3 are known to exhibit high antagonistic activity against several plant pathogens as well as plant growth-promoting effects (O’Sullivan and O’Gara, 1992; Doumbou et al., 2001; Francis et al., 2014; Yin et al., 2021), the bacterial members of these orders may play an important role in the protection of sugar beet, particularly in the early growth stage (seedling stage), which is considered to be vulnerable to diverse pathogens and abiotic stresses. Changes in the abundances of major taxa in these orders (showing high abundances in June) may explain the shifts in bacterial community structures along with PC1 in Fig. 1. Two peaks of high relative abundance of Burkholderiales in the early growth stage (June and July) and sugar accumulation stage (September) suggest the presence of diverse members with ecologically different functions in this order, such as the high abundances of Oxalobacteraceae and Comamonadaceae in the early growth stage (June and July) and September, respectively, as shown in Table 4. Janthinobacterium belonging to Oxalobacteraceae in the wheat rhizosphere was recently associated with disease suppression against Rhizoctonia solani (Dilla-Ermita et al., 2021), and a Janthinobacterium bacterium derived from the wheat rhizosphere was found to exhibit antagonistic activity against Pythium and Rhizoctonia spp. (Yin et al., 2021). In the present study, one dominant ASV (ASV_022 in Table 2) corresponding to unclassified Oxalobacteraceae was identified and the representative sequence showed 100% identity to species of Herbaspirillum, Herminiimonas, and Oxalicibacterium (Table S5). These three genera were shown to have intimate relationships with sugar beet; however, direct evidence for plant growth-promoting effects has only been obtained for Herbaspirillum (Monteiro et al., 2012). Bacteria belonging to Herbaspirillum and Herminiimonas were isolated from the taproot of sugar beet (Okazaki et al., 2014). Oxalicibacterium has been reported as a leaf endophyte associated with the yield increase of sugar beet (Della Lucia et al., 2021). Two dominant ASVs (ASV_040 and ASV_025 in Table 2) belonging to Comamonadaceae were identified in the present study. Blast analyses revealed that the representative sequence of ASV_040 showed 100% identity to the sequences of Rhizobacter and Methylibium (Table S5). While the type species of Rhizobacter is known as a plant pathogen (Goto, 2015), the ecological significance of the interaction between plants and other species in this genus remains unclear. Regarding Methylibium, an isolate belonging to this genus was shown to exert plant growth-promoting effects (Santiago et al., 2017). A representative sequence of ASV_025 showed 100% identity to Polaromonas and Variovorax. Isolates belonging to these genera have been reported to exert plant growth-promoting effects on sugar beet (Okazaki et al., 2021).
In the present study, Streptomyces and Pseudomonas were also highly abundant in June and July (Table 2 and 4), both of which are considered to be more vulnerable plant growth stages to pathogens, such as Rhizoctonia, than the later months (August and September). Therefore, the presence of these taxa in the rhizosphere may be important for protecting the young vulnerable seedlings of sugar beet from damping-off caused by fungal pathogens. Pseudomonas and Streptomyces species have been reported to exhibit strong antagonistic activity against R. solani (Zachow et al., 2008; Postma et al., 2010). Mendes et al. (2011) also showed that the abundances of Burkholderiaceae, Pseudomonadaceae, and Actinobacteria were strongly associated with the suppression of root rot caused by R. solani in the rhizosphere of sugar beet seedlings. One dominant ASV identified for Streptomyces (ASV_001) in the present study shared 100% identity with Streptomyces scabiei and Streptomyces turgidiscabies (Table S5). Consistent with these results, sugar beet has been reported as an alternate host for S. turgidiscabie, and, thus, potato production following sugar beet cultivation may cause an outbreak of potato common scab, as reported by Sakuma et al. (2011). Besides Streptomyces, three genera in Actinomycetales (Kribbella, Kutzneria, and Amycolatopsis) were identified as dominant genera (Table 2 and 4). Some endophytic isolates belonging to Kribbella have been reported to possess plant growth-promoting traits and exhibit antagonistic activity against several fungal pathogens (Borah and Thakur, 2020). Zhang et al. (2022) recently reported the disease-suppressive ability of Kribbella through its activation of the plant immune system (Zhang et al., 2022). Plant growth-promoting effects and antagonistic activity against fungal pathogens have also been demonstrated for Kutzneria (Devi et al., 2021) and Amycolatopsis (Alekhya and Gopalakrishnan, 2016; Gopalakrishnan et al., 2019; Cabrera et al., 2020). Pedobacter and Flavobacterium were identified in the present study as the dominant genera in Sphingobacteriales and Flavobacteriales, respectively. These genera have also been shown to exert plant growth-promoting effects and exhibit antagonistic activity against fungal pathogens (de Boer et al., 2007; Yin et al., 2013; Kolton et al., 2016; Morais et al., 2019). The high abundances of potential antagonistic taxa at the initial growth stage of sugar beet, as described above, are considered to be very important for protecting vulnerable young seedlings from pathogens, and this appears to be consistent with the speculation that the rhizosphere of a modern cultivar of sugar beet has the ability to enrich a higher antagonistic potential than that of wild beet, as reported by Zachow et al. (2014).
In contrast to the orders described above, increases in the relative abundances of Chloroflexi, Cytophagales, Ellin329, Myxococcales, Saprospirales, Verrucomicrobia, and Xanthomonadales in August and/or September appeared to be associated with the accumulation of organic matter in the mature or senescence rhizosphere. Therefore, the majority of known bacteria in these orders are considered not only to aggressively interact with plants, but also passively associate with plants through the degradation of plant-derived organic matter in the rhizosphere. Bacteria in the rhizosphere of young plants preferentially utilize simple low-molecular-weight compounds, such as amino acids, whereas bacteria in the rhizosphere of mature plants efficiently utilize more recalcitrant organic matter, including high-molecular-weight carbohydrates (Houlden et al., 2008). Bacterial members of Chloroflexi, Ellin329, and Verrucomicrobia are well-known degraders of organic matter derived from plant tissues under anaerobic conditions (Chin et al., 2001; Podosokorskaya et al., 2013; Harbison et al., 2016). The high abundance of Myxococcales, including Haliangiaceae, in September most likely reflects the high activity of their bacterial predation in the mature rhizosphere, which harbors a high microbial biomass. As previously reported by Wang et al. (2020) for bulk soils of arable lands, the relative abundance of Myxococcales in the present study also positively correlated with diversity indexes (the number of ASVs, Chao1, ACE, and the Shannon index in Fig. S3 and S4), indicating that Myxococcales is also important for regulating bacterial community structures in the rhizosphere of sugar beet. Besides bacterial predation, some members of Myxococcales have the ability to decompose diverse organic matter (Dworkin, 1966; Reichenbach, 2015), and this trait may be advantageous for proliferation in the organic-rich, mature rhizosphere. Several bacterial members in Cytophagales and Saprospirales are well-known degraders of plant-derived organic macromolecules under aerobic conditions (Hargreaves et al., 2015; Nakagawa, 2015). In Cytophagles, the high abundance of Cytophagaceae in September (Table 4) may be related to the increase in the microbial biomass in the mature rhizosphere because this family are bacterial predators (Pérez et al., 2016). In Saprospirales, Chitinophagaceae appeared to be one of the highly dominant taxa throughout all of the growth stages investigated (Table 4). C. arvensicola exhibits the ability to degrade plant-derived polysaccharides, such as xylan and laminarin (Pankratov et al., 2006). Although the potential ability for biological control based on chitinase activity has been discussed for Chitinophaga, this plant growth-promoting effects of this genus have not yet been confirmed. The high diversities of Cytophagaceae and unclassified Chitinophagaceae at the ASV levels and the complex patterns for the dynamics of their relative abundances observed in the present study (Table S4) imply the high ecological adaptability of these taxa for utilizing diverse organic compounds in the rhizosphere, which may be related to the formation of the loose cluster in September samples in Fig. 1.
While the order of Xanthomonadales includes a number of major plant pathogens, it also harbors diverse bacterial groups with various ecological characteristics most likely due to the early divergence of this bacterial group within the class Gammaproteobacteria (Naushad et al., 2015). Therefore, it is difficult to speculate or discuss a representative ecological feature for Xanthomonadales based on simple relative abundance data at the order level. The relative abundance of Rhodanobacter was the highest in June and the lowest in September, while the relative abundances of Steroidobacter and Dokdonella showed the opposite trend. Rhodanobacter has been reported to exert plant growth-promoting effects (Thijs et al., 2014) and has also been shown to exhibit antagonistic activity against fungal pathogens (de Clercq et al., 2006; Shin et al., 2007; Huo et al., 2018). The gradual increase observed in the relative abundance of Steroidobacter between June and September may have contributed to a reduction in several environmental stresses and promoted the growth of sugar beet because the relative abundance of this genus in the rhizosphere was previously shown to positively correlate with the disease suppressiveness of soils (Vida et al., 2016; Wang et al., 2019; Mayerhofer et al., 2021). Furthermore, Steroidobacter has been shown to induce stem and root elongation by alleviating environmental stresses with the production of brassinosteroids in the rhizosphere (Zarraonaindia et al., 2015). Although Dokdonella has been identified as an active member of the rhizosphere (Gkarmiri et al., 2017), the ecological role of this genera in the phytosphere remains unknown. The shifts in bacterial community structures described above suggest that the major taxa showing high abundances in June, July, and August are mainly plant growth promoters, while those in September most likely play an ecological role as degraders of organic matter derived from root senescence.
Seasonal shifts in beneficial bacterial genera in lateral roots for plant growth promotion
PGPB for sugar beet have been identified in 21 genera (Table S6). The majority of the genera for PGPB isolated from the lateral roots in our previous study (Asticcacaulis, Mesorhizobium, Polaromonas, Sphingobium, Sphingomonas, and Sphingopyxis) (Okazaki et al., 2021) were highly abundant in the active growth period of sugar beet (between June and August) in the present study, suggesting the contribution of these PGPB to the growth of sugar beet under field conditions. Other PGPB in sugar beet, such as Pseudomonas, Flavobacterium, Paenibacillus, and Bacillus, also showed high abundances in the early growth stages (June and/or July). The relative abundances of Burkholderia and Lysobacter were moderate and remained relatively constant between June and September, while the other genera reported for sugar beet PGPB were detected as minor taxa in the present study. These results indicate the high efficiency of the community analysis-based screening of potential beneficial microbes for agricultural practice in our previous study (Okazaki et al., 2021).
In conclusion, the time series analyses of bacterial diversity in the lateral roots of sugar beet grown in an Andosol field in Japan revealed that marked seasonal shifts in bacterial community structures occurred in the lateral roots from the late seedling to sugar accumulation stages. Bacterial diversity in the lateral roots was exclusively dominated by only three phyla (Proteobacteria, Actinobacteria, and Bacteroidetes) from the late seedling to sugar accumulation stages of sugar beet. At the lower taxonomic levels, dominant taxa were roughly classified into three groups showing high abundances in the late seedling (June), rapid growth (July and August), and sugar accumulation (September) stages. Among these dominant taxa, the plant growth-promoting effects of 12 genera (Amycolatopsis, Bradyrhizobium, Caulobacter, Devosia, Flavobacterium, Janthinobacterium, Kribbella, Kutzneria, Pedobacter, Rhizobium, Rhodanobacter, and Steroidobacter) warrant further investigation as good candidates for PGPB of sugar beet based on culture-dependent methods because they have beneficial traits as biopesticides and/or biofertilizers for several other crops. The present results clearly indicate that time series analyses of microbial communities during plant growth stages provide valuable information for understanding the ecological roles of plant-associated microbes and accelerating the practical use of the beneficial functions of PGPB under field conditions.
Citation
Ikeda, S., Okazaki, K., Takahashi, H., Tsurumaru, H., and Minamisawa, K. (2023) Seasonal Shifts in Bacterial Community Structures in the Lateral Root of Sugar Beet Grown in an Andosol Field in Japan. Microbes Environ 38: ME22071.
https://doi.org/10.1264/jsme2.ME22071
Acknowledgements
The present study was supported by Forestry and Fisheries, Japan, through research projects entitled “Science and Technology Research Promotion for Agriculture, Forestry, Fisheries, and the Food Industry”. A part of this study was also supported by JSPS KAKENHI Grant Number 19K05759 from the Ministry of Education, Science, Sports and Culture of Japan.
References
- Alekhya, G., and Gopalakrishnan, S. (2016) Exploiting plant growth-promoting Amycolatopsis sp. in chickpea and sorghum for improving growth and yield. J Food Legumes
29: 225–231.
- Antoun, H., Beauchamp, C.J., Goussard, N., Chabot, R., and Lalande, R. (1998) Potential of Rhizobium and Bradyrhizobium species as plant growth promoting rhizobacteria on non-legumes: effect on radishes (Raphanus sativus L.). In Molecular Microbial Ecology of the Soil. Hardarson, G., and Broughton, W.J. (eds). Dordrecht: Springer, pp. 57–67.
- Berrios, L. (2021) Complete genome sequence of the plant-growth-promoting bacterium Caulobacter segnis CBR1. Curr Microbiol
78: 2935–2942.
- Bolyen, E., Rideout, J.R., Dillon, M.R., Bokulich, N.A., Abnet, C.C., Al-Ghalith, G.A., et al. (2019) Reproducible, interactive, scalable and extensible microbiome data science using QIIME 2. Nat Biotechnol
37: 852–857.
- Borah, A., and Thakur, D. (2020) Phylogenetic and functional characterization of culturable endophytic actinobacteria associated with Camellia spp. for growth promotion in commercial tea cultivars. Front Microbiol
11: 318.
- Bulgari, D., Montagna, M., Gobbi, E., and Faoro, F. (2019) Green technology: bacteria-based approach could lead to unsuspected microbe–plant–animal interactions. Microorganisms
7: 44.
- Cabrera, R., García-López, H., Aguirre-von-Wobeser, E., Orozco-Avitia, J.A., and Gutiérrez-Saldaña, A.H. (2020) Amycolatopsis BX17: An actinobacterial strain isolated from soil of a traditional milpa agroecosystem with potential biocontrol against Fusarium graminearum. Biol Control
147: 104285.
- Çakmakçi, R., Kantar, F., and Algur, Ö.F. (1999) Sugar beet and barley yields in relation to Bacillus polymyxa and Bacillus megaterium var. phosphaticum inoculation. J Plant Nutr Soil Sci
162: 437–442.
- Çakmakçi, R., Kantar, F., and Sahin, F. (2001) Effect of N2-fixing bacterial inoculations on yield of sugar beet and barley. J Plant Nutr Soil Sci
164: 527–531.
- Çakmakçi, R., Dönmez, F., Aydın, A., and Şahin, F. (2006) Growth promotion of plants by plant growth-promoting rhizobacteria under greenhouse and two different field soil conditions. Soil Biol Biochem
38: 1482–1487.
- Caporaso, J.G., Kuczynski, J., Stombaugh, J., Bittinger, K., Bushman, F.D., Costello, E.K., et al. (2010) QIIME allows analysis of high-throughput community sequencing data. Nat Methods
7: 335–336.
- Caporaso, J.G., Lauber, C.L., Walters, W.A., Berg-Lyons, D., Lozupone, C.A., Turnbaugh, P.J., et al. (2011) Global patterns of 16S rRNA diversity at a depth of millions of sequences per sample. Proc Natl Acad Sci U S A
108: 4516–4522.
- Chhetri, G., Kim, I., Kang, M., Kim, J., So, Y., and Seo, T. (2022) Devosia rhizoryzae sp. nov., and Devosia
oryziradicis sp. nov., novel plant growth promoting members of the genus Devosia, isolated from the rhizosphere of rice plants. J Microbiol
60: 1–10.
- Chin, K.J., Liesack, W., and Janssen, P.H. (2001) Opitutus terrae gen. nov., sp. nov., to accommodate novel strains of the division ‘Verrucomicrobia’ isolated from rice paddy soil. Int J Syst Evol Microbiol
51: 1965–1968.
- Compant, S., Clément, C., and Sessitsch, A. (2010) Plant growth-promoting bacteria in the rhizo-and endosphere of plants: their role, colonization, mechanisms involved and prospects for utilization. Soil Biol Biochem
42: 669–678.
- de Boer, W., Wagenaar, A.M., Klein Gunnewiek, P.J., and van Veen, J.A. (2007) In vitro suppression of fungi caused by combinations of apparently non-antagonistic soil bacteria. FEMS Microbiol Ecol
59: 177–185.
- de Clercq, D., Van Trappen, S., Cleenwerck, I., Ceustermans, A., Swings, J., Coosemans, J., and Ryckeboer, J. (2006) Rhodanobacter spathiphylli sp. nov., a gammaproteobacterium isolated from the roots of Spathiphyllum plants grown in a compost-amended potting mix. Int J Syst Evol Microbiol
56: 1755–1759.
- de Vries, S.C., van de Ven, G.W., van Ittersum, M.K., and Giller, K.E. (2010) Resource use efficiency and environmental performance of nine major biofuel crops, processed by first-generation conversion techniques. Biomass Bioenergy
34: 588–601.
- Della Lucia, M.C., Bertoldo, G., Broccanello, C., Maretto, L., Ravi, S., Marinello, F., et al. (2021) Novel effects of leonardite-based applications on sugar beet. Front Plant Sci
12: 646025.
- Devi, T.S., Vijay, K., Vidhyavathi, R.M., Kumar, P., Govarthanan, M., and Kavitha, T. (2021) Antifungal activity and molecular docking of phenol, 2,4-bis (1,1-dimethylethyl) produced by plant growth-promoting actinobacterium Kutzneria sp. strain TSII from mangrove sediments. Arch Microbiol
203: 4051–4064.
- Dilla-Ermita, C.J., Lewis, R.W., Sullivan, T.S., and Hulbert, S.H. (2021) Wheat genotype-specific recruitment of rhizosphere bacterial microbiota under controlled environments. Front Plant Sci
12: 718264.
- Doumbou, C.L., Hamby Salove, M.K., Crawford, D.L., and Beaulieu, C. (2001) Actinomycetes, promising tools to control plant diseases and to promote plant growth. Phytoprotection
82: 85–102.
- Dunne, C., Moënne-Loccoz, Y., McCarthy, J., Higgins, P., Powell, J., Dowling, D.N., and O’gara, F. (1998) Combining proteolytic and phloroglucinol-producing bacteria for improved biocontrol of Pythium-mediated damping-off of sugar beet. Plant Pathol
47: 299–307.
- Dworkin, M. (1966) Biology of the myxobacteria. Annu Rev Microbiol
20: 75–106.
- Fierer, N., Bradford, M.A., and Jackson, R.B. (2007) Toward an ecological classification of soil bacteria. Ecology
88: 1354–1364.
- Francis, I.M., Jochimsen, K.N., de Vos, P., and van Bruggen, A.H. (2014) Reclassification of rhizosphere bacteria including strains causing corky root of lettuce and proposal of Rhizorhapis suberifaciens gen. nov., comb. nov., Sphingobium mellinum sp. nov., Sphingobium xanthum sp. nov. and Rhizorhabdus argentea gen. nov., sp. nov. Int J Syst Evol Microbiol
64: 1340–1350.
- Garrido-Oter, R., Nakano, R.T., Dombrowski, N., Ma, K.W., Team, T.A., McHardy, A.C., et al. (2018) Modular traits of the Rhizobiales root microbiota and their evolutionary relationship with symbiotic rhizobia. Cell Host Microbe
24: 155–167.
- Gkarmiri, K., Mahmood, S., Ekblad, A., Alström, S., Högberg, N., and Finlay, R. (2017) Identifying the active microbiome associated with roots and rhizosphere soil of oilseed rape. Appl Environ Microbiol
83: e01938-17.
- Godshall, M.A. (2012) Sugar and other sweeteners. In Handbook of Industrial Chemistry and Biotechnology. Kent, J.A. (ed.) New York, NY: Springer Science+Business Media, pp. 1403–1430.
- Gopalakrishnan, S., Srinivas, V., Naresh, N., Alekhya, G., and Sharma, R. (2019) Exploiting plant growth-promoting Amycolatopsis sp. for bio-control of charcoal rot of sorghum (Sorghum bicolor L.) caused by Macrophomina phaseolina (Tassi) Goid. Arch Phytopathol Pflanzenschutz
52: 543–559.
- Goto, M. (2015) Rhizobacter. In Bergey’s Manual of Systematics of Archaea and Bacteria. Hoboken, NJ: John Wiley & Sons, pp. 1–5.
- Hara, S., Matsuda, M., and Minamisawa, K. (2019) Growth stage-dependent bacterial communities in soybean plant tissues: Methylorubrum transiently dominated in the flowering stage of soybean shoot. Microbes Environ
34: 446–450.
- Harbison, A.B., Carson, M.A., Lamit, L.J., Basiliko, N., and Bräuer, S.L. (2016) A novel isolate and widespread abundance of the candidate alphaproteobacterial order (Ellin 329), in southern Appalachian peatlands. FEMS Microbiol Lett
363: fnw151.
- Hargreaves, S.K., Williams, R.J., and Hofmockel, K.S. (2015) Environmental filtering of microbial communities in agricultural soil shifts with crop growth. PLoS One
10: e0134345.
- Houlden, A., Timms-Wilson, T.M., Day, M.J., and Bailey, M.J. (2008) Influence of plant developmental stage on microbial community structure and activity in the rhizosphere of three field crops. FEMS Microbiol Ecol
65: 193–201.
- Hudz, S.O., and Skivka, L.M. (2021) Formation of the eubacterial complex in the rhyosphere of sugar beet (Beta vulgaris) under different fertilization systems. Biotechnol Acta
14: 81–86.
- Huo, Y., Kang, J.P., Park, J.K., Li, J., Chen, L., and Yang, D.C. (2018) Rhodanobacter ginsengiterrae sp. nov., an antagonistic bacterium against root rot fungal pathogen Fusarium solani, isolated from ginseng rhizospheric soil. Arch Microbiol
200: 1457–1463.
- Ikeda, S., Watanabe, K., Minamisawa, K., and Ytow, N. (2004) Evaluation of soil DNA from arable land in Japan using a modified direct-extraction method. Microbes Environ
19: 301–309.
- Ikeda, S., Suzuki, K., Kawahara, M., Noshiro, M., and Takahashi, N. (2014) An assessment of urea-formaldehyde fertilizer on the diversity of bacterial communities in onion and sugar beet. Microbes Environ
29: 231–234.
- Kloepper, J.W., Leong, J., Teintze, M., and Schroth, M.N. (1980) Enhanced plant growth by siderophores produced by plant growth-promoting rhizobacteria. Nature
286: 885–886.
- Koga, N. (2008) An energy balance under a conventional crop rotation system in northern Japan: Perspectives on fuel ethanol production from sugar beet. Agric Ecosyst Environ
125: 101–110.
- Kolton, M., Erlacher, A., Berg, G., and Cytryn, E. (2016) The Flavobacterium genus in the plant holobiont: ecological, physiological, and applicative insights. In Microbial Models: from Environmental to Industrial Sustainability. Castro-Sowinski, S. (ed.) Singapore: Springer, pp. 189–207.
- Lugtenberg, B., and Kamilova, F. (2009) Plant-growth-promoting rhizobacteria. Annu Rev Microbiol
63: 541–556.
- Luo, D., Langendries, S., Mendez, S.G., De Ryck, J., Liu, D., Beirinckx, S., et al. (2019) Plant growth promotion driven by a novel Caulobacter strain. Mol Plant Microbe Interact
32: 1162–1174.
- Magoc, T., and Salzberg, S.L. (2011) FLASH: fast length adjustment of short reads to improve genome assemblies. Bioinformatics
27: 2957–2963.
- Masuda, S., Bao, Z., Okubo, T., Sasaki, K., Ikeda, S., Shinoda, R., et al. (2016) Sulfur fertilization changes the community structure of rice root-, and soil-associated bacteria. Microbes Environ
31: 70–75.
- Matsuhira, H., Kitazaki, K., Matsui, K., Kubota, K., Kuroda, Y., and Kubo, T. (2022) Selection of nuclear genotypes associated with the thermo-sensitivity of Owen-type cytoplasmic male sterility in sugar beet (Beta vulgaris L.). Theor Appl Genet
135: 1457–1466.
- Mayerhofer, J., Thuerig, B., Oberhaensli, T., Enderle, E., Lutz, S., Ahrens, C.H., et al. (2021) Indicative bacterial communities and taxa of disease-suppressing and growth-promoting composts and their associations to the rhizoplane. FEMS Microbiol Ecol
97: fiab134.
- Mendes, R., Kruijt, M., De Bruijn, I., Dekkers, E., van der Voort, M., Schneider, J.H., et al. (2011) Deciphering the rhizosphere microbiome for disease-suppressive bacteria. Science
332: 1097–1100.
- Monteiro, R.A., Balsanelli, E., Wassem, R., Marin, A.M., Brusamarello-Santos, L.C., Schmidt, M.A., et al. (2012) Herbaspirillum-plant interactions: microscopical, histological and molecular aspects. Plant Soil
356: 175–196.
- Morais, M.C., Mucha, Â., Ferreira, H., Gonçalves, B., Bacelar, E., and Marques, G. (2019) Comparative study of plant growth‐promoting bacteria on the physiology, growth and fruit quality of strawberry. J Sci Food Agric
99: 5341–5349.
- Nakagawa, Y. (2015) Cytophagales. In Bergey’s Manual of Systematics of Archaea and Bacteria. Hoboken, NJ: John Wiley & Sons, pp. 1–2.
- Nakamura, Y., Ishibashi, M., Kamitani, Y., and Tsurumaru, H. (2020) Microbial community analysis of digested liquids exhibiting different methane production potential in methane fermentation of swine feces. Appl Biochem Biotechnol
191: 1140–1154.
- Naushad, S., Adeolu, M., Wong, S., Sohail, M., Schellhorn, H.E., and Gupta, R.S. (2015) A phylogenomic and molecular marker based taxonomic framework for the order Xanthomonadales: proposal to transfer the families Algiphilaceae and Solimonadaceae to the order Nevskiales ord. nov. and to create a new family within the order Xanthomonadales, the family Rhodanobacteraceae fam. nov., containing the genus Rhodanobacter and .... Antonie van Leeuwenhoek
107: 467–485.
- O’Sullivan, D.J., and O’Gara, F. (1992) Traits of fluorescent Pseudomonas spp. involved in suppression of plant root pathogens. Microbiol Rev
56: 662–676.
- Okada, H., and Harada, H. (2007) Effects of tillage and fertilizer on nematode communities in a Japanese soybean field. Appl Soil Ecol
35: 582–598.
- Okazaki, K., Iino, T., Kuroda, Y., Taguchi, K., Takahashi, H., Ohwada, T., et al. (2014) An assessment of the diversity of culturable bacteria from main root of sugar beet. Microbes Environ
29: 220–223.
- Okazaki, K., Tsurumaru, H., Hashimoto, M., Takahashi, H., Okubo, T., Ohwada, T., et al. (2021) Community analysis-based screening of plant growth-promoting bacteria for sugar beet. Microbes Environ
36: ME20137.
- Pankratov, T.A., Kulichevskaya, I.S., Liesack, W., and Dedysh, S.N. (2006) Isolation of aerobic, gliding, xylanolytic and laminarinolytic bacteria from acidic Sphagnum peatlands and emended description of Chitinophaga
arvensicola Kämpfer et al. 2006. Int J Syst Evol Microbiol
56: 2761–2764.
- Pérez, J., Moraleda‐Muñoz, A., Marcos‐Torres, F.J., and Muñoz‐Dorado, J. (2016) Bacterial predation: 75 years and counting!. Environ Microbiol
18: 766–779.
- Podosokorskaya, O.A., Bonch-Osmolovskaya, E.A., Novikov, A.A., Kolganova, T.V., and Kublanov, I.V. (2013) Ornatilinea apprima gen. nov., sp. nov., a cellulolytic representative of the class Anaerolineae. Int J Syst Evol Microbiol
63: 86–92.
- Postma, J., Scheper, R.W.A., and Schilder, M.T. (2010) Effect of successive cauliflower plantings and Rhizoctonia solani AG 2-1 inoculations on disease suppressiveness of a suppressive and a conducive soil. Soil Biol Biochem
42: 804–812.
- Raymaekers, K., Poneta, L., Holtappels, D., Berckmans, B., and Cammuea, B.P.A. (2020) Screening for novel biocontrol agents applicable in plant disease management—A review. Biol Control
144: 104240.
- Reichenbach, H. (2015) Myxococcales. In Bergey’s Manual of Systematics of Archaea and Bacteria. Hoboken, NJ: John Wiley & Sons, pp. 1–31.
- Sakuma, F., Maeda, M., Takahashi, M., Hashizume, K., and Kondo, N. (2011) Suppression of common scab of potato caused by Streptomyces turgidiscabies using lopsided oat green manure. Plant Dis
95: 1124–1130.
- Santiago, C.D., Yagi, S., Ijima, M., Nashimoto, T., Sawada, M., Ikeda, S., et al. (2017) Bacterial compatibility in combined inoculations enhances the growth of potato seedlings. Microbes Environ
32: 14–17.
- Shi, Y., Lou, K., and Li, C. (2009) Promotion of plant growth by phytohormone-producing endophytic microbes of sugar beet. Biol Fertil Soils
45: 645–653.
- Shi, Y., Yang, H., Zhang, T., Sun, J., and Lou, K. (2014) Illumina-based analysis of endophytic bacterial diversity and space-time dynamics in sugar beet on the north slope of Tianshan mountain. Appl Microbiol Biotechnol
98: 6375–6385.
- Shin, D.S., Park, M.S., Jung, S.R., Lee, M.S., Lee, K.H., Bae, K.S., et al. (2007) Plant growth-promoting potential of endophytic bacteria isolated from roots of coastal sand dune plants. J Microbiol Biotechnol
17: 1361–1368.
- Steingrobe, B. (2001) Root renewal of sugar beet as a mechanism of P uptake efficiency. J Plant Nutr Soil Sci
164: 533–539.
- Steingrobe, B. (2005) A sensitivity analysis for assessing the relevance of fine‐root turnover for P and K uptake. J Plant Nutr Soil Sci
168: 496–502.
- Thijs, S., Weyens, N., Sillen, W., Gkorezis, P., Carleer, R., and Vangronsveld, J. (2014) Potential for plant growth promotion by a consortium of stress‐tolerant 2, 4‐dinitrotoluene‐degrading bacteria: isolation and characterization of a military soil. Microb Biotechnol
7: 294–306.
- Toyota, K., and Watanabe, T. (2013) Recent trends in microbial inoculants in agriculture. Microbes Environ
28: 403–404.
- Tsurumaru, H., Okubo, T., Okazaki, K., Hashimoto, M., Kakizaki, K., Hanzawa, E., et al. (2015) Metagenomic analysis of the bacterial community associated with the taproot of sugar beet. Microbes Environ
30: 63–69.
- Unno, Y., Shinano, T., Minamisawa, K., and Ikeda, S. (2015) Bacterial community shifts associated with high abundance of Rhizobium spp. in potato roots under macronutrient-deficient conditions. Soil Biol Biochem
80: 232–236.
- Vida, C., Bonilla, N., de Vicente, A., and Cazorla, F.M. (2016) Microbial profiling of a suppressiveness-induced agricultural soil amended with composted almond shells. Front Microbiol
7: 4.
- Vurukonda, S.S.K.P., Vardharajula, S., Shrivastava, M., and SkZ, A. (2016) Enhancement of drought stress tolerance in crops by plant growth promoting rhizobacteria. Microbiol Res
184: 13–24.
- Wang, G., Govinden, R., Chenia, H.Y., Ma, Y., Guo, D., and Ren, G. (2019) Suppression of Phytophthora blight of pepper by biochar amendment is associated with improved soil bacterial properties. Biol Fertil Soils
55: 813–824.
- Wang, W., Luo, X., Ye, X., Chen, Y., Wang, H., Wang, L., et al. (2020) Predatory Myxococcales are widely distributed in and closely correlated with the bacterial community structure of agricultural land. Appl Soil Ecol
146: 103365.
- Wu, G.D., Lewis, J.D., Hoffmann, C., Chen, Y.Y., Knight, R., Bittinger, K., et al. (2010) Sampling and pyrosequencing methods for characterizing bacterial communities in the human gut using 16S sequence tags. BMC Microbiol
10: 206.
- Xie, C.H., and Yokota, A. (2006) Sphingomonas azotifigens sp. nov., a nitrogen-fixing bacterium isolated from the roots of Oryza sativa. Int J Syst Evol Microbiol
56: 889–893.
- Yang, E., Sun, L., Ding, X., Sun, D., Liu, J., and Wang, W. (2019) Complete genome sequence of Caulobacter flavus RHGG3T, a type species of the genus Caulobacter with plant growth-promoting traits and heavy metal resistance. 3 Biotech
9: 42.
- Yin, C., Hulbert, S.H., Schroeder, K.L., Mavrodi, O., Mavrodi, D., Dhingra, A., et al. (2013) Role of bacterial communities in the natural suppression of Rhizoctonia solani bare patch disease of wheat (Triticum aestivum L.). Appl Environ Microbiol
79: 7428–7438.
- Yin, C., Casa Vargas, J.M., Schlatter, D.C., Hagerty, C.H., Hulbert, S.H., and Paulitz, T.C. (2021) Rhizosphere community selection reveals bacteria associated with reduced root disease. Microbiome
9: 86.
- Zachow, C., Tilcher, R., and Berg, G. (2008) Sugar beet-associated bacterial and fungal communities show a high indigenous antagonistic potential against plant pathogens. Microb Ecol
55: 119–129.
- Zachow, C., Müller, H., Tilcher, R., and Berg, G. (2014) Differences between the rhizosphere microbiome of Beta vulgaris ssp. maritima—ancestor of all beet crops—and modern sugar beets. Front Microbiol
5: 415.
- Zarraonaindia, I., Owens, S.M., Weisenhorn, P., West, K., Hampton-Marcell, J., Lax, S., et al. (2015) The soil microbiome influences grapevine-associated microbiota. mBio
6: e02527-14.
- Zhang, L., Gao, J.S., Kim, S.G., Zhang, C.W., Jiang, J.Q., Ma, X.T., et al. (2016) Novosphingobium oryzae sp. nov., a potential plant-promoting endophytic bacterium isolated from rice roots. Int J Syst Evol Microbiol
66: 302–307.
- Zhang, Z., Zhang, Q., Cui, H., Li, Y., Xu, N., Lu, T., et al. (2022) Composition identification and functional verification of bacterial community in disease‐suppressive soils by machine learning. Environ Microbiol
24: 3405–3419.
