Abstract
Aim: To assess the risks of developing gestational hypertension (GH) and preeclampsia (PE) during pregnancy based on clinical information.
Methods: Using the Perinatal Database of the Japan Society for Obstetrics and Gynecology between 2001 and 2010, we calculated logit scores of GH and PE by multivariate analysis to estimate their individual risk ratios.
Results: The logit score of PE was calculated with the equation −6.45797+0.0308815×(maternal age)−0.673456×(parity: 0 or 1)+0.13388×(fetal gender: boy 0 or girl 1)+1.95706×(pre-existing hypertension: 0 or 1)+1.16486×(pre-existing renal disease: 0 or 1)+0.0891015×(pre-pregnancy body mass index [BMI]). The estimated risk ratios predicted subsequent GH and PE with sensitivities of 61.5% and 67.0%, and specificities of 67.0% and 64.4%, respectively. The areas under the receiver operating characteristic curves for GH and PE were 0.70 and 0.68, respectively.
Conclusions: The estimated risk ratios determined in this study may identify women at high risk of GH or PE before disease onset.
Introduction
Hypertensive disorders in pregnancy, which consist of gestational hypertension (GH) and preeclampsia (PE) and account for approximately 7–12% of all singleton pregnancies worldwide, are the most important complications for maternal and perinatal morbidity and mortality.1) Several distinct risk factors have been reported for PE. We previously reported that risk factor patterns for GH and PE in Japan were similar to those in Western countries, whereas a clear difference was found in the magnitude of associations (age of 40 years or older for GH, and primiparity and renal disease for PE).2) According to the Japan Society for the Study of Hypertension in Pregnancy (JSSHP),3) antepartum risk factors for pregnancy induced hypertension (PIH) included maternal age over 40 years; complications of hypertension, renal disease, diabetes mellitus, and obesity; presence of antiphospholipid antibodies; and a family history of PIH, hypertension, and diabetes mellitus type 2. Maternal risk factors for PIH arising during pregnancy included nulliparity, previous history of PIH, more than 5 years since last gestation, multiple pregnancies, maternal blood pressure of 130 mmHg or more for systolic blood pressure, 80 mmHg or more for diastolic blood pressure, a mean arterial pressure of 90 mmHg or more in the first trimester of pregnancy, urinary tract infection, and periodontal disease.
The development of an accurate screening test to identify women at risk of GH or PE at prenatal visits may assist in providing women with information on unfavorable outcomes prior to delivery. Although several prediction models for PE have been reported to date,4,5,6,7,8,9,10,11,12,13,14,15,16,17,18,19,20,21) they require data from examinations (blood test and/or Doppler velocimetry) and complex questionnaires on maternal background. The present study was conducted in order to determine predictive risk factors for GH and PE in Japan, develop a nomogram for calculating estimated risk ratios of GH and PE, and identify high-risk women in prenatal visits.
Methods
This was a retrospective cohort study using information from a database (DB) assembled by the Perinatal Committee of the Japan Society of Obstetrics and Gynecology under a cooperative agreement with secondary and tertiary hospitals in Japan. Details of the DB have been reported previously.2,22) The DB used in the present study was converted to its present DB structure in 2001. It includes all live births and stillbirths after 22 weeks of gestation at perinatal centers and covers 5.0% of all live births in Japan between 2001 and 2010 (11,036,365 registered live births). This DB protests patient anonymity because of unlinked information. We analyzed maternal backgrounds and perinatal outcomes (GH and PE) in singleton pregnancies after 22 weeks of gestation in Japan between 2001 and 2010.
GH was diagnosed in women with a blood pressure of 140/90 mmHg or more for the first time during pregnancy (after 20 weeks of gestation) but no proteinuria, and in whom blood pressure normalized by 12 weeks postpartum.23) PE was diagnosed if hypertension (blood pressure of 140/90 mmHg or more) accompanied by proteinuria exceeding 300 mg/24 h was evident for the first time after 20 weeks of gestation, and was followed by normalization of these symptoms by 12 weeks postpartum.3) Patients were diagnosed with severe hypertension if blood pressure was 160 mmHg systolic or 110 mmHg diastolic or more on at least two occasions. Patients were diagnosed with severe proteinuria if proteinuria was 2 g/day or more or 3+(300 mg/dl) or more on at least two occasions.23)
Maternal background factors analyzed in the present study included: age, parity, smoking during pregnancy, pre-existing renal disease, pre-existing hypertension, pre-existing diabetes mellitus, pre-pregnancy body mass index (BMI), and fetal gender. These factors have previously been reported as risk factors for GH and PE.
Data analysis
Categorical variables were compared using the chi-squared test and continuous variables using an independent t-test. A series of stepwise logistic regressions were performed. After multivariate analysis of these variables, the logit score (logarithmic risk ratio) (L) was calculated as follows: L=Intercept+a1×(maternal age [years])+a2×(parity: nullipara=0; multipara=1)+ a3×(fetal gender: boy=0; girl=1)+a4×(smoking during pregnancy: no=0; yes=1)+a5×(pre-existing hypertension: no=0; yes=1)+a6×(pre-existing diabetes mellitus: no=0; yes=1)+a7×(pre-existing renal disease: no=0; yes=1)+a8×(pre-pregnancy BMI (weight [kg]/height [m]2)). The disease onset probability (p) of GH and PE among patients was calculated as p=1/(1+exp(−L)). Using the prevalence (P) of GH and PE in the Perinatal DB, the estimated risk ratios of GH and PE in patients were calculated as p/P. Areas under the receiver operating characteristic curves (AUCs) were calculated to determine the performance of different models for predicting GH and PE. Analyses were performed using SAS version 9.1 (SAS Institutes, Cary, NC, USA).
Ethics statement
This study was conducted according to the principles set forth in the Declaration of Helsinki. The Institutional Ethics Committee of Toyama University Hospital approved this study (# Rin- 24–83).
Results
The DB for this analysis comprised data from 553,837 pregnant women, 1.2% of whom developed GH and 2.5% of whom developed PE.
Risk factors for GH and PE
Characteristics of women with GH and PE
Table 1A shows the characteristics of women with GH and PE (bivariate analysis). Risk factors for GH were parity (nulliparity), smoking during pregnancy, pre-existing hypertension, pre-existing renal disease, and pre-existing diabetes mellitus, while those for PE were parity (nulliparity), fetal gender (female), smoking during pregnancy, pre-existing hypertension, pre-existing renal disease, and pre-existing diabetes mellitus.
Table 1. Risk factors for gestational hypertension and preeclampsia
A. Maternal characteristics
| Rate (%) | P | Rate (%) | P |
|---|
| GH | non-GH | PE | non-PE |
|---|
| Parity | | | | | | |
| Nulliparous | 1.4 | 98.6 | <0.001 | 3.2 | 96.8 | <0.001 |
| Multiparous | 1.1 | 98.9 | | 1.9 | 98.1 | |
| Fetal gender | | | | | | |
| Male | 1.3 | 98.7 | 0.008 | 2.4 | 97.6 | <0.001 |
| Female | 1.2 | 98.8 | | 2.7 | 97.3 | |
| Smoking during pregnancy | | | | | | |
| Yes | 1.6 | 98.4 | <0.001 | 2.9 | 97.1 | <0.001 |
| No | 1.2 | 98.8 | | 2.5 | 97.5 | |
| Pre-existing hypertension | | | | | | |
| Yes | 15.9 | 84.1 | <0.001 | 25.8 | 74.2 | <0.001 |
| No | 1.2 | 98.8 | | 2.4 | 97.6 | |
| Pre-existing renal disease | | | | | | |
| Yes | 2.2 | 97.8 | <0.001 | 8.6 | 91.4 | <0.001 |
| No | 1.2 | 98.8 | | 2.5 | 97.5 | |
| Pre-existing diabetes | | | | | | |
| Yes | 2.9 | 97.1 | <0.001 | 5.2 | 94.8 | <0.001 |
| No | 1.2 | 98.8 | | 2.5 | 97.5 | |
B. Crude risk ratios of GH and PE
| Crude risk ratio (95% CI) |
|---|
| GH | P | PE | P |
|---|
| Maternal age | | | | |
| 1.05507 | <0.001 | 1.03198 | <0.001 |
| (1.050070–1.06009) | | (1.02861–1.03537) | |
| Pre-pregnancy BMI | | | | |
| 1.13194 | <0.001 | 1.10803 | <0.001 |
| (1.12541–1.1385) | | (1.10303–1.11305) | |
GH, gestational hypertension; PE, preeclampsia; BMI, body mass index.
Since the objective variables (maternal age and pre-pregnancy BMI) were of a continuous quantity, univariate analysis was performed using logistic regression analysis. Table 1B shows crude risk ratios and 95% confidence intervals (95% CI) for GH and PE in the univariate analysis. Maternal age and pre-pregnancy BMI were risk factors for GH and PE.
Logit scores of GH and PE
Logit score of GH without information about pre-pregnancy BMI
The logit score (logarithmic risk ratio) of GH (LGH) without information about pre-pregnancy BMI was calculated as follows (Table 2A): LGH = −5.95408+ 0.051347× (maternal age [years])−0.40543 × (parity: nullipara = 0; multipara= 1)+ 0.0703909× (fetal gender: boy=0; girl= 1)+0.318237×(smoking during pregnancy: no=0; yes= 1)+ 2.49289×(pre-existing hypertension: no=0; yes= 1)+ 0.520655×(pre-existing diabetes mellitus: no=0; yes= 1)+0.459566×(pre-existing renal disease: no=0; yes= 1). The AUC (95% CI) was 0.62 (0.62–0.62) with a sensitivity (95% CI) of 55.6 (54.3–56.9)%, specificity (95% CI) of 60.8 (60.7–61.0)%, and positive likelihood ratio (95% CI) of 1.42 (1.39–1.45).
Table 2. Logit scores for prediction of gestational hypertension using data collected at prenatal visits
A. Without information about pre-pregnancy BMI (
n=470 705)
| Variables | Regression coefficient | Risk ratio | 95% CI |
|---|
| Intercept | −5.954 | − | − |
| Maternal age (years) | 0.051 | 1.053 | 1.047–1.058 |
| Parity | −0.405 | 0.667 | 0.632–0.703 |
| Fetal gender | 0.070 | 1.073 | 1.019–1.130 |
| Smoking during pregnancy | 0.318 | 1.375 | 1.235–1.521 |
| Pre-existing hypertension | 2.493 | 12.096 | 10.793–13.557 |
| Pre-existing diabetes | 0.521 | 1.683 | 1.488–1.904 |
| Pre-existing renal disease | 0.456 | 1.583 | 1.287–1.948 |
B. With information about pre-pregnancy BMI (
n=273 546)
| Variables | Regression coefficient | Risk ratio | 95% CI |
|---|
| Intercept | −8.343 | − | − |
| Maternal age (years) | 0.050 | 1.051 | 1.044–1.058 |
| Parity | −0.472 | 0.624 | 0.581–0.670 |
| Fetal gender | 0.060 | 1.062 | 0.992–1.138 |
| Smoking during pregnancy | 0.175 | 1.191 | 1.034–1.372 |
| Pre-existing hypertension | 1.575 | 4.830 | 4.112–5.673 |
| Pre-existing renal disease | 0.334 | 1.396 | 1.044–1.868 |
| Pre-pregnancy BMI (kg/m2) | 0.112 | 1.119 | 1.111–1.261 |
BMI, body mass index.
The logit score (logarithmic odds ratio) of GH (LGH) with information about pre-pregnancy BMI was calculated as follows (Table 2B): LGH=−8.3429+0.0496536× (maternal age [years]) – 0.471975×(parity: nullipara=0; multipara= 1)+0.0603091×(fetal gender: boy=0; girl= 1)+0.174949×(smoking during pregnancy: no=0; yes= 1)+1.57485×(pre-existing hypertension: no=0; yes= 1)+0.33391×(pre-existing renal disease: no=0; yes= 1)+0.112408×(pre-pregnancy BMI). The AUC (95% CI) was 0.70 (0.70–0.70) with a sensitivity (95% CI) of 61.5 (59.8–63.1)%, specificity (95% CI) of 67.0 (66.8–67.2)%, and positive likelihood ratio (95% CI) of 1.86 (1.81–1.92).
Logit score of PE without information about pre-pregnancy BMI
The logit score (logarithmic risk ratio) of PE (LPE) without information about pre-pregnancy BMI was calculated as follows (Table 3A): LPE= –4.74497+0.0371973×(maternal age [years]) – 0.633121 × (parity: nullipara=0; multipara= 1)+ 0.0149366×(fetal gender: boy=0; girl= 1)+ 0.216146×(smoking during pregnancy: no=0; yes= 1)+ 2.45258×(pre-existing hypertension: no=0; yes= 1)+ 0.484305×(pre-existing diabetes mellitus: no=0; yes= 1)+ 1.23326×(pre-existing renal disease: no=0; yes= 1). The AUC (95% CI) was 0.64 (0.64–0.64) with a sensitivity (95% CI) of 60.0 (0.59–0.61)%, specificity (95% CI) of 57.6 (57.5–57.7)%, and positive likelihood ratio (95% CI) of 1.42 (1.40–1.44).
Table 3. Logit scores for prediction of preeclampsia using data collected at prenatal visits
A. Without information about pre-pregnancy BMI (
n=476 851)
| Variables | Regression coefficient | Risk ratio | 95% CI |
|---|
| Intercept | −4.745 | − | − |
| Maternal age (years) | 0.037 | 1.038 | 1.034–1.042 |
| Parity | −0.633 | 0.531 | 0.511–0.552 |
| Fetal gender | 0.149 | 1.161 | 1.119–1.204 |
| Smoking during pregnancy | 0.216 | 1.241 | 1.146–1.344 |
| Pre-existing hypertension | 2.453 | 11.618 | 10.630–12.698 |
| Pre-existing diabetes | 0.484 | 1.623 | 1.480–1.780 |
| Pre-existing renal disease | 1.233 | 3.432 | 3.087–3.816 |
B. With information about pre-pregnancy BMI (
n=277 136)
| Variables | Regression coefficient | Risk ratio | 95% CI |
|---|
| Intercept | −6.458 | − | − |
| Maternal age (years) | 0.031 | 1.031 | 1.027–1.036 |
| Parity | −0.673 | 0.510 | 0.484–0.537 |
| Fetal gender | 0.133 | 1.143 | 1.089–1.199 |
| Smoking during pregnancy | 0.098 | 1.103 | 0.993–1.224 |
| Pre-existing hypertension | 1.957 | 7.079 | 6.310–7.940 |
| Pre-existing renal disease | 1.165 | 3.205 | 2.782–3.694 |
| Pre-pregnancy BMI (kg/m2) | 0.089 | 1.093 | 1.087–1.099 |
BMI, body mass index.
The logit score (logarithmic risk ratio) of PE (LPE) with information about pre-pregnancy BMI was calculated as follows (Table 3B): LPE=−6.45797+0.0308815× (maternal age [years]) – 0.673456×(parity: nullipara=0; multipara=1)+0.13388×(fetal gender: boy=0; girl=1)+1.95706×(pre-existing hypertension: no=0; yes=1)+1.16486×(pre-existing renal disease: no=0; yes=1)+0.0891015×(pre-pregnancy BMI). The AUC (95% CI) was 0.68 (0.68–0.68) with a sensitivity (95% CI) of 61.0 (59.9–62.2)%, specificity (95% CI) of 64.4 (64.3–64.6)%, and positive likelihood ratio (95% CI) of 1.72 (1.68–1.75).
Application of calculation sheet for estimated risk ratios of GH and PE
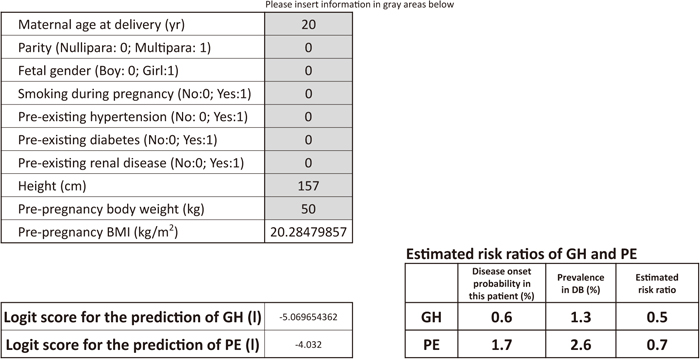
Regression coefficients of predictive variables were converted into a calculation sheet of estimated risk ratios using an Excel table to facilitate practical applications. Using this risk ratio calculation sheet, we easily calculated the disease onset probability (p) after adding information to the calculation sheet.
As an example of how to use the score sheet, a 20-year-old, nulliparous woman (height: 157 cm, pre-pregnancy body weight 50 kg, pre-pregnancy BMI: 20.3) presenting at a prenatal visit, having no habit of smoking and no medical complications, would have estimated risk ratios of 0.5 (=disease onset probability of the patient/prevalence in DB=0.6/1.3) for GH and 0.7 (=disease onset probability of the patient/prevalence in DB=1.7/2.6) for PE (Figure 1). As another example, a 32-year-old, nulliparous woman (height: 157 cm, pre-pregnancy body weight: 76 kg, pre-pregnancy BMI: 30.8), presenting at a prenatal visit, having no medical complications, would have estimated risk ratios of 2.9 (=disease onset probability of the patient/prevalence in DB=3.6/1.3) for GH and 2.4 (=disease onset probability in the patient/prevalence in DB=6.2/2.6) for PE (Figure 2).
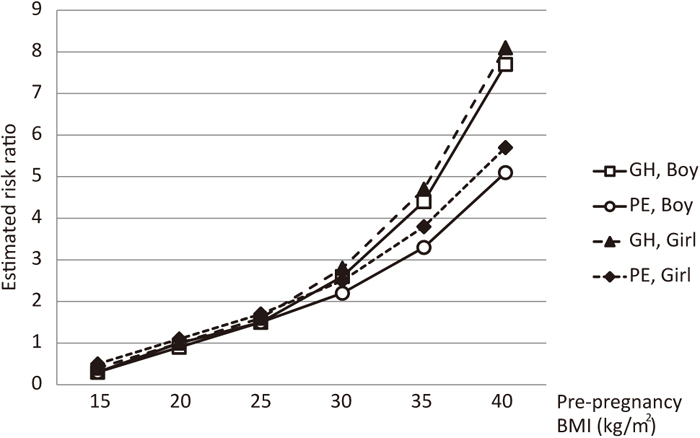
In the normotensive group, the estimated risk ratios of GH and PE increased gradually to less than 2 as the age of mothers increased (Figure 3), whereas the estimated risk ratios of GH and PE markedly increased to approximately 8 and 5, respectively, as the pre-pregnancy BMI of mothers increased (Figure 4).
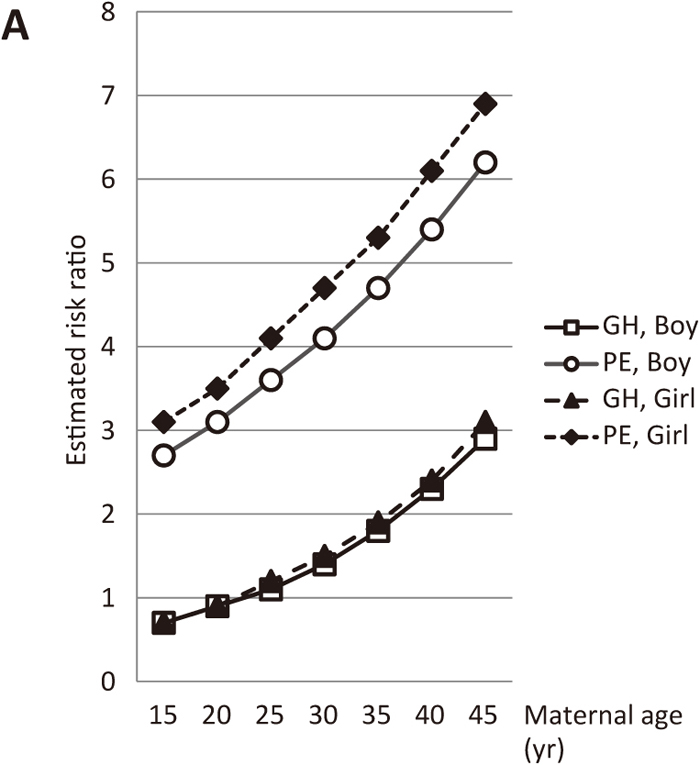
In contrast, in the pre-existing hypertensive and diabetic group, the estimated risk ratios of GH and PE markedly increased as the age and/or pre-pregnancy BMI of mothers increased (Figures 5A and 5B).
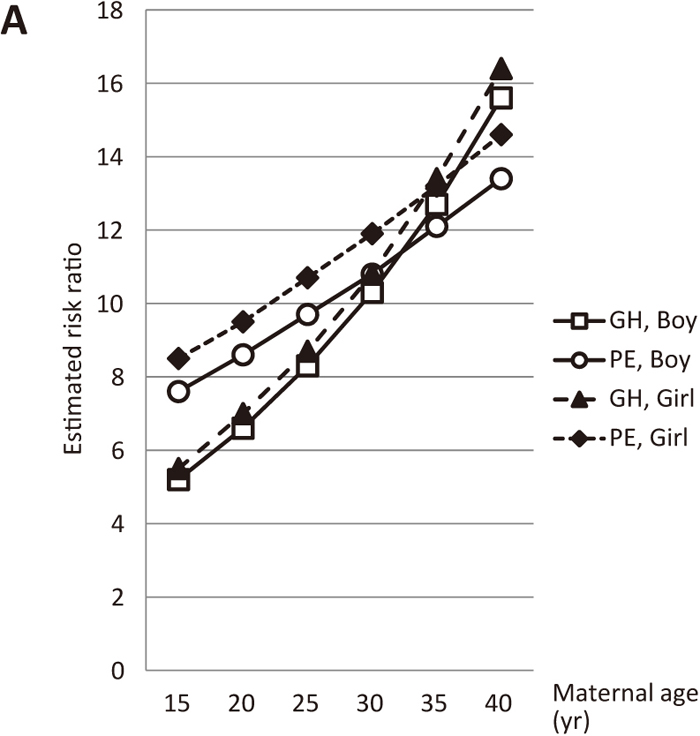
In women with pre-existing renal disease, the estimated risk ratios of GH and PE markedly increased as maternal age and/or pre-pregnancy BMI increased (Figures 6A and 6B). Moreover, in women with pre-existing hypertension, the estimated risk ratios of GH and PE increased to approximately 10 as maternal age and/or pre-pregnancy BMI increased (Figures 7A and 7B).
Nomogram for predicted risk ratios of GH and PE
Supplemental Table 1 quantifies the estimated risk ratios of GH and PE in nulliparous women with a male fetus. These risk ratios were calculated according to maternal age and pre-pregnancy BMI using the score calculation sheet. Supplemental Table 2 quantifies the estimated risk ratios of GH and PE in nulliparous women with a female fetus. Supplemental Tables 3 and 4 quantify the estimated risk ratios of GH and PE in nulliparous women with pre-existing renal disease carrying a male fetus and a female fetus, respectively.
Discussion
A good test for predicting GH or PE is of limited benefit because not all women with a high risk ratio will actually develop GH or PE, and delivery is the best treatment for these hypertensive disorders. However, the risk prediction sheet will be beneficial for informing pregnant women about their estimated risk ratios of GH and PE using only clinical information at prenatal visits. Using simple clinical information obtained by practitioners (obstetricians or midwives) from women at prenatal visits, we calculated estimated risk ratios of GH or PE that allowed us to determine whether a woman was at high risk of developing GH or PE.
We found that the estimated risk ratios of GH and PE were higher in the normotensive group with higher pre-pregnancy BMI than in those with a higher maternal age, which demonstrated a stronger impact of pre-pregnancy BMI over maternal age on the onset of GH and PE. Our results and findings by Wang24) strongly reinforce, in the normotensive group, a nationwide campaign to promote awareness of maternal pre-pregnancy BMI and maternal age as risk factors for GH and PE, and encourage mothers to maintain a standard body weight before pregnancy. We previously reported that BMI positively correlated with the proportions of granulysin-positive cytotoxic T cells and NK cells in preeclamptic patients.25) In preeclamptic patients with higher pre-pregnancy BMI, a higher proportion of granulysin-producing cytotoxic T cells in the peripheral blood contributes to stronger pro-inflammatory Th1-type immune responses.
Our results also suggest that, especially in women with complications such as pre-existing hypertension or pre-existing diabetes, the estimated risk ratios for GH and PE markedly rose when mothers were pregnant at an older age or had a high pre-pregnancy BMI. Our results also showed that it is possible for primary obstetrical practitioners and health care professionals to identify mothers at a high risk of developing GH or PE at regular prenatal visits before 20 weeks of gestation and to monitor them closely for the development of GH or PE. Staff et al.26) reported that pregnancy is a stress test for life for women, that women who fail the test are at increased risk of long-term cardiovascular complications, and that women who develop PE (and/or other manifestations of placental dysfunction) are at an increased risk of developing coronary heart disease, stroke, and cardiovascular disease. Taking these findings together, we believe our estimated risk ratios of GH and PE will aid obstetricians in identifying such high-risk mothers before 20 weeks of gestation.
A major limitation of this study is that the estimated risk ratios appeared to be very high. This could have been due to the recruitment of women from secondary and tertiary, rather than primary, obstetrical clinics throughout Japan. Hauth et al. reported that, of 4,302 healthy nulliparous women, 5% developed mild PE and 2.5% developed severe PE.27) Yoder et al. reported that PE occurred in approximately 4% of all pregnancies.28) Furthermore, Abalos et al. reported that the crude incidence of PE was 2.3%, ranging from 1.2% to 4.2% across regions.29) In the present study, we showed that the prevalence of PE in Japan was 2.5%, which is similar to these three reports. While the reason for why the prevalence of both GH and PE in our study was lower than the other studies is unclear, some possible reasons include: 1) women with mild GH and PE have not delivered in secondary or tertiary hospitals that participate in the perinatal registration project and 2) not all secondary or tertiary hospitals agreed to participate in the perinatal registration project in 2010. Women who delivered in these hospitals were not registered. Nevertheless, our estimated risk ratios of GH and PE will assist in the identification of more GH and PE “suspects” (women in a state of “pre-GH” or “pre-PE”) and alert women and physicians to the onset of GH and PE. The wider use of our estimated risk ratios at prenatal visits may also reduce the risks of developing GH and PE with lower costs for patient care and enhance quality of life. Results from this study showed that women with pre-existing diseases, such as hypertension, renal disease, and diabetes, were at higher risk of developing GH or PE. This suggests that health care professionals should remain vigilant against the onset of GH or PE in these women.
In conclusion, we herein developed a calculation sheet of estimated risk ratios of GH and PE using simple clinical variables obtained at prenatal visits. It is non-invasive, cost-effective, and easy to perform, and may be used to identify women at high risk of developing GH and PE before disease onset.
Acknowledgments
This work was supported by a Grant-in-Aid for Scientific Research (C) (24592462), a Grant-in-Aid for Scientific Research (B) (23390386), and a Grant-in-Aid H26-itaku-001 from the Ministry of Health, Labour and Welfare. We wish to thank Nobuya Unno, MD, PhD, for providing access to the Prenatal Database of the Japan Society for Obstetrics and Gynecology. We also thank Mr. Norio Sugimoto for assistance with statistical analysis.
Conflict of interest
None.
Appendices
Supplemental Tables
Supplemental Tables 1–4 show the estimated risk ratios of gestational hypertension and preeclampsia according to maternal age and pre-pregnancy body mass index in several maternal conditions.
References
- 1. Sibai B, Dekker G, Kupferminc M. Pre-eclampsia. Lancet. 2005; 365: 785–799.
- 2. Shiozaki A, Matsuda Y, Satoh S, Saito S. Comparison of risk factors for gestational hypertension and preeclampsia in Japanese singleton pregnancies. J Obstet Gynaecol Res. 2013; 39: 492–499.
- 3. Naruse K, Suzuki Y, Nakamoto O, et al. Society Statement. A brief review of the 2009 JSSHP guidelines for the care and treatment of pregnancy induced hypertension. Hypertens Res Pregnancy. 2013; 1: 5–7.
- 4. Becker R. Identification of high-risk patients for adverse pregnancy outcome based on multivariate logistic regression analysis at 20–23 gestational weeks. J Perinat Med. 2011; 39: 667–672.
- 5. Kuc S, Koster MP, Franx A, Schielen PC, Visser GH. Maternal characteristics, mean arterial pressure and serum markers in early prediction of preeclampsia. PLoS One. 2013; 8: e63546.
- 6. Anderson UD, Olsson MG, Kristensen KH, Åkerström B, Hansson SR. Review: Biochemical markers to predict preeclampsia. Placenta. 2012; 33 (suppl): S42–47.
- 7. Brunelli VB, Prefumo F. Quality of first trimester risk prediction models for pre-eclampsia: a systematic review. BJOG. 2015; 122: 904–914.
- 8. Caradeux J, Serra R, Nien JK, et al. First trimester prediction of early onset preeclampsia using demographic, clinical, and sonographic data: a cohort study. Prenat Diagn. 2013; 33: 732–736.
- 9. Simonazzi G, Vicenzi C, Rizzo MA, et al. Prospective evaluation of the risk of pre-eclampsia using logistic regression analysis. Ultrasound Obstet Gynecol. 2007; 30: 312–317.
- 10. Papageorghiou AT, Yu CK, Erasmus IE, Cuckle HS, Nicolaides KH. Assessment of risk for the development of pre-eclampsia by maternal characteristics and uterine artery Doppler. BJOG. 2005; 112: 703–709.
- 11. Oliveira N, Magder LS, Blitzer MG, Baschat AA. First-trimester prediction of pre-eclampsia: external validity of algorithms in a prospectively enrolled cohort. Ultrasound Obstet Gynecol. 2014; 44: 279–285.
- 12. Kane SC, Da Silva Costa F, Brennecke SP. New directions in the prediction of pre-eclampsia. Aust N Z J Obstet Gynaecol. 2014; 54: 101–107.
- 13. Baschat AA, Magder LS, Doyle LE, Atlas RO, Jenkins CB, Blitzer MG. Prediction of preeclampsia utilizing the first trimester screening examination. Am J Obstet Gynecol. 2014; 211: 514.e1–7.
- 14. Payne BA, Hutcheon JA, Ansermino JM, et al. A risk prediction model for the assessment and triage of women with hypertensive disorders of pregnancy in low-resourced settings: the miniPIERS (Pre-eclampsia Integrated Estimate of RiSk) multi-country prospective cohort study. PLoS Med. 2014; 11: e1001589.
- 15. Metcalfe A, Langlois S, Macfarlane J, Vallance H, Joseph KS. Prediction of obstetrical risk using maternal serum markers and clinical risk factors. Prenat Diagn. 2014; 34: 172–179.
- 16. Direkvand-Moghadam A, Khosravi A, Sayehmiri K. Predictive factors for preeclampsia in pregnant women: a Receiver Operation Character approach. Arch Med Sci. 2013; 9: 684–689.
- 17. Parra-Cordero M, Rodrigo R, Barja P, et al. Prediction of early and late pre-eclampsia from maternal characteristics, uterine artery Doppler and markers of vasculogenesis during first trimester of pregnancy. Ultrasound Obstet Gynecol. 2013; 41: 538–544.
- 18. North RA, McCowan LM, Dekker GA, et al. Clinical risk prediction for pre-eclampsia in nulliparous women: development of model in international prospective cohort. BMJ. 2011; 342: d1875.
- 19. Akolekar R, Syngelaki A, Sarquis R, Zvanca M, Nicolaides KH. Prediction of early, intermediate and late pre-eclampsia from maternal factors, biophysical and biochemical markers at 11–13 weeks. Prenat Diagn. 2011; 31: 66–74. Erratum in: Prenat Diagn. 2011; 31: 832.
- 20. Poon LC, Kametas NA, Maiz N, Akolekar R, Nicolaides KH. First-trimester prediction of hypertensive disorders in pregnancy. Hypertension. 2009; 53: 812–818.
- 21. Onwudiwe N, Yu CK, Poon LC, Spiliopoulos I, Nicolaides KH. Prediction of pre-eclampsia by a combination of maternal history, uterine artery Doppler and mean arterial pressure. Ultrasound Obstet Gynecol. 2008; 32: 877–883.
- 22. Shiozaki A, Matsuda Y, Hayashi K, Satoh S, Saito S. Comparison of risk factors for major obstetric complications between Western countries and Japan: A case-cohort study. J Obstet Gynaecol Res. 2011; 37: 1447–1454.
- 23. Watanabe K, Naruse K, Tanaka K, Metoki H, Suzuki Y. Society Statement. Outline of definition and classification of “pregnancy induced hypertension (PIH)”. Hypertens Res Pregnancy. 2013; 1: 3–4.
- 24. Wang Z, Wang P, Liu H, et al. Maternal adiposity as an independent risk factor for pre-eclampsia: a meta-analysis of prospective cohort studies. Obes Rev. 2013; 14: 508–521.
- 25. Molvarec A, Shiozaki A, Ito M, et al. Increased prevalence of peripheral blood granulysin-producing cytotoxic T lymphocytes in preeclampsia. J Reprod Immunol. 2011; 91: 56–63.
- 26. Staff AC, Dechend R, Pijnenborg R. Learning from the placenta: acute atherosis and vascular remodeling in preeclampsia-novel aspects for atherosclerosis and future cardiovascular health. Hypertension. 2010; 56: 1026–1034.
- 27. Hauth JC, Ewell MG, Levine RJ, et al. Pregnancy outcomes in healthy nulliparous who developed hypertension. Obstet Gynecol. 2000; 95: 24–28.
- 28. Yoder SR, Thornburg LL, Bisognano JD. Hypertension in pregnancy and women of childbearing age. Am J Med. 2009; 122: 890–895.
- 29. Abalos E, Cuesta C, Grosso AL, Chou D, Say L. Global and regional estimates of preeclampsia and eclampsia: a systematic review. Eur J Obstet Gynecol Reprod Biol. 2013; 170: 1–7.