Abstract
Acyl CoA: diacylglycerol acyltransferase (DGAT) 1 is an enzyme that catalyzes the re-synthesis of triglycerides (TG) from free fatty acids and diacylglycerol. JTT-553 is a DGAT1 inhibitor and exhibits its pharmacological action (inhibition of re-synthesis of TG) in the enterocytes of the small intestine leading to suppression of a postprandial elevation of plasma lipids. After repeated oral dosing JTT-553 in rats and monkeys, plasma transaminase levels were increased but there were neither changes in other hepatic function parameters nor histopathological findings suggestive of hepatotoxicity. Based on the results of exploratory studies for investigation of the mechanism of the increase in transaminase levels, plasma transaminase levels were increased after dosing JTT-553 only when animals were fed after dosing and a main factor in the diet contributing to the increase in plasma transaminase levels was lipids. After dosing JTT-553, transaminase levels were increased in the small intestine but not in the liver, indicating that the origin of transaminase increased in the plasma was not the liver but the small intestine where JTT-553 exhibits its pharmacological action. The increase in small intestinal transaminase levels was due to increased enzyme protein synthesis and was suppressed by inhibiting fatty acid-transport to the enterocytes. In conclusion, the JTT-553-related increase in plasma transaminase levels is considered not to be due to release of the enzymes from injured cells into the circulation but to be phenomena resulting from enhancement of enzyme protein synthesis in the small intestine due to the pharmacological action of JTT-553 in this organ.
INTRODUCTION
The glycerol phosphate and the monoacylglycerol pathway are two major pathways for triglyceride (TG) biosynthesis (Kennedy, 1957; Bell and Coleman, 1980; Lehner and Kuksis, 1996; Coleman and Lee, 2004). In the final reaction for both pathways, a fatty acyl-CoA and diacylglycerol molecule are covalently joined to form TG. This reaction is catalyzed by acyl CoA: diacylglycerol acyltransferase (DGAT) enzymes. The genes encoding two DGAT enzymes, DGAT1 and DGAT2, have been identified (Oelkers et al., 1998; Lardizabal et al., 2001). DGAT enzymes are expressed in numerous organs. Particularly, DGAT1 is highly expressed in the small intestine and fat tissues while DGAT2 is highly expressed in the liver and fat tissues (Unger, 2002; Cases et al., 2001). In DGAT1-transgenic mice that highly express DGAT1 specifically in fat tissues, accumulation of TG in fat tissues accompanied by marked increases in body weights are observed when the animals are fed a high-fat diet (Chen et al., 2002). Conversely, DGAT1 knockout mice show resistance to the obesogenic effects of a high fat diet (Smith et al., 2000). DGAT1 knockout mice fed a high fat diet maintain body weights comparable to mice fed a regular diet. TG levels in the liver and skeletal muscles are lower and increased energy expenditure is observed in DGAT1 knockout mice when compared with wild type mice. DGAT1 knockout mice have increased insulin and leptin sensitivity when compared with wild-type littermates. Therefore, the phenotypes for DGAT1 gene polymorphisms in humans and DGAT1 deficiencies in mice have generated considerable interest for DGAT1 inhibitors as a potential therapy for obesity.
Tomimoto et al. (2015a, 2015b), discovered a new DGAT1 inhibitor, JTT-553, [trans-5’-(4-amino-7,7-dimethyl-2-trifluoromethyl-7H-pyrimido[4,5-b][1,4]oxazin-6-yl)-2’,3’-dihydrospiro(cyclohexane-1,1-inden)-4-yl]acetic acid monobenzenesulfonate, with human DGAT1 inhibiting activity. JTT-553 suppressed postprandial fat absorption in the small intestine and fat synthesis in adipose tissues, and reduced body weights and the weight of adipose tissues in diet-induced obesity (DIO) rats through a lipid lowering action. These results indicated that JTT-553 is a potential therapeutic target agent for obesity in humans.
We conducted repeated oral dose toxicity studies in rats and monkeys for JTT-553 and saw elevation of plasma transaminase activities in both animal species. However, the change was mild and was not accompanied by any change in other hepatic function parameters or any histopathological findings suggestive of hepatotoxicity.
Blood transaminase levels (alanine aminotransferase (ALT) and aspartate aminotransferase (AST)) are well known as sensitive markers of possible tissue damage, especially liver toxicity both in clinical and non-clinical studies (Ramaiah, 2007). In the case of drug-induced liver injury (DILI), blood transaminase levels increased markedly as a consequence of the release of hepatocellular enzyme proteins from the damaged tissue into the circulation. DILI is becoming a significant public health issue because of its potential impact, not only on patients but also on the development of new drugs. DILI events are also the main cause of regulatory action pertaining to drugs, including denial of marketing approval, restrictions with respect to clinical indications and withdrawal from the marketplace (Lee, 2003; Smith and Schmid, 2006). Therefore, it is very important for the risk management of new drugs that DILI or suspected DILI is appropriately evaluated. However, it is sometimes difficult to estimate the potential risk of DILI in humans from the results of non-clinical standard toxicity studies required in the guidance as in the case of mild and transient increase in blood transaminase levels without any obvious finding indicative of DILI, including alteration of other hepatic function parameters and degenerative histopathological findings in the liver in non-clinical toxicity studies for pharmaceuticals (Balfour et al., 1990; Blane, 1987; Gould and Scott, 2005; Kodama et al., 2008).
ALT and AST are two of the key enzymes involved in the amino acid/glucose metabolism pathways and play an important role in amino acid metabolism in muscle and gluconeogenesis in the liver (DeRosa and Swick, 1975). These transaminase activities are also recognized to be altered by hormonal and nutritional modifications such as glucocorticoid-treatment, feeding on a high fat diet and dietary restriction (Ramesh and Pugalendi, 2006; Rosen et al., 1959; Hoffman et al., 1989; Katchman and Zipf, 1970; Kobayashi et al., 2010, 2011). Therefore, if a drug affects the amino acid/glucose metabolism pathway by its pharmacological actions, the transaminase activities will be altered in both the tissues and blood. In addition, the transaminase activities may be also altered if the drug affects the lipid metabolism pathway because the lipid metabolism is closely related to the amino acid/glucose metabolism. Dietary restriction causes fluctuation in lipid metabolism and increases fatty acid oxidation rates (Bruss et al., 2010). Acceleration of fatty acid oxidation is also considered to lead to an increase in the synthesis of enzymes involved in the gluconeogenesis pathway including ALT and AST (Lam et al., 2003). This is because acetyl CoA produced by fatty acid oxidation inhibits hepatic pyruvate dehydrogenase (PDH) activity and accelerates the production of oxaloacetate from pyruvate via activation of pyruvate carboxylase (PC) leading to glucose production from alanine. Kobayashi et al. previously reported that fenofibrate, which has been shown to modify a variety of aspects of lipid metabolism leading to reductions in plasma lipid levels, increased enzyme protein synthesis of transaminases in the liver and that the increase may be related to alteration in amino acid/glucose metabolism due to the alteration in TG metabolism as the pharmacological action of fenofibrate (Balfour et al., 1990; Blane, 1987; Edgar et al., 1998; Kobayashi et al., 2009).
These nutritional and pharmacological aspects of alteration of transaminase activity and the pharmacological action (lipid lowering action) of JTT-553 led us to conduct exploratory studies for the investigation of the mechanism of the elevation of plasma transaminase activities noted after treatment with JTT-553 in animals. The exploratory studies included studies to investigate relationships between the pharmacological action of JTT-553 and alteration of transaminase levels by modifying the feeding regimens, clarifying the origin of the transaminase increased in plasma and suppressing the transport of fatty acids into the enterocytes.
MATERIALS AND METHODS
Chemicals
JTT-553, [trans-5’-(4-amino-7,7-dimethyl-2-trifluoromethyl-7H-pyrimido[4,5-b][1,4]oxazin-6-yl)-2’,3’-dihydrospiro(cyclohexane-1,1-inden)-4-yl]acetic acid monobenzenesulfonate, was synthesized in the Central Pharmaceutical Research Institute, Japan Tobacco Inc. (Osaka, Japan).
Animals
Rats (F344/DuCrlCrlj rats), monkeys (cynomolgus monkeys) and dogs (beagle dogs) were used in the present studies. Rats were purchased from Charles River Japan Inc. (Kanagawa, Japan). Monkeys were purchased from Keari Co., Ltd. (Osaka, Japan). Dogs were purchased from Covance Research Products Inc. (Princeton, NJ, USA). The age of animals was 6 to 8-week-old for rats, 2 to 4-year-old for monkeys and 34-month-old for dogs at the initiation of each study. All animals were individually housed in an air-conditioned animal room with a 12-hr light-dark cycle (lighting from 7:00 a.m. to 7:00 p.m.) at a temperature of 22 to 28°C, a relative humidity of 30 to 80% and a ventilation rate of 10 to 20 times per hour. The animals were given commercial diets supplied by Oriental Yeast Co., Ltd. (Tokyo, Japan) (rats: CRF-1 (free access except for the single dose studies), monkeys: PS (100 g/day), dogs: TC-1 (250 g/day)). Tap water was freely available for drinking ad libitum. All animal experimental procedures were approved by the institutional animal care and use committee (IACUC) of the Toxicology Research Laboratories, Central Pharmaceutical Research Institute, Japan Tobacco Inc. The following studies were conducted in accordance with the Japanese Law for the Humane Treatment and Management of Animals (Law No. 105, issued in October 1, 1973).
Study design
One-month repeated oral dose toxicity studies of JTT-553
Rats and monkeys were used in these studies.
Rats
JTT-553 suspended in 0.5% methylcellulose (MC, Shin-etsu Chemical Co., Ltd., Tokyo, Japan) aqueous solution (the vehicle) was administered orally once daily in the morning to 6-week-old rats (12 or 18/sex/group) for one month (28 days for males and 29 days for females) at the dose levels of 30, 100 and 300 mg/kg. These dose levels were selected based on the results of a preliminary dose-range-finding study and the area under the plasma concentration-time curve (AUC0-24hr) value at the highest dose level (300 mg/kg) was more than 50 times higher than that at the pharmacologically effective dose, 0.3 mg/kg, based on pharmacological studies in rats. The control animals were given the vehicle (0.5% MC aqueous solution). Six males and 6 females each were added to the control and 300 mg/kg groups for a 2-week recovery study. Each animal had free access to the basal diet throughout the dosing and recovery periods.
Clinical observations and measurements of the body weights and food consumption were conducted during the dosing period. Urinalysis, hematology, clinical chemistry, necropsy, measurement of the organ weights and histopathological examinations were conducted with samples collected after overnight fasting at the end of the dosing period. Plasma ALT and AST activities were also determined at the end of the recovery period. The plasma concentrations of JTT-553 were determined on days 1 and 28 (after repeated dosing for 27 days) of the dosing period.
Monkeys
JTT-553 suspended in 0.5% MC aqueous solution (the vehicle) was administered orally once daily to 2 to 3-year-old monkeys (3/sex/group) for one month (28 days) at the dose levels of 1, 3 and 10 mg/kg. These dose levels were selected based on the results of a preliminary dose-range-finding study and the AUC0-24hr value at the highest dose level (10 mg/kg) was more than 50 times higher than that at the pharmacologically effective dose, 0.3 mg/kg, based on a pharmacological study in rats. The compound was administered in the morning after overnight fasting. Food was given at 4 hr after each dosing and the remaining food was collected in the evening. The control animals were given the vehicle (0.5% MC aqueous solution). Two males and 2 females each were added to the control and 10 mg/kg groups for the 2-week recovery study.
Before the initiation of dosing and during the dosing period, clinical observations and measurements of the body weights and food consumption were conducted. Clinical chemistry was conducted before the initiation of dosing and in weeks 1, 2 and 4 of the dosing period and in week 2 of the recovery period with samples collected in the morning after overnight fasting for each day of sampling. During the dosing period, plasma chylomicron (CM) and TG concentrations were also determined 4 hr after feeding (8 hr after dosing) on day 1 and in weeks 1 and 4 of the dosing period. Urinalysis and hematology were conducted before the initiation of dosing and at the end of the dosing period. At the end of the dosing and the recovery periods, necropsy, measurements of the organ weights and histopathological examinations were conducted with samples collected after overnight fasting. The plasma concentrations of JTT-553 were determined on days 1 and 28.
Single oral dose studies of JTT-553 for the investigation of relationships between feeding status and increases in plasma ALT levels in the JTT-553-treated animals
Monkeys
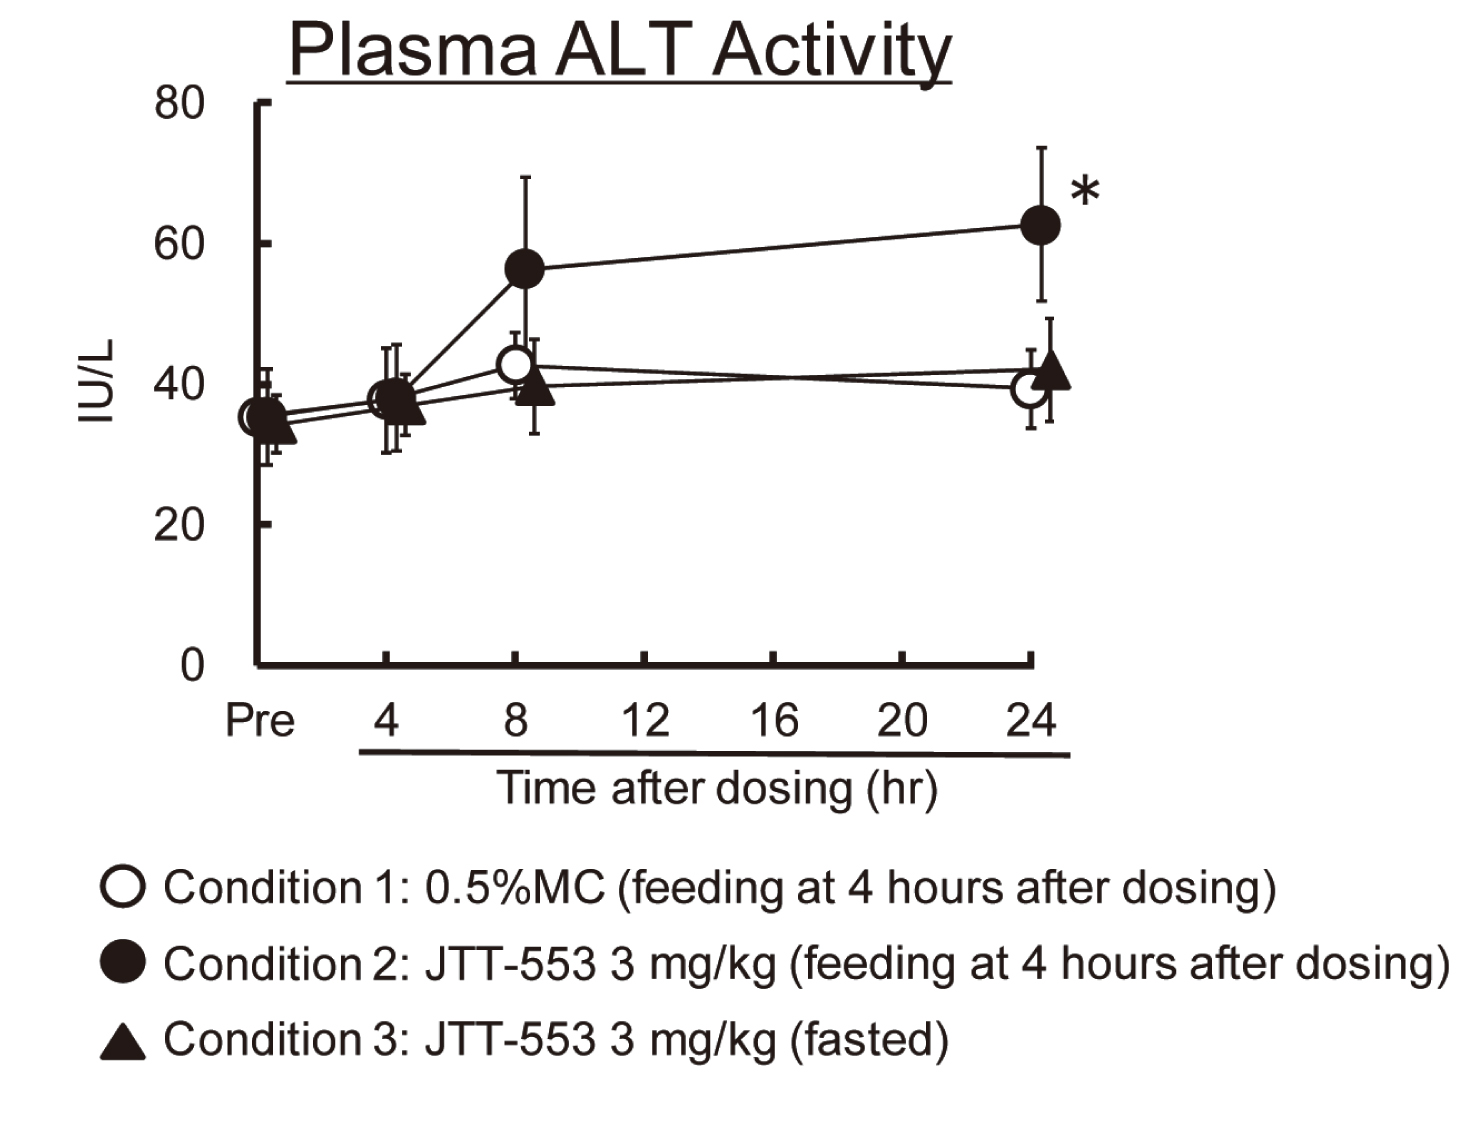
A 0.5% MC aqueous solution (the vehicle) or JTT-553 (3 mg/kg) was administered once orally to 3 to 4-year-old male monkeys (3/group) after overnight fasting at intervals of 1 week or more with three feeding regimens; food was given or not given after dosing JTT-553 (the same animals were used in the three feeding regimens as shown in Table 1). Plasma ALT activity was determined under the feeding regimens in Table 1 at several time points (before dosing, at 4 hr after dosing (immediately before re-feeding when the animals were fed after dosing), at 8 hr after dosing (4 hr after re-feeding when the animals were fed after dosing) and at 24 hr after dosing (20 hr after re-feeding when animals were fed after dosing)).
Table 1. Feeding regimens in a single oral dose study of JTT-553 for the investigation of relationships between feeding status and increases in plasma ALT levels in the JTT-553-treated monkeys.
| Condition |
Feeding Regimen |
| 1 * |
Food was given at 4 hr after dosing of 0.5% MC aqueous solution (vehicle). |
| 2 * |
Food was given at 4 hr after dosing of JTT-553 (3 mg/kg). |
| 3 |
JTT-553 (3 mg/kg) was administered and no food was given after dosing JTT-553. |
* The same feeding regimen as employed in a monkey one-month repeated oral dose toxicity study.
Rats
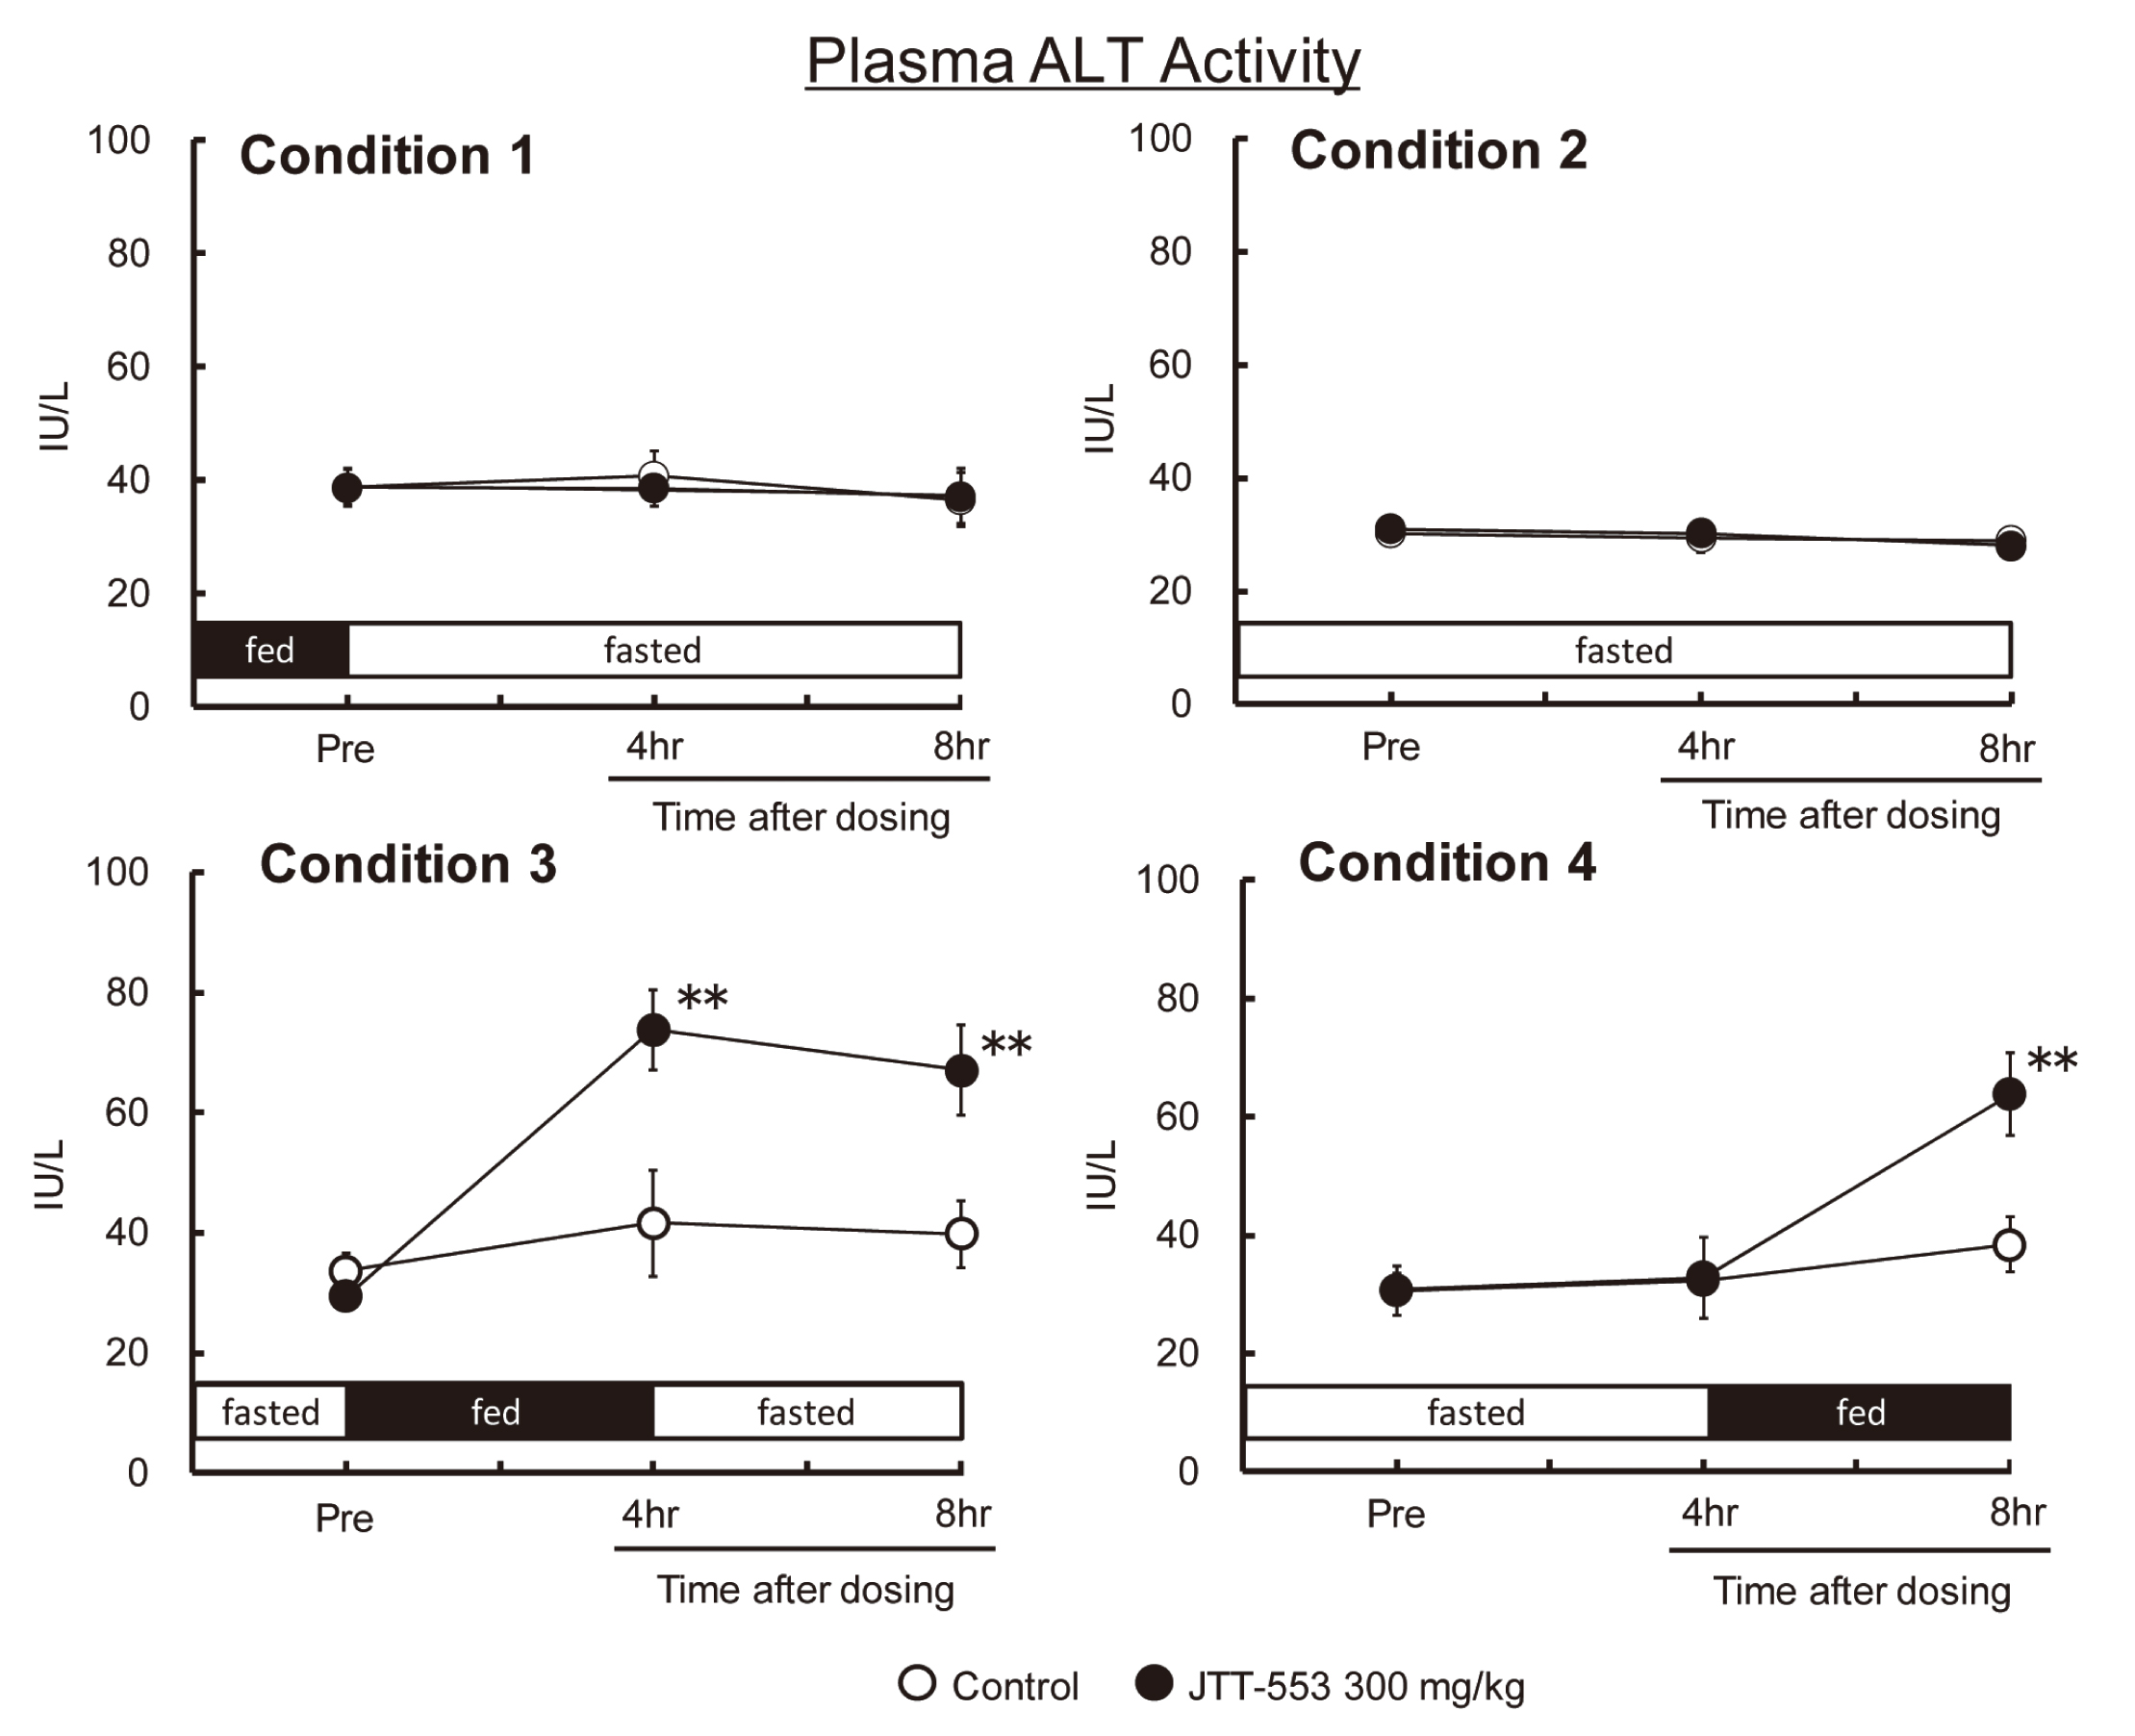
A 0.5% MC aqueous solution (the vehicle) or JTT-553 (30 mg/kg) was administered once orally to 6-week-old male rats (5/group) with four feeding regimens shown in Table 2 (food was given or not given before or after dosing JTT-553). Blood samples were collected immediately before dosing and at 4 and 8 hr after dosing the vehicle or JTT-553 with the four feeding regimens shown in Table 2.
Table 2. Feeding regimens in a single oral dose study of JTT-553 for the investigation of relationships between feeding status and increases in plasma ALT levels in the JTT-553-treated rats.
| Condition |
Feeding Regimen |
| 1 |
0.5% MC aqueous solution (vehicle) or JTT-553 was administered to animals that had been fed and then the animals were fasted after dosing. |
| 2 |
0.5% MC aqueous solution (vehicle) or JTT-553 was administered to animals after overnight fasting and then diet was not given after dosing. |
| 3 |
0.5% MC aqueous solution (vehicle) or JTT-553 was administered to animals after overnight fasting and then the animals were re-fed from immediately after dosing to 4 hr after dosing. |
| 4* |
0.5% MC aqueous solution (vehicle) or JTT-553 was administered to animals after overnight fasting and then the animals were re-fed from 4 to 8 hr after dosing. |
* The same feeding regimen as employed in a monkey one-month repeated oral dose toxicity study.
Single oral dose study of JTT-553 for investigation of the relationship between increases in plasma transaminase levels and nutrients in the diet in the JTT-553-treated rats
A 0.5% MC aqueous solution (the vehicle) or JTT-553 (30 mg/kg) was administered once orally to 8-week-old male rats (5/group) after overnight fasting. The nutrients shown in Table 3 (glucose as carbohydrate, (Wako Pure Chemical Industries, Ltd., Tokyo, Japan), corn oil as lipid, (Sigma-Aldrich Corporation, St. Louis, MO, USA) and polypeptone as protein, (Nihon Pharmaceutical Co., Ltd., Tokyo, Japan)) were administered orally to the animals as a loading dose at 4 hr after dosing the vehicle or JTT-553 and blood was collected at 8 hr after dosing the vehicle or JTT-553 (4 hr after the nutrient loading) to determine the plasma ALT and AST activities. In addition, a group of animals fed the basal diet (CRF-1) from 4 to 8 hr after dosing served as a control group. The loading volume of corn oil was equivalent to the amount of lipid that the animals in the basal diet group would consume from the basal diet. The loading volumes of the other nutrients were set at 1 g/kg, the same as that of the corn oil.
Table 3. Nutrients used in a single oral dose study of JTT-553 for the investigation of relationships between increases in plasma transaminase levels and nutrients in diet in the JTT-553-treated rats.
| Condition |
Nutrient |
| 1 |
Free access to CRF-1 (basal diet) |
| 2 |
Corn oil as lipid 1 g/kg P.O. |
| 3 |
Glucose as carbohydrate 1 g/kg P.O. |
| 4 |
Polypeptone as protein 1 g/kg P.O. |
Single dose study of JTT-553 for the investigation of the origin of plasma ALT increases in the JTT-553-treated rats
A 0.5% MC aqueous solution (the vehicle) or JTT-553 (30 mg/kg) was administered once orally to male rats (7 to 8-week-old, 15/group) after overnight fasting. Corn oil (1 g/kg) was administered as a loading dose orally to the animals at 4 hr after dosing the vehicle or JTT-553. Plasma, small intestinal (upper small intestinal mucosa) and hepatic ALT activities were determined at 0.5, 1 and 2 hr after corn oil loading.
Single oral dose study of JTT-553 in dogs
A 0.5% MC aqueous solution (the vehicle) or JTT-553 (3 mg/kg) was administered once orally to 34-month-old male dogs after overnight fasting at intervals of 1 week or more (the same animals were used in the three conditions shown in Table 4) and corn oil (50 mL/animal) or 0.5%MC aqueous solution (50 mL/animal) was administered as a loading dose at 10 min after dosing the vehicle or JTT-553. Blood was collected before dosing and at 1, 2, 4 and 6 hr after corn oil or 0.5%MC aqueous solution loading to determine the plasma AST and ALT activities.
Table 4. Conditions in a single oral dose study of JTT-553 in dogs.
| Condition |
First Treatment |
Second Treatment * |
| 1 |
JTT-553 (3 mg/kg) |
0.5% MC aqueous solution (50 mL/animal) |
| 2 |
0.5% MC aqueous solution (vehicle, 5 mL/kg) |
Corn oil (50 mL/animal) |
| 3 |
JTT-553 (3 mg/kg) |
Corn oil (50 mL/animal) |
* Ten minutes after the first treatment
Single oral dose study of JTT-553 for the investigation of the effects of protein synthesis inhibition on small intestinal ALT increases in the JTT-553-treated rats
Saline or actinomycin D (1 mg/2.5 mL/kg, Sigma-Aldrich Corporation), a nucleic acid synthesis inhibitor, was administered subcutaneously to 7-week-old male rats (30/group) after overnight fasting. A 0.5% MC aqueous solution (the vehicle) or JTT-553 (30 mg/kg) was given once orally at 1 hr after dosing actinomycin D. Four hours later, corn oil (1 g/kg) was loaded orally to the animals. In half of the animals (15/group), small intestinal (upper small intestinal mucosa) ALT activity was determined at 2 hr after corn oil loading. In the remaining animals (15/group), blood was collected at 4 hr after corn oil loading to determine plasma ALT activity. Organization of groups is shown in Table 5.
Table 5. Organizations in a single oral dose study of JTT-553 for the investigation of the effects of protein synthesis inhibition on small intestinal ALT increases in the JTT-553-treated rats.
| Condition |
First Treatment |
Second Treatment * |
Third Treatment ** |
| 1 |
Saline (2.5 mL/kg) |
0.5% MC aqueous solution (vehicle, 5 mL/kg) |
Corn oil (1 g/kg) |
| 2 |
Saline (2.5 mL/kg) |
JTT-553 (30 mg/kg) |
Corn oil (1 g/kg) |
| 3 |
Actinomycin D (1 mg/2.5 mL/kg) |
0.5% MC aqueous solution (vehicle, 5 mL/kg) |
Corn oil (1 g/kg) |
| 4 |
Actinomycin D (1 mg/2.5 mL/kg) |
JTT-553 (30 mg/kg) |
Corn oil (1 g/kg) |
* One hour after the first treatment
** Four hours after the second treatment
Single oral dose studies of JTT-553 for investigation of the relationship between absorption of lipids in the small intestine and increases in plasma transaminase levels in rats and dogs
Rats
A 0.5% MC aqueous solution (the vehicle) or JTT-553 (30 mg/kg) was administered once orally to 6-week-old male rats (5/group) after overnight fasting. A 0.5% MC aqueous solution or orlistat (30 mg/kg, a lipase inhibitor, Sigma-Aldrich Corporation) was given orally to animals at 4 hr after dosing the vehicle or JTT-553. Corn oil (1 g/kg) was loaded orally to the animals immediately after dosing orlistat. Blood was collected before and at 2 and 4 hr after corn oil loading and plasma ALT activity was determined. Plasma JTT-553 concentrations were also determined both for animals receiving JTT-553 alone and for animals receiving JTT-553 and orlistat. Organization of the groups is shown in Table 6.
Table 6. Organizations in a single oral dose study of JTT-553 for investigation of relationships between absorption of lipids in the small intestine and increases in plasma transaminase levels in rats.
| Condition |
First Treatment |
Second Treatment * |
Third Treatment ** |
| 1 |
0.5% MC aqueous solution (vehicle, 5 mL/kg) |
0.5% MC aqueous solution (vehicle, 5 mL/kg) |
Corn oil (1 g/kg) |
| 2 |
JTT-553 (30 mg/kg) |
0.5% MC aqueous solution (vehicle, 5 mL/kg) |
Corn oil (1 g/kg) |
| 3 |
0.5% MC aqueous solution (vehicle, 5 mL/kg) |
Orlistat (30 mg/kg) |
Corn oil (1 g/kg) |
| 4 |
JTT-553 (30 mg/kg) |
Orlistat (30 mg/kg) |
Corn oil (1 g/kg) |
* Four hours after the first treatment
** Immediately after the second treatment
Dogs
A 0.5% MC aqueous solution (the vehicle) or JTT-553 (3 mg/kg) was administered once orally to 34-month-old male dogs (3/group) after overnight fasting at intervals of 1 week or more (the same animals were used in the three conditions shown in Table 7) and corn oil (50 mL/animal) was loaded orally 10 min after dosing the vehicle or JTT-553. Orlistat (240 mg/animal, XENICAL 120 mg capsule, Roche Laboratories Inc., Nutley, NJ, USA) was given orally to the same dogs immediately before corn oil loading (10 min after dosing JTT-553). Blood was collected before and at 1, 2, 4 and 6 hr after corn oil loading and plasma AST activity was determined. Plasma JTT-553 concentrations were also determined both for animals receiving JTT-553 alone and for animals receiving JTT-553 and orlistat.
Table 7. Organization in a single oral dose study of JTT-553 for the investigation of relationships between absorption of lipids in the small intestine and increases in plasma transaminase levels in dogs.
| Condition |
First Treatment |
Second Treatment * |
Third Treatment ** |
| 1 |
0.5% MC aqueous solution (vehicle, 2.5 mL/kg) |
-- |
Corn oil (50 mL/head) |
| 2 |
JTT-553 (3 mg/kg) |
-- |
Corn oil (50 mL/head) |
| 3 |
JTT-553 (3 mg/kg) |
Orlistat (240 mg/head) |
Corn oil (50 mL/head) |
--: No treatment
* Ten minutes after the first treatment
** Immediately after the second treatment
Blood sampling and preparation of the plasma in the one-month repeated oral dose toxicity studies and single oral dose studies
Blood samples were collected from the abdominal aorta under isoflurane anesthesia after overnight fasting in the one-month repeated oral dose toxicity study and from the subclavian vein in single oral dose studies in rats. In monkeys, blood samples were collected from the saphenous or femoral vein without anesthesia in the one-month repeated oral dose toxicity study and in the single oral dose studies. In dogs, blood samples were collected from the forelimb vein without anesthesia in the single dose studies. Blood samples were collected into sodium heparin-treated syringes or tubes and plasma samples were obtained by centrifugation (rats: 9000 rev·min-1, 4°C, 15 min, monkeys: 1600 × g, 4°C, 10 min, dogs: 3000 rev·min-1, 4°C, 30 min). These plasma samples were stored at -80°C until use.
Urinalysis, hematology and clinical chemistry in the one-month repeated oral dose toxicity studies and measurements of transaminase activity in the single dose studies
In the one-month repeated oral dose toxicity studies in rats and monkeys, the urine samples were used for urinalysis assessment (the parameters in Table 8 were measured at 37°C). Microscopic examination of the urine sediment was also performed. The blood samples were used for hematology and clinical chemistry assessment (the parameters in Tables 9 and 10 were measured at 37°C).
Table 8. The parameters for urinalysis assessment in the one-month repeated oral dose toxicity studies in rats and monkeys.
| Parameter |
Method |
Apparatus |
| Urine volume |
Measuring cylinder |
-- |
| pH, Ketone bodies, Bilirubin, Occult blood, Urobilinogen, Protein, Glucose |
Dipstick urinalysis |
1) |
| Osmotic pressure |
Freezing point depression method |
2) |
| Sodium (Na), Potassium (K), Chloride (Cl) |
Ioncaliper, Ioncharge |
3) |
Apparatus:
1) Urinalysis Clinitek 500 using N-Multistix SG-L, Bayer Yakuhin, Ltd. (Osaka, Japan)
2) Osmostat OM-6040, ARKRAY, Inc. (Kyoto, Japan)
3) Toshiba TBA-120FR automated analyzer (Toshiba Medical Systems Corporation, Tochigi, Japan)
Table 9. The parameters for hematology assessment in the one-month repeated oral dose toxicity studies in rats and monkeys.
| Parameter |
Method |
Apparatus |
| Red blood cell count |
Dual angle laser flow-cytometric measurement |
1) |
| White blood cell count |
Dual angle laser flow-cytometric measurement |
1) |
| Hematocrit value |
Calculated from mean corpuscular volume and red blood cell count |
1) |
| Hemoglobin concentration |
Modified cyanmethemoglobin method |
1) |
| Platelet count |
Dual angle laser flow-cytometric measurement |
1) |
| Mean corpuscular volume |
Dual angle laser flow-cytometric measurement |
1) |
| Mean corpuscular hemoglobin |
Calculated from hemoglobin concentration and red blood cell count |
1) |
| Mean corpuscular hemoglobin concentration |
Calculated from hemoglobin concentration and hematocrit value |
1) |
| Reticulocyte |
Laser flow-cytometric measurement with RNA stain |
1) |
| Differential white blood cells: Neutrophils, Eosinophils, Basophils, Lymphocytes, Monocytes |
Flow-cytometric measurement with peroxidase stain and dual angle laser flow-cytometric measurement |
1) |
| Prothrombin time |
Coagulation reaction detected by scattered light detection method |
2) |
| Activated partial thromboplastin time |
Coagulation reaction detected by scattered light detection method |
2) |
Apparatus:
1) Automated hematology analyzer ADVIA 120, Bayer Yakuhin, Ltd. (Osaka, Japan)
2) Automated coagulation analyzer CA-500, Sysmex Corporation (Hyogo, Japan)
Table 10. The parameters for clinical chemistry assessment in the one-month repeated oral dose toxicity studies in rats and monkeys.
| Parameter |
Method |
Apparatus |
| Total cholesterol (T-CH) |
Cholesterol oxidase · HDAOS method |
1) |
| Triglycerides (TG) |
GPO · DAOS method |
1) |
| Phospholipid (PL) |
Choline oxidase · DAOS method |
1) |
| Alanine transaminase (ALT) |
UV method |
1) |
| Aspartate transaminase (AST) |
UV method |
1) |
| Alkaline phosphatase (ALP) |
p-Nitrophenyl phosphoric acid method |
1) |
| Lactate dehydrogenase (LDH) |
Wróblewski-LaDue method |
1) |
| Total bilirubin (T-BIL) |
Enzyme method |
1) |
| Total protein (TP) |
Biuret method |
1) |
| Albumin (ALB) |
BCG method |
1) |
| Albumin/Globulin (A/G) ratio |
Calculation by TP and ALB |
1) |
| Glucose (GLU) |
Hexokinase · G-6-PDH method |
1) |
| Urea nitrogen (UN) |
Urease · GLDH method |
1) |
| Creatinine (CRN) |
Jaffé method |
1) |
| Inorganic phosphorus (IP) |
Molybdic direct method |
1) |
| Calcium (Ca) |
OCPC method |
1) |
| Sodium (Na) |
Ion-selective electrode potentiometry |
1) |
| Potassium (K) |
Ion-selective electrode potentiometry |
1) |
| Chloride (Cl) |
Ion-selective electrode potentiometry |
1) |
| Chylomicron (CM) |
Electrophoresis and TG stain |
2) |
Apparatus:
1) Toshiba TBA-120FR automated analyzer, Toshiba Medical Systems (Tokyo, Japan) or Hitachi 7180 Clinical Analyzer, Hitachi High-Technologies Corporation (Tokyo, Japan)
2) Densitometer Helena REP/EDC, Sysmex Corporation, Helena Laboratory (Saitama, Japan)
Necropsy, organ weights and histopathology in the one-month repeated oral dose toxicity studies
In the one-month repeated oral dose studies in rats and monkeys, complete necropsy was conducted for all the animals and the following organs were weighed; the brain, pituitary, liver, kidneys, lung, heart, spleen, thymus, submandibular glands, pancreas (for only monkey), thyroid, adrenals, testes, epididymis, prostate, seminal vesicle, ovaries and uterus. These organs and the following organs were fixed in 10% neutral buffered formalin; bone, bone marrow, lymph nodes (submandibular and mesenteric), trachea, tongue, larynx, eyeball, harderian gland, optic nerves (for only monkey), lacrimal glands (for only monkey), esophagus, stomach, small and large intestine, pancreas, gall bladder (for only monkey), aorta, urinary bladder, skeletal muscle, spinal cord, sciatic nerve, parathyroid, skin, vagina and mammary gland. Specimens were prepared for histopathological examination by embedding in paraffin wax, sectioning and staining with hematoxylin and eosin (HE). The slides for all the organs were examined microscopically.
Preparation of homogenates of the liver and small intestine in the single dose studies
Samples of liver or small intestinal mucosa of approximately 1 g were collected from each animal. All the samples were immediately frozen in liquid nitrogen and stored at -80°C until analysis. The frozen samples were thawed and 0.25 mol/L sucrose aqueous solution containing 0.05 mol/L tris(hydroxymethyl)aminomethane (pH 7.6) was added to the samples at a volume of 4 ml per 1 g wet tissue weight. Assay samples for enzyme activity and protein concentration were prepared in the same manner as described in the previous report (Kobayashi et al., 2010) and kept at under -80°C until assay.
Hepatic and small intestinal enzyme activities and protein concentrations in the single dose studies
All enzyme assays were conducted at 37°C and the units were expressed as international units (IU). The ALT and AST activities and the protein concentration were determined in the same manner as described in the previous report (Kobayashi et al., 2011). Results are expressed as units of enzyme activity per gram of protein.
Measurement of plasma JTT-553 concentrations in the one-month repeated oral dose studies and the single dose studies
In the one-month repeated oral dose toxicity studies, plasma samples were collected at 0.5, 1, 2, 4, 8 and 24 hr after daily dosing on day 27 in rats and at 1, 2, 4, 8 and 24 hr after daily dosing on days 1 and 28 in monkeys. In the single dose studies, plasma samples were collected at the same time points as employed in the one-month toxicity studies. Plasma JTT-553 concentrations were measured using high-performance liquid chromatography (HPLC). The plasma extracts 50 µL were deproteinized with 110 µL of acetonitrile (Kanto Chemical Co., Inc., Tokyo, Japan) and the supernatants, 100 µL were mixed with 100 µL of 20 mmol/L ammonium formate buffer (pH3). The resulting solutions were submitted for HPLC analysis. HPLC analyses were performed using a HPLC system (Shimadzu Corporation, Kyoto, Japan) equipped with an ultraviolet absorption detector. An XTerraTM RP18 column (5 µm, 3.9ID × 150 mm, Waters Corporation, Tokyo, Japan) was used for the separation of compounds using following conditions: mobile phases: A: 20 mmol/L ammonium formate buffer (pH3), B: acetonitrile; gradient: 0.00-0.50 min, A:B 55:45; 0.50-0.51 min, A:B 55:45 to 40:60; 0.51-8.00 min, A:B 40:60 isocratic; 8.00-8.01 min, A:B 40:60 to 5:95; 8.01-13.00 min, A:B 5:95 isocratic; 13.00-13.01 min, A:B 5:95 to 55:45; 13.01-18.00 min, A:B 55:45 isocratic. A flow rate of 1.0 mL/min was used and the detection wavelength was set at 342 nm. The column was maintained at 40°C and the injection volume was 50 µL. The plasma concentrations of JTT-553 were calculated from the peak area ratios obtained from the chromatogram, using the calibration equation. The maximum plasma concentration (Cmax) and the AUC0-24hr values were obtained from the mean values of the plasma concentrations of JTT-553 for each sampling time. The AUC was calculated using the trapezoidal rule.
Statistical analysis
The mean values and standard deviations (S.D.) in each group were calculated for the clinical chemistry parameters, organ weights and hepatic and intestinal mucosal ALT activities. The average rate on the pre-dose level was calculated for the AST and ALT activities in studies with monkeys and dogs and the post-dose values were compared with the pre-dose values. Statistical analyses were performed using Student’s t-test or a Dunnett test in SAS software (SAS Institute Japan, Tokyo, Japan). The levels of significance were set at 5% and 1% (two-tailed or one-tailed).
RESULTS
One-month repeated oral dose toxicity study of JTT-553 in rats
A summary of the results is shown in Table 11. The systemic exposure (Cmax and AUC0-24hr) to JTT-553, which was determined on days 1 and 27, increased dose-dependently in both sexes up to the highest dose level of 300 mg/kg/day. The AUC0-24hr values on day 27 ranged between 82 and 860 µg·hr/mL at the dose levels employed in this study. No deaths were observed in any treated group. There were no treatment-related findings in the clinical observations at any dose level. There were no treatment-related changes in body weights or food consumption at any dose level. Plasma TG, T-CH and PL levels were decreased by 28 to 30%, 12% and 9 to 10%, respectively, when compared with control group in males at 100 mg/kg and above (p < 0.01). In females, these plasma lipid parameters were not decreased or rather slightly increased at 100 mg/kg and above. Plasma ALT levels were increased in males at 100 mg/kg and above (p < 0.01). The increase in ALT levels was slight (increase by approximately 15 to 17% when compared with the control group) and were not dose-dependent in the magnitude (Fig. 1). These changes disappeared by the withdrawal of dosing (data not shown). There were no changes in other hepatic function parameters (AST, ALP, LDH or T-BIL). Liver weights were slightly increased in females at 300 mg/kg (p < 0.01). There were no changes in urinalysis, hematology or macroscopic examination at any dose level. There were no treatment-related histopathological findings in any organ including the liver at any dose level.
Table 11. One-month oral dose toxicity study of JTT-553 in rats.
| Dose Levels (mg/kg/day) |
Findings (Male / Female) |
| 0 |
30 |
100 |
300 |
| Pharmacokinetic parameter |
|
|
|
|
|
Cmax (µg/mL) |
Day 1 |
NE |
/ |
NE |
25 |
/ |
32 |
81 |
/ |
85 |
114 |
/ |
128 |
| Day 27 |
NE |
/ |
NE |
34 |
/ |
24 |
66 |
/ |
82 |
94 |
/ |
123 |
| AUC0-24hr (µg·hr/mL) |
Day 1 |
NE |
/ |
NE |
84 |
/ |
148 |
226 |
/ |
335 |
498 |
/ |
740 |
| Day 27 |
NE |
/ |
NE |
82 |
/ |
144 |
221 |
/ |
395 |
448 |
/ |
860 |
| Clinical Sign |
-- |
-- |
-- |
-- |
| Body Weights |
-- |
-- |
-- |
-- |
| Food Consumption |
-- |
-- |
-- |
-- |
| Urinalysis |
-- |
-- |
-- |
-- |
| Hematology |
-- |
-- |
-- |
-- |
| Clinical Chemistry |
|
|
|
|
|
Lipid parameters |
|
|
|
|
|
TG (mg/dL) |
86.8 |
/ |
23.3 |
72.9 |
/ |
23.5 |
62.4** |
/ |
24.0 |
60.4** |
/ |
23.8 |
|
T-CH (mg/dL) |
57.7 |
/ |
64.2 |
56.3 |
/ |
68.9 |
51.0** |
/ |
71.0** |
50.6** |
/ |
72.5** |
|
PL (mg/dL) |
108.3 |
/ |
106.0 |
103.3 |
/ |
112.1 |
97.7** |
/ |
114.0* |
98.1** |
/ |
119.8** |
|
Liver functional parameters |
|
|
ALT (U/L) |
32.0 |
/ |
26.8 |
34.8 |
/ |
28.9 |
37.4** |
/ |
28.5 |
36.7** |
/ |
28.3 |
|
AST (U/L) |
63.5 |
/ |
60.0 |
64.8 |
/ |
59.2 |
66.2 |
/ |
59.3 |
63.2 |
/ |
59.9 |
|
ALP (U/L) |
584.1 |
/ |
390.3 |
584.8 |
/ |
397.3 |
576.7 |
/ |
409.5 |
574.7 |
/ |
422.8 |
|
LDH (U/L) |
53.7 |
/ |
54.3 |
55.8 |
/ |
50.7 |
55.3 |
/ |
57.2 |
54.2 |
/ |
59.9 |
|
T-BIL (mg/dL) |
0.029 |
/ |
0.033 |
0.030 |
/ |
0.033 |
0.031 |
/ |
0.039 |
0.030 |
/ |
0.040* |
| Macroscopic Findings |
-- |
-- |
-- |
-- |
| Organ Weights |
|
|
Liver |
(g) |
5.676 |
/ |
3.599 |
5.896 |
/ |
3.663 |
5.785 |
/ |
3.738 |
6.102 |
/ |
3.890** |
|
|
(g/100g BW) |
2.892 |
/ |
2.806 |
2.895 |
/ |
2.812 |
2.930 |
/ |
2.824 |
3.003 |
/ |
2.947** |
| Microscopic Findings |
-- |
-- |
-- |
-- |
Abbreviation: NE; not examined, --; no findings, Cmax; maximum plasma concentration, AUC; area under the plasma concentration-time curve, AST; aspartate aminotransferase, ALT; alanine aminotransferase, ALP; alkaline phosphatase, LDH; lactate dehydrogenase, T-BIL; total bilirubin, TG; triglycerides, T-CH; total cholesterol, PL; Phospholipid, FBW; final body weights.
Clinical observations and measurements of the body weights and food consumption were conducted during the dosing period. All the other parameters were measured for each rat (n = 12 or 18/group/sex) after repeated oral dosing of JTT-553 for 27 to 29 days. Data are shown as means. * p < 0.05, ** p < 0.01: significantly different between the control group and JTT-553-treated groups (Dunnett test).

The summary of the results is shown in Tables 12 and 13. Systemic exposure to JTT-553 (Cmax and AUC0-24hr), which was determined on days 1 and 28, increased dose-dependently in both sexes up to the highest dose level, 10 mg/kg. The AUC0-24hr values on day 28 ranged between 30 and 452 µg·hr/mL at the dose levels employed in this study. No deaths were observed in any treated group. Diarrhea was observed in the females at all dose levels and in males at 3 mg/kg and above. There were no treatment-related changes in body weights or food consumption at any dose level. In the analysis of the lipoprotein fractions, conducted at 4 hr after the resumption of feeding (8 hr after daily dosing) on day 1 and in weeks 1 and 4 postprandial increases in serum CM and TG levels were suppressed in both sexes at all dose levels except for CM levels in female on day 1 at 1 mg/kg (Table 13) (p < 0.05 or 0.01). Decreases in plasma T-CH and PL levels were also observed in both sexes at all dose levels in weeks 1, 2 and 4 except for T-CH levels in male in week 4 at 3 mg/kg (p < 0.05 or 0.01). Postprandial serum CM and TG levels decreased by 52 to 92% and 36 to 76%, respectively, and plasma T-CH and PL levels decreased by 1 to 29% and 11 to 50%, respectively, when compared with the values of the control group or the pre-dosing values without apparent dose-dependency in the magnitude.
Table 12. One-month oral dose toxicity study of JTT-553 in monkeys (except for clinical chemistry).
| Dose Levels (mg/kg/day) |
Findings (Male / Female) |
| 0 |
1 |
3 |
10 |
| Pharmacokinetic parameter |
|
|
|
|
|
Cmax
(µg/mL) |
Day 1 |
NE |
/ |
NE |
1 |
/ |
1 |
5 |
/ |
4 |
19 |
/ |
13 |
| Day 28 |
NE |
/ |
NE |
2 |
/ |
2 |
7 |
/ |
9 |
29 |
/ |
17 |
AUC0-24hr
(µg·hr/mL) |
Day 1 |
NE |
/ |
NE |
18 |
/ |
9 |
54 |
/ |
59 |
239 |
/ |
174 |
| Day 28 |
NE |
/ |
NE |
33 |
/ |
30 |
110 |
/ |
135 |
452 |
/ |
276 |
| Clinical Sign |
-- |
-- |
/ |
Diarrhea |
Diarrhea |
/ |
Diarrhea |
Diarrhea |
/ |
Diarrhea |
| Body Weights |
-- |
-- |
-- |
-- |
| Food Consumption |
-- |
-- |
-- |
-- |
| Urinalysis |
-- |
-- |
-- |
-- |
| Hematology |
-- |
-- |
-- |
-- |
| Macroscopic Findings |
-- |
-- |
-- |
-- |
| Organ Weights |
-- |
-- |
-- |
-- |
| Microscopic Findings |
-- |
Jejunum: Lipid-like vacuoles in epithelial cells and lamina propria of villi |
Abbreviation: NE; not examined, --; no findings, Cmax; maximum plasma concentration, AUC; area under the plasma concentration-time curve.
Clinical observations and measurements of the body weights and food consumption were conducted during the dosing period. All the other parameters were measured for each monkey (n=3 or 5/group/sex. “Pre” indicates the pre-dosing period. Data are shown as means. * p < 0.05, ** p < 0.01: significantly different between the control group and the JTT-553-treated groups (Dunnett test).
Table 13. One-month oral dose toxicity study of JTT-553 in monkeys (clinical chemistry).
| Dose Levels (mg/kg/day) |
Mean Values (Male / Female) |
| 0 |
1 |
3 |
10 |
| Clinical Chemistry (after feeding) |
|
Lipid parameters |
|
|
CM (mg/dL) |
Pre |
5.1 |
/ |
9.4 |
7.0 |
/ |
20.6 |
8.6 |
/ |
6.9 |
7.0 |
/ |
10.5 |
|
|
Day 1 |
9.8 |
/ |
9.4 |
4.7 |
/ |
13.0 |
2.6 |
/ |
2.7 |
2.2* |
/ |
1.3* |
|
|
Week 1 |
7.4 |
/ |
6.4 |
0.6** |
/ |
1.3 |
1.2* |
/ |
1.3 |
2.2* |
/ |
1.7 |
|
|
Week 4 |
10.5 |
/ |
10.8 |
1.8 |
/ |
2.8 |
4.0 |
/ |
1.7 |
2.6 |
/ |
4.0 |
|
|
TG (mg/dL) |
Pre |
41 |
/ |
52 |
30 |
/ |
68 |
32 |
/ |
60 |
42 |
/ |
56 |
|
|
Day 1 |
48 |
/ |
49 |
17** |
/ |
17 |
24* |
/ |
20 |
30 |
/ |
23 |
|
|
Week 1 |
62 |
/ |
47 |
15* |
/ |
17 |
25 |
/ |
21 |
28* |
/ |
30 |
|
|
Week 4 |
59 |
/ |
70 |
21** |
/ |
33 |
37 |
/ |
25 |
37* |
/ |
44 |
| Clinical Chemistry (in the fasting condition) |
|
Lipid parameters |
|
|
TG (mg/dL) |
Pre |
60 |
/ |
41 |
43 |
/ |
27 |
54 |
/ |
72 |
55 |
/ |
44 |
|
|
Week 1 |
33 |
/ |
50 |
16** |
/ |
19 |
28 |
/ |
24 |
34 |
/ |
34 |
|
|
Week 2 |
22 |
/ |
32 |
18 |
/ |
32 |
44 |
/ |
47 |
41* |
/ |
38 |
|
|
Week 4 |
27 |
/ |
16 |
28 |
/ |
35 |
54 |
/ |
57 |
51 |
/ |
42 |
|
|
R-Week 2 |
37 |
/ |
48 |
NE |
/ |
NE |
NE |
/ |
NE |
34 |
/ |
17 |
|
|
T-CH (mg/dL) |
Pre |
119 |
/ |
134 |
115 |
/ |
114 |
138 |
/ |
125 |
123 |
/ |
129 |
|
|
Week 1 |
120 |
/ |
130 |
105 |
/ |
106 |
119 |
/ |
103 |
102 |
/ |
108 |
|
|
Week 2 |
126 |
/ |
134 |
104** |
/ |
97* |
122 |
/ |
98* |
106 |
/ |
109 |
|
|
Week 4 |
122 |
/ |
134 |
97* |
/ |
96 |
124 |
/ |
101* |
105 |
/ |
95* |
|
|
R-Week 2 |
131 |
/ |
157 |
NE |
/ |
NE |
NE |
/ |
NE |
99 |
/ |
110 |
|
|
PL (mg/dL) |
Pre |
208 |
/ |
229 |
182 |
/ |
183 |
191 |
/ |
241 |
193 |
/ |
203 |
|
|
Week 1 |
190 |
/ |
200 |
135** |
/ |
143** |
145* |
/ |
148** |
147* |
/ |
148** |
|
|
Week 2 |
177 |
/ |
196 |
130** |
/ |
148** |
156* |
/ |
158** |
158 |
/ |
158** |
|
|
Week 4 |
191 |
/ |
189 |
139* |
/ |
150* |
166 |
/ |
179 |
166 |
/ |
151* |
|
|
R-Week 2 |
186 |
/ |
226 |
NE |
/ |
NE |
NE |
/ |
NE |
145 |
/ |
166 |
|
Liver functional parameters |
|
|
ALT (U/L) |
Pre |
41 |
/ |
53 |
49 |
/ |
40 |
45 |
/ |
43 |
28 |
/ |
42 |
|
|
Week 1 |
51 |
/ |
40 |
101** |
/ |
97 |
85* |
/ |
99 |
85** |
/ |
97* |
|
|
Week 2 |
55 |
/ |
38 |
106** |
/ |
117 |
106** |
/ |
102 |
84** |
/ |
109* |
|
|
Week 4 |
41 |
/ |
41 |
109** |
/ |
113 |
103** |
/ |
87 |
81** |
/ |
111 |
|
|
R-Week 2 |
36 |
/ |
41 |
NE |
/ |
NE |
NE |
/ |
NE |
59 |
/ |
75 |
|
|
AST (U/L) |
Pre |
40 |
/ |
44 |
44 |
/ |
37 |
43 |
/ |
47 |
26 |
/ |
37 |
|
|
Week 1 |
31 |
/ |
29 |
52 |
/ |
42 |
41 |
/ |
44 |
34 |
/ |
36 |
|
|
Week 2 |
35 |
/ |
27 |
51 |
/ |
44 |
49 |
/ |
43 |
37 |
/ |
39 |
|
|
Week 4 |
36 |
/ |
31 |
56 |
/ |
44 |
65 |
/ |
40 |
40 |
/ |
43 |
|
|
R-Week 2 |
32 |
/ |
23 |
NE |
/ |
NE |
NE |
/ |
NE |
26 |
/ |
25 |
|
|
ALP (U/L) |
Pre |
1696 |
/ |
1563 |
1421 |
/ |
1346 |
1784 |
/ |
1133 |
1536 |
/ |
1634 |
|
|
Week 1 |
1678 |
/ |
1664 |
1376 |
/ |
1335 |
1764 |
/ |
997 |
1362 |
/ |
1399 |
|
|
Week 2 |
1577 |
/ |
1740 |
1406 |
/ |
1331 |
1560 |
/ |
994 |
1241 |
/ |
1373 |
|
|
Week 4 |
1562 |
/ |
1618 |
1197 |
/ |
1045 |
1407 |
/ |
924 |
1207 |
/ |
1186 |
|
|
R-Week 2 |
1485 |
/ |
1178 |
NE |
/ |
NE |
NE |
/ |
NE |
1342 |
/ |
1469 |
|
|
LDH (U/L) |
Pre |
306 |
/ |
375 |
302 |
/ |
403 |
283 |
/ |
504 |
267 |
/ |
362 |
|
|
Week 1 |
287 |
/ |
307 |
356 |
/ |
324 |
306 |
/ |
350 |
298 |
/ |
300 |
|
|
Week 2 |
335 |
/ |
289 |
375 |
/ |
302 |
309 |
/ |
369 |
287 |
/ |
310 |
|
|
Week 4 |
310 |
/ |
328 |
329 |
/ |
312 |
427 |
/ |
348 |
285 |
/ |
347 |
|
|
R-Week 2 |
288 |
/ |
241 |
NE |
/ |
NE |
NE |
/ |
NE |
221 |
/ |
236 |
|
|
T-BIL (mg/dL) |
Pre |
0.10 |
/ |
0.09 |
0.10 |
/ |
0.13 |
0.08 |
/ |
0.10 |
0.09 |
/ |
0.10 |
|
|
Week 1 |
0.10 |
/ |
0.08 |
0.21** |
/ |
0.13 |
0.10 |
/ |
0.20 |
0.12 |
/ |
0.11 |
|
|
Week 2 |
0.12 |
/ |
0.08 |
0.13 |
/ |
0.07 |
0.09 |
/ |
0.09 |
0.13 |
/ |
0.08 |
|
|
Week 4 |
0.09 |
/ |
0.08 |
0.09 |
/ |
0.06 |
0.06 |
/ |
0.07 |
0.08 |
/ |
0.06 |
|
|
R-Week 2 |
0.11 |
/ |
0.07 |
NE |
/ |
NE |
NE |
/ |
NE |
0.05 |
/ |
0.06 |
Abbreviation: NE; not examined, AST; aspartate aminotransferase, ALT; alanine aminotransferase, ALP; alkaline phosphatase, T-BIL; total bilirubin, T-CH; total cholesterol, TG; triglycerides, PL; phospholipid, CM; chylomicron.
Clinical observations and measurements of the body weights and food consumption were conducted during the dosing period. All the other parameters were measured for each monkey (n = 3 or 5/group/sex. “Pre” indicates the pre-dosing period. “R-week 2” shows the results of the recovery period (n = 2/group/sex, the statistical analysis was not done). Data are shown as means. * p < 0.05, ** p < 0.01: significantly different between the control group and the JTT-553-treated groups (Dunnett test).
Plasma ALT and AST levels increased in both sexes at all dose levels (p < 0.05 or 0.01) (Fig. 2). The increases in plasma ALT and AST levels were slight (two to four times higher than the pre-dosing values for ALT and 1.5 to two times higher than the pre-dosing values for AST) without apparent dose-dependency in the magnitude. The magnitude of the increases in plasma ALT and AST levels in weeks 1, 2 and 4 of the dosing period were comparable and were not enhanced with the prolongation of the dosing period. There were neither changes in the other hepatic function parameters (ALP, LDH or T-BIL) nor histopathological findings in the liver. In the histopathological examinations, an increase in lipid droplets was observed in the epithelial cells and lamina propria of the small intestinal mucosa (jejunum) at all dose levels. There were no changes in urinalysis, hematology, organ weights or macroscopic examinations at any dose level. There were no treatment-related histopathological findings in any organ other than the small intestine at any dose level.

All the findings observed during or at the end of the dosing period disappeared or tended to disappear by the withdrawal of the dosing and were therefore considered to be reversible (Tables 12 and 13 and Fig. 2).
Relationship between increases in plasma ALT levels and feeding status in the JTT-553-treated animals
In monkeys, there were no differences in systemic exposure to JTT-553 between the different feeding regimens (data not shown). With re-feeding after dosing JTT-553, plasma ALT levels increased twice the pre-dosing values at 4 and 20 hr after re-feeding (8 and 24 hr after dosing JTT-553, respectively) (Fig. 3, condition 2: the same feeding regimen as employed in the monkey one-month repeated oral dose toxicity study). On the other hand, after dosing JTT-553 with no feeding after dosing, plasma ALT levels did not change at any sampling time (Fig. 3, condition 3). Based on these results, a marked increase in plasma ALT levels was observed even after a single dose of JTT-553 with the same feeding regimen as employed in the one-month repeated dose toxicity study in monkeys. Furthermore, plasma ALT levels did not increase without re-feeding after dosing JTT-553.
In rats, there were no differences in systemic exposure to JTT-553 between different feeding regimens (data not shown). Plasma ALT levels did not change in the animals that continued to be fasted after dosing JTT-553 regardless of the feeding status (feeding or fasting) before dosing JTT-553 (Fig. 4, condition 1 and 2). On the other hand, plasma ALT levels increased (approximately 2 times that in the control group) 4 hr after the initiation feeding in the animals that received JTT-553 after overnight fasting and were re-fed after dosing JTT-553 (p < 0.01) (Fig. 4, condition 3 and 4). Based on these results, a marked increase in plasma ALT levels was observed in rats that received JTT-553 with a feeding status similar to that employed in the one-month repeated-dose toxicity study in monkeys. Furthermore, plasma ALT levels did not increase without re-feeding after dosing JTT-553 as well as in monkeys.
There were no differences in systemic exposure to JTT-553 between groups given different nutrients (data not shown). Plasma ALT levels increased in the JTT-553-treated animals after corn oil loading (p < 0.01) or fed the basal diet (p < 0.01) and the increase was more prominent in the corn oil-loaded group (approximately 4 times higher than the matched control group) than in the basal diet group (approximately 1.5 times higher than the matched control group) (Fig. 5A). On the other hand, plasma ALT levels were not changed in the JTT-553-treated rats after loading glucose or polypeptone (Fig. 5A). Plasma AST levels increased marginally (1.3 times higher than the matched control group) after dosing JTT-553 only in the corn oil-loaded group (p < 0.01) (Fig. 5B).
The origin of plasma ALT increased after treatment with JTT-553 in rats
In the animals treated with JTT-553, plasma ALT levels did not change at 0.5 hr after corn oil loading (Fig. 6A). The plasma ALT levels slightly increased (by 30% when compared with the matched control group) at 1 hr after corn oil loading (p < 0.01) and were two times higher than that in the matched control group at 2 hr after corn oil loading (p < 0.01) in the JTT-553-treated rats (Fig. 6A). Small intestinal ALT levels were higher at 0.5, 1 and 2 hr after corn oil loading (increased by 3 to 6% when compared with the matched control group) in the JTT-553-treated rats when compared with the matched control animals (p < 0.05) (Fig. 6B). There were no differences in the magnitude of the increases in small intestinal ALT levels between each sampling point. There were no differences in hepatic ALT levels at any sampling points between the JTT-553-treated animals and control animals (Fig. 6C). From these results, an increase in ALT levels in the tissues was noted immediately after corn oil loading in the small intestine but not in the liver in the JTT-553-treated rats and the increase in the small intestinal ALT preceded an increase in plasma ALT levels.

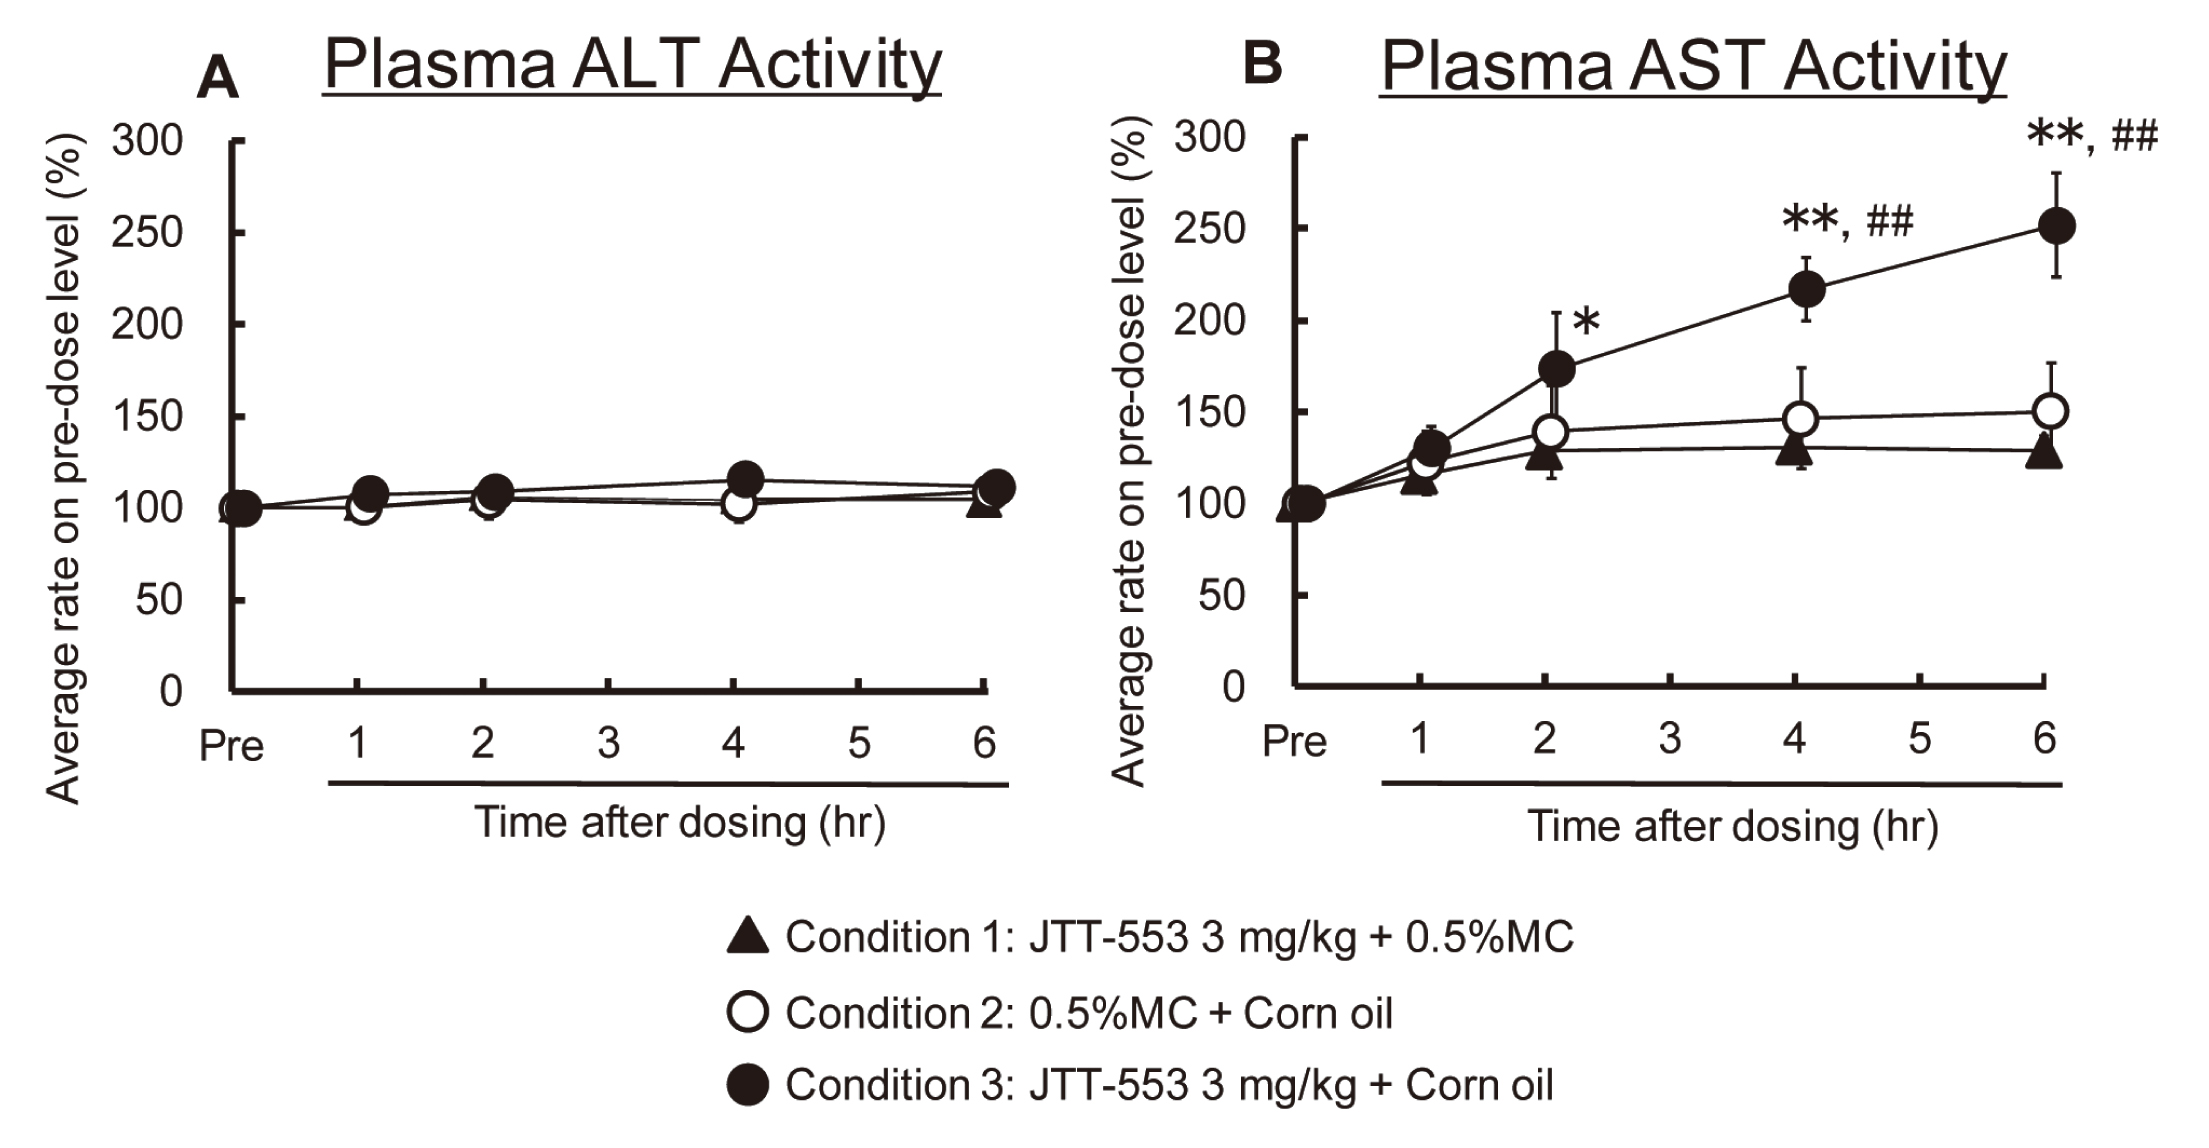
Plasma ALT levels were not increased at any sampling point after corn oil loading or 0.5% MC aqueous solution loading in the JTT-553-treated dogs (Fig. 7A). Plasma AST levels began to increase from 2 hr after corn oil loading and increased to 2.5 times the pre-dosing values at 6 hr after corn oil loading in the JTT-553-treated dogs (Fig. 7B). There were no changes in plasma AST levels at any sampling point after 0.5% MC loading in the JTT-553-treated dogs (Fig. 7B). From these results, only plasma AST levels were increased after dosing JTT-553 with corn oil loading in dogs.
Effects of protein synthesis inhibition on small intestinal and plasma ALT increased after treatment with JTT-553 in rats
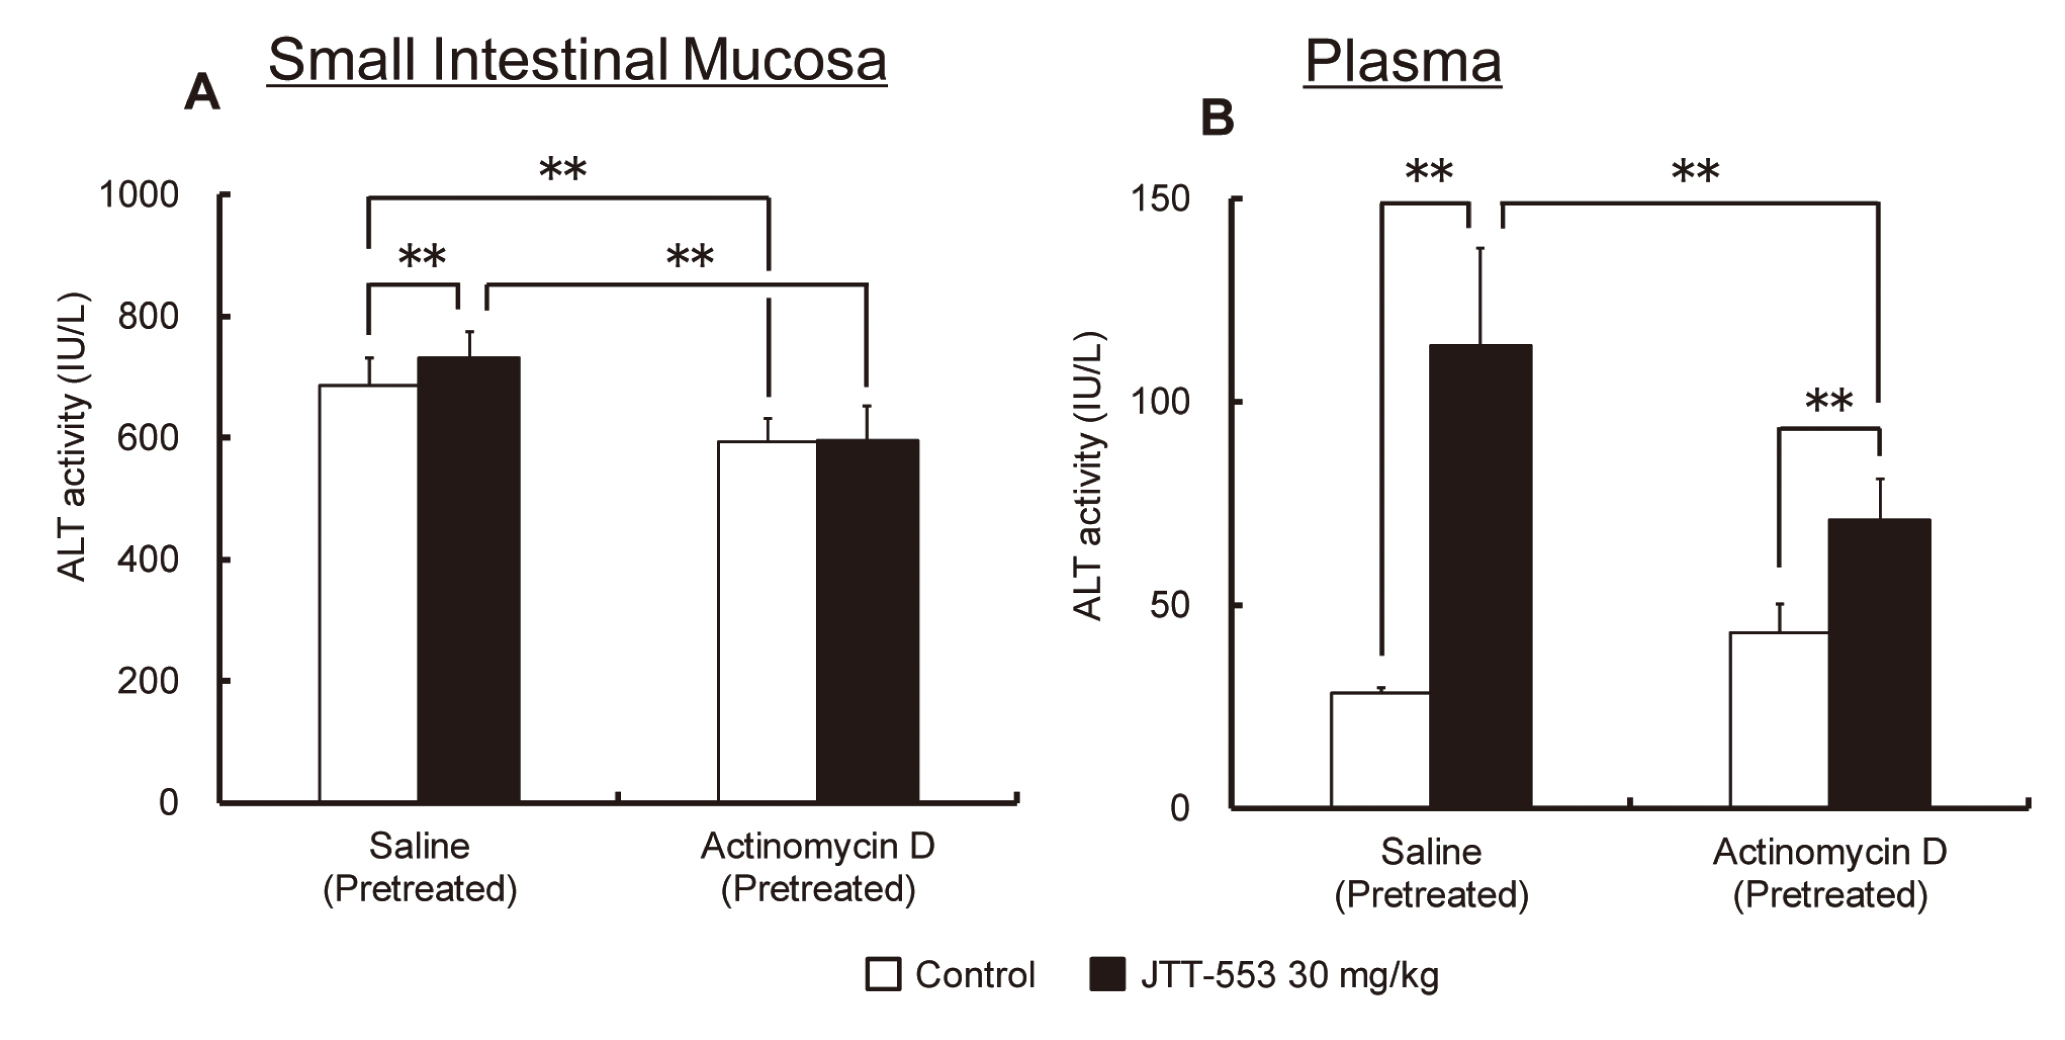
Small intestinal ALT levels increased at 2 hr after corn oil loading in the JTT-553-treated group pretreated with saline (p < 0.01) (Fig. 8A). On the other hand, an increase in small intestinal ALT levels after corn oil loading was not observed in the actinomycin D-pretreated groups (Fig. 8A). Plasma ALT levels were increased to 4 times higher than the matched control group at 4 hr after corn oil loading in the JTT-553-treated group pretreated with saline (p < 0.01) (Fig. 8B). On the other hand, in the actinomycin D-pretreated group, the increase in plasma ALT levels after corn oil loading was less prominent (approximately 1.5 times higher than the matched control group) when compared with those in the saline-pretreated groups (Fig. 8B).
Relationship between absorption of lipids in the small intestine and increases in plasma transaminase levels
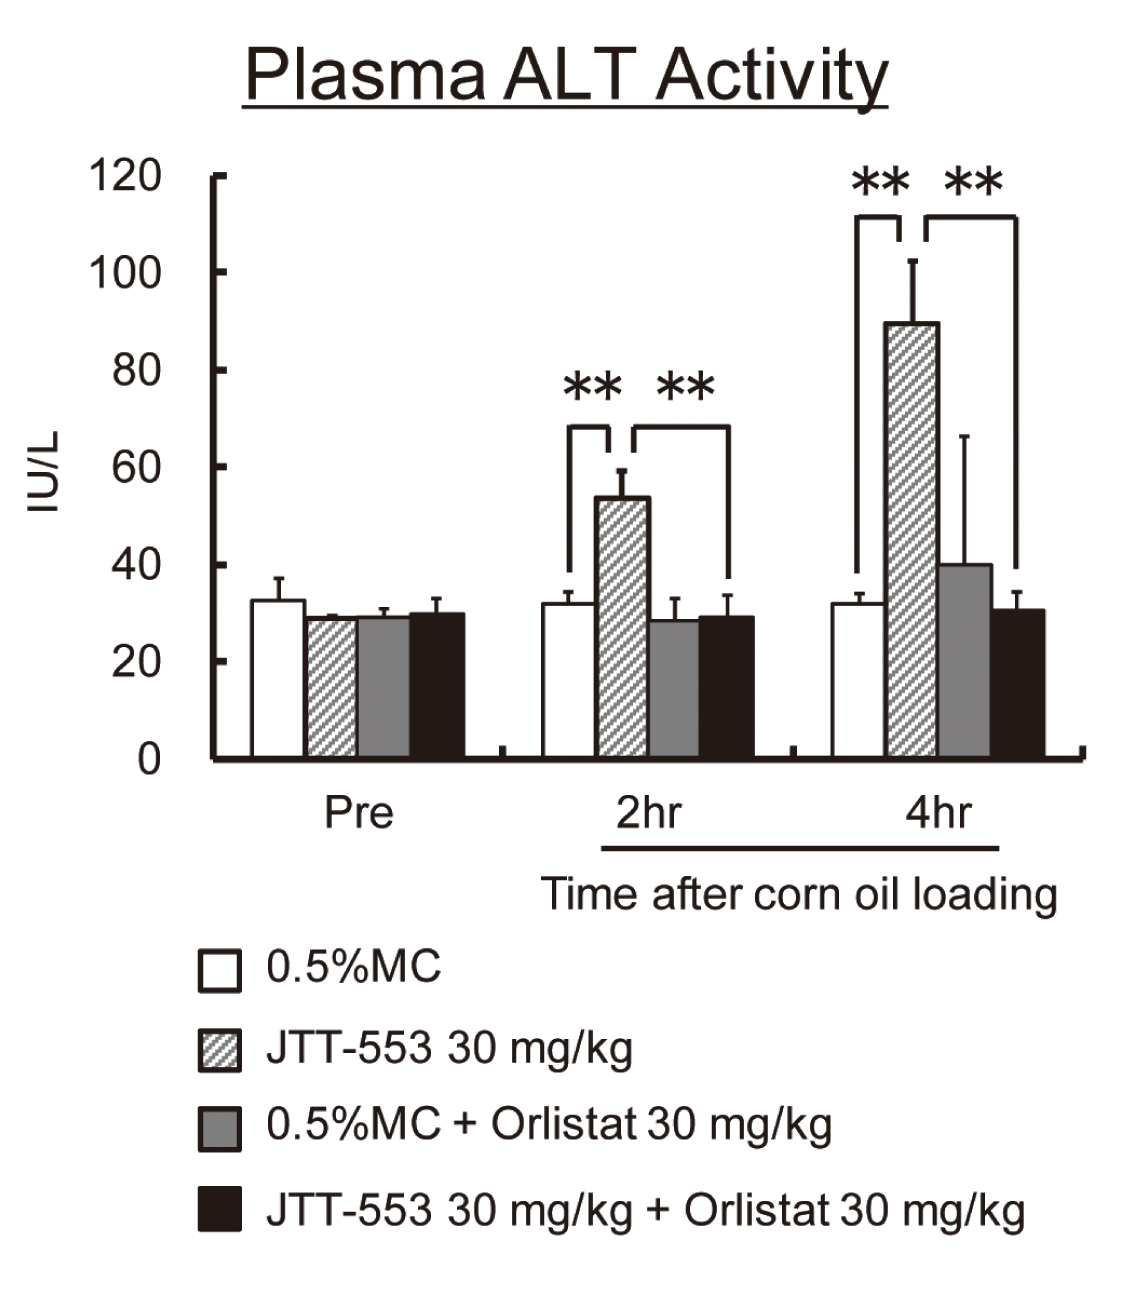
In rats, there were no differences in systemic exposure to JTT-553 regardless of treatment or non-treatment with orlistat (data not shown). Plasma ALT levels increased markedly at 2 and 4 hr after corn oil loading in the animals treated with JTT-553 alone (p < 0.01) (Fig. 9). On the other hand, there were no increases in plasma ALT levels after corn oil loading with co-administration of JTT-553 and orlistat (Fig. 9).
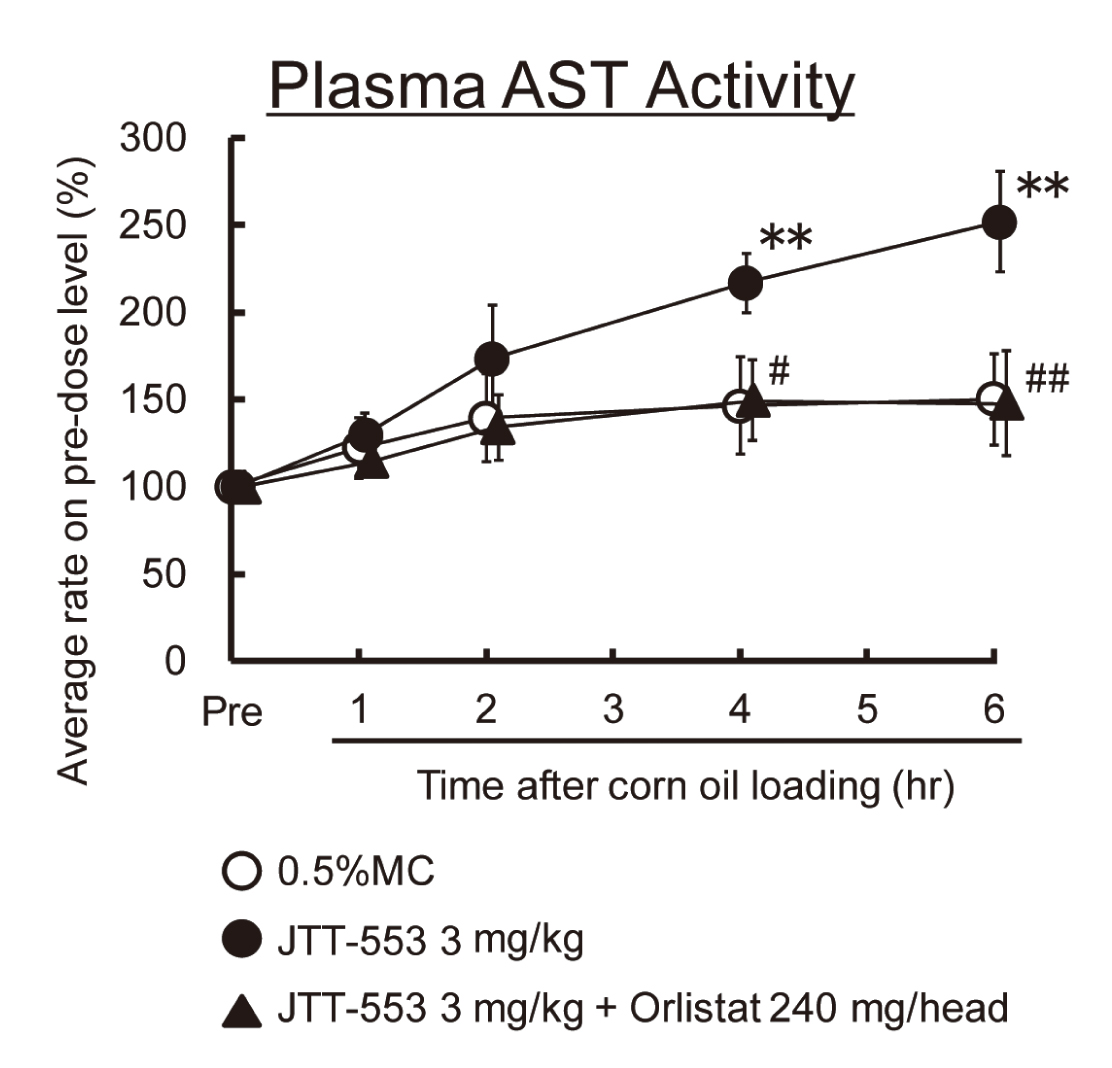
In dogs, systemic exposure to JTT-553 was higher in co-administration of JTT-553 and orlistat than in administration of JTT-553 alone (data not shown). Plasma AST levels increased markedly from 4 hr after corn oil loading when the animals were dosed JTT-553 alone (Fig. 10). On the other hand, there were no increases in plasma AST levels after corn oil loading with co-administration of JTT-553 and orlistat (Fig. 10).
From these results, plasma transaminase levels after corn oil loading in the JTT-553-treated animals were suppressed by co-treatment with orlistat.
DISCUSSION
One-month repeated dose toxicity studies were conducted for JTT-553, a DGAT1 inhibitor, using rats and monkeys with dose levels of 30, 100 and 300 mg/kg for rats and 1, 3 and 10 mg/kg for monkeys. The AUC0-24hr values at the highest dose levels employed in the rat and monkey one-month repeated dose toxicity studies, which had been determined preliminarily in toxicokinetic studies, were more than 50 times higher than that at the pharmacologically effective dose, 0.3 mg/kg, determined in pharmacological studies in rats. The difference in the highest dose levels employed in these studies between rats and monkeys was due to the difference in the bioavailability (BA) of this compound between these two animal species; the BA was higher in monkeys than in rats. Eventually, the range of systemic exposure to JTT-553 was also different between these two animal species and was from 82 to 860 µg·hr/mL in rats and from 9 and 452 µg·hr/mL in monkeys at the dose levels employed in the one-month repeated dose toxicity studies, indicating that not only dose levels but also systemic exposure to JTT-553 were lower in monkeys than in rats.
In the one-month repeated dose toxicity studies, the effects of JTT-553 on the postprandial plasma CM and TG levels were investigated after a single dose and after repeated dosing JTT-553 in monkeys. Postprandial increases in CM and TG were suppressed by JTT-553 from the lowest dose level of 1 mg/kg even after a single dose. Decreases in plasma T-CH and PL levels were also noted in male rats (from 100 mg/kg) and monkeys (from 1 mg/kg) after repeated dosing of JTT-553. The magnitude of the changes in plasma T-CH and PL was greater in monkeys (decreased by 17 to 26%) than in male rats (decreased by 10 to 12%) and the lowest dose levels and systemic exposure to JTT-553 for these changes were lower in monkeys (1 mg/kg, AUC0-24hr of JTT-553: 9 to 33 μg·hr/mL) than those in male rats (100 mg/kg, AUC0-24hr of JTT-553: 221 to 226 μg·hr/mL). These changes in the plasma lipid parameters were considered to be due to the pharmacological action of JTT-553 (inhibition of lipid absorption in the small intestine) and this pharmacological action could be detected even after a single dose of JTT-553 based on the effects on postprandial plasma CM and TG levels evaluated in monkeys. There were gender differences in the effects on the plasma lipid parameters in rats and plasma lipid parameters were not changed or were rather slightly increased in female rats after dosing JTT-553. Although the etiology of the gender differences in the pharmacological response in rats is not known, there is a possibility that determination of plasma lipid parameters after overnight fasting made the evaluation of the pharmacological response difficult or that rebound from or compensatory response against the pharmacological action occurred at the time point when plasma samples were collected. In monkeys, lipid droplets were increased in the epithelial cells and lamina propria of the small intestine from the lowest dose level. The increase in lipid droplets was localized to the epithelia and lamina propria of the upper small intestine (jejunum) which is the site responsible for the absorption of lipids, indicating that the histopathological finding is related to the pharmacological action of JTT-553 (accumulation of diglycerides and fatty acids due to inhibition of the re-synthesis of triglycerides in the small intestinal epithelial cells). Plasma transaminase levels were increased in male rats (ALT, from 100 mg/kg) and monkeys (ALT and AST, from 1 mg/kg) in the one-month repeated dose toxicity studies of JTT-553. These increases were not accompanied by changes in other hepatic function parameters including plasma ALP, LDH or T-BIL levels and there were no histopathological findings suggestive of hepatotoxicity from JTT-553 in either animal species. The magnitude of the increases in plasma transaminase levels was not changed along with the prolongation of the dosing period based on the results of time-course analyses conducted in monkeys and these increases disappeared by the withdrawal of dosing in both male rats and monkeys. The lowest dose levels and systemic exposure to JTT-553 for the increase in plasma transaminase levels were lower in monkeys (1 mg/kg, AUC of JTT-553 at 1 mg/kg was 9 to 33 μg·hr/mL) than those in male rats (100 mg/kg, AUC of JTT-553: 221 to 226 μg·hr/mL) as well as those for the effects on plasma lipid parameters. In rats, the increase in plasma ALT levels was slight (increased by 16% when compared with the control group) and limited to males as well as the decrease in plasma lipid parameters, while the enzyme levels in monkeys were increased to two to four times higher than the pre-dosing values, indicating that the effect of JTT-553 on the transaminase levels was more prominent in monkeys than rats. From these results, monkeys are considered to be much more sensitive to the decrease in plasma lipid parameters (pharmacological action of JTT-553) and the increase in plasma transaminase levels than rats in terms of the dose levels, systemic exposure to JTT-553 and magnitude of these changes. The species differences in response to the pharmacological action (lipid-lowering action) of JTT-553 between these two animals was considered to be due to the difference in feeding status and timing of the dosing of JTT-553 between these two animal species. In rats, diet was given ad libitum (free access to diets) and animals eat the diet mainly in the night when the concentrations of JTT-553 in the intestinal lumen and plasma are low because JTT-553 was dosed in the morning. On the other hand, in monkeys, diet was given at 4 hr after dosing JTT-553 when the concentrations of JTT-553 in the intestinal lumen and in plasma are high because JTT-553 was dosed in the morning as well as for rats. Elevation of plasma transaminase levels after dosing JTT-553 was also considered to be related to the pharmacological action of JTT-553 in terms of the correlation between the pharmacological findings (decreased lipid parameters) and the increases in plasma transaminase levels after dosing JTT-553 in rats and monkeys, the absence of findings suggestive of hepatotoxicity from JTT-553 in both animal species and the evidence that elevation of plasma transaminases do not necessarily reflects hepatotoxicity from drugs.
Transaminases are some of the key enzymes involved in the amino acid/glucose metabolism pathways and play an important role in gluconeogenesis in various organs/tissues including the liver, kidney and small intestine (DeRosa and Swick, 1975; Wu, 1998; Croset et al., 2001; Kobayashi et al., 2010). It’s known that plasma or tissue transaminase levels are changed due not only to hepatotoxicity or cytotoxicity of chemicals but also to alterations in the nutritional state of animals and humans or the pharmacology of drugs, which modify metabolism of glucose and lipids, including fibrates (Blane, 1987; Kobayashi et al., 2009, 2010, 2011). These evidences on transaminases and the profile of changes in plasma transaminase in the one-month repeated dose toxicity studies of JTT-553 led us to do exploratory studies for the investigation of the mechanism of elevation of plasma transaminases after dosing JTT-553.
Firstly, in the investigation of the mechanism, we focused on the relationships between the feeding status of the animals and the elevation of plasma transaminases. This is because the pharmacological target site of JTT-553 is the small intestine, where nutrients of diets are absorbed, and the response to JTT-553 was different between rats and monkeys whose feeding status in the one-month repeated dose toxicity studies were different; rats received JTT-553 under fed conditions (free access to diets), while monkeys received JTT-553 after fasting and were re-fed at 4 hr after dosing. JTT-553 was administered once orally to monkeys (3 mg/kg) and rats (30 mg/kg) with different feeding regimens to investigate the relationship between feeding status and the increase in plasma ALT levels after dosing JTT-553. In monkeys, plasma ALT levels were increased even after a single dose of JTT-553 under the same feeding regime as employed in the one-month repeated dose toxicity study (JTT-553 was administered to the animals after fasting and then they were re-fed at 4 hr after dosing). This is consistent with the evidence that the pharmacological response, suppression of postprandial increases in plasma lipid parameters, is observed after a single dose of JTT-553. In rats, plasma ALT levels were also increased markedly to the same extent as in monkeys at the dose level of 30 mg/kg, where plasma transaminase levels were not changed in the one-month repeated dose toxicity study, when the rats received JTT-553 with feeding status similar to that employed in the one-month repeated-dose toxicity study in monkeys. On the other hand, in both animal species, plasma ALT levels did not increase without re-feeding after dosing JTT-553 with overnight fasting. These results indicated that the mechanism of the elevation of plasma transaminase after dosing JTT-553 is the same between these two animal species and that fasting before dosing and re-feeding after dosing are necessary for the increase in plasma transaminase levels after dosing JTT-553. Therefore, the magnitude of elevation in plasma transaminases noted after repeated dosing JTT-553 between rats and monkeys was considered to be due to the difference in feeding status in the one-month repeated dose toxicity studies between these two animal species.
The results of the single dose studies with different feeding regimen also indicated that the increase in plasma ALT levels was related to the absorption of nutrients in the diet provided after fasting. Therefore, we investigated the nutrients in the diet which contribute to the JTT-553-related plasma transaminase changes by oral loading of corn oil, glucose or polypeptone after a single oral dosing of JTT-553 to rats that had been fasted overnight before dosing. Plasma ALT and AST levels were increased in the JTT-553-treated animals with corn oil (lipids) loading but were not changed in the JTT-553-treated animals with glucose or polypeptone loading, indicating that lipids (fatty acids) in the diet are responsible for the increase in plasma transaminase levels after dosing JTT-553 to animals fed after dosing. In this study, the increases in plasma transaminase levels in the animals fed the basal diet were less prominent than those in the corn oil-loaded animals, suggesting that carbohydrates or proteins in the basal diet inhibited the mechanism of the elevation of transaminase activity by JTT-553.
Based on the results of the one-month repeated dose toxicity studies and a series of exploratory studies that modified the feeding status of animals, the JTT-553-related plasma transaminase changes were considered not to be due to release of the enzymes from injured cells into circulation, as in the case of hepatocellular injury, but to the pharmacological mechanism of action of JTT-553 in which the metabolism of fatty acids is involved. Lipid-lowering drugs, such as fibrates and statins, slightly increase serum transaminase levels (less than three times the upper limit of normal) in humans via a different mechanism than that from liver injury (Tolman, 2000). Fenofibrate has been reported to modify a variety of aspects of lipid metabolism leading to reductions in plasma lipid levels (Balfour et al., 1990; Blane, 1987). In addition, fenofibrate increases enzyme protein synthesis of transaminases in the liver and that increase is considered to be related to alteration in amino acid/glucose metabolism due to the alteration in triglyceride metabolism as the pharmacological action (Edgar et al., 1998; Kobayashi et al., 2009). These evidences led us to the idea that JTT-553 altered the amino acid/glucose metabolism in the liver through modification of the lipid metabolism and then increased enzyme protein synthesis of transaminase in the liver. In order to test this hypothesis, the ALT levels in the liver were measured after corn-oil loading in the JTT-553-treated rats. ALT levels in the small intestinal mucosa were also measured because JTT-553 exhibits its pharmacological action mainly in the small intestine and the small intestine is one of the gluconeogenic organs and has high transaminase activity as well as the liver (Croset et al., 2001; Watford, 2005; Palou A et al., 1980; Kobayashi et al., 2010). Plasma and small intestinal ALT levels increased immediately after the corn oil loading in the JTT-553-treated rats but there were no changes in ALT levels in the liver, indicating that the increase in plasma ALT levels after treatment with JTT-553 was associated with an increase in ALT levels in the small intestine (mucosa). In the present study, we did not measure transaminase activity in the kidney, which is also a gluconeogenic organ, in the JTT-553-treated rats because transaminase activity in the kidney is much less than that in the liver or the small intestine and the contribution of transaminase released from the kidney seemed to be negligible in explaining the increase in plasma transaminase activity in the JTT-553-treated animals (Clampitt and Hart, 1978; Palou et al., 1980; Kobayashi et al., 2010).
It is known that there are inter-animal species differences in transaminase activities in the small intestine; ALT activity is equal to or higher than AST activity in the rat and monkey small intestine whereas AST activity is much higher than ALT activity in the canine small intestine based on our data (data not shown) and literatures (Remesar et al., 1980; Palou et al., 1980; Cornelius et al., 1959; Clampitt and Hart, 1978; Keller, 1981). Therefore, the effects of JTT-553 on plasma transaminase activities were evaluated in the corn oil-loaded dogs in order to further investigate the relationships between small intestinal and plasma transaminase activity alterations noted after dosing JTT-553. The plasma transaminase that was increased after dosing JTT-553 in the corn oil-loaded dogs was AST, not ALT, and the response to JTT-553 in dogs was different from that in rats and monkeys in both of which ALT activity is equal to or higher than AST activity in the small intestine. The results obtained in the JTT-553-treated dogs strongly support the thesis that the origin of the plasma transaminase that increased after dosing JTT-553 is the small intestine.
In order to determine whether the JTT-553-related plasma ALT changes are associated with enzyme induction (enhanced de novo synthesis of cellular transaminases) in the small intestine, the effects of actinomycin D, a nucleic acid synthesis inhibitor, on the JTT-553-related small intestinal and plasma ALT changes were investigated in the corn oil-loaded rats. Pretreatment of the rats with actinomycin D suppressed the response in small intestinal and plasma ALT to JTT-553, indicating that increased transaminase protein synthesis in the small intestine is responsible for the increase in plasma ALT activity after dosing JTT-553.
In the one-month repeated dose toxicity studies of JTT-553 in rats and monkeys, plasma transaminase activities were increased at the same dose levels as the pharmacological action (lipid lowering effects) of JTT-553 was noted. In addition, from the results of a series of exploratory studies, the increase in plasma transaminase activity after dosing JTT-553 was considered to be associated with an increase in transaminase activity through increased enzyme protein synthesis in the small intestine which is the pharmacological target organ of JTT-553. Furthermore, the increase in transaminase activity in the small intestine was considered to be related to absorption of lipids (fatty acids) in a fasted state. JTT-553 is a DGAT1 inhibitor and suppresses the formation of triglycerides from fatty acids and diacylglycerol in the small intestine as its primary pharmacological action (Tomimoto et al., 2015a, 2015b). After dosing JTT-553, fatty acids temporarily accumulate in the intestinal epithelial cells, noted histopathologically as an increase in lipid droplets in the epithelial cells and lamina propria of the small intestinal mucosa (jejunum) in the one-month repeated dose toxicity study in monkeys, due to inhibition of DGAT1 by JTT-553. In response to the accumulation of fatty acids in the cells, beta-oxidation of fatty acids, as a process of degradation of accumulated fatty acids, is considered to be accelerated. Gluconeogenic pathways are closely related to fatty acid metabolism (Lam et al., 2003). Acceleration of beta-oxidation of fatty acids leads to inhibition of pyruvate dehydrogenase (PDH) activity by acetyl CoA produced by beta-oxidation of fatty acids. The inhibition of PDH activity leads to suppression of production of acetyl CoA from pyruvate and to activation of pyruvate carboxylase (PC), an enzyme involved in the gluconeogenesis pathway (Fig. 11). The activation of PC finally leads to activation of other enzymes involved in the gluconeogenesis pathway including ALT and AST (Lam et al., 2003; Kobayashi et al., 2011). From these, the increase in transaminase levels in the small intestine after dosing JTT-553 was considered to be related to acceleration of beta-oxidation for degradation of the fatty acids accumulated in the small intestine as the result of the pharmacological action of JTT-533 (inhibition of the re-synthesis of triglycerides from free fatty acids and diacylglycerol).
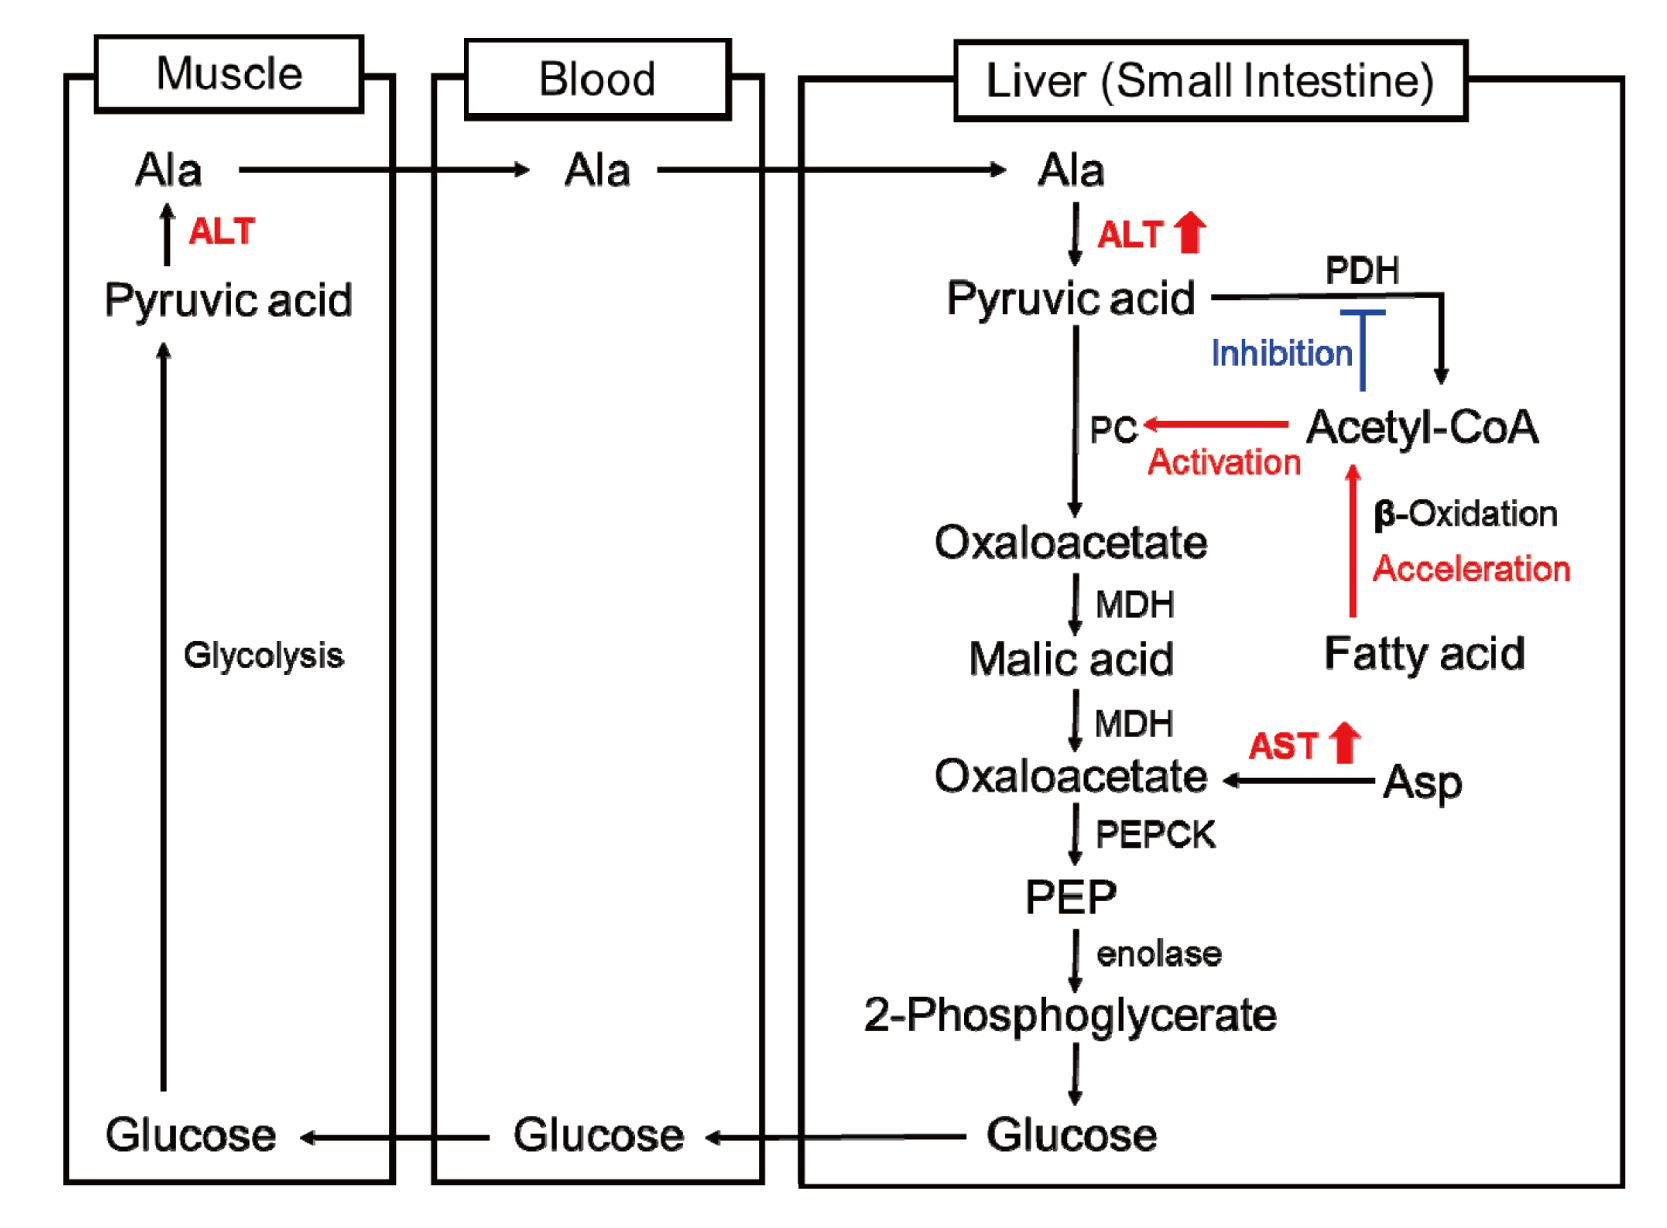
In order to confirm this discussion, the effects of JTT-553 on plasma transaminase levels were investigated in the situation where the fatty acid supply to the intestinal epithelial cells was suppressed through the inhibition of fatty acid absorption in the small intestine by co-administration of orlistat (a lipase inhibitor) in the corn-oil loaded rats and dogs treated with JTT-553 after overnight fasting. JTT-553-related changes in plasma ALT (rats) or AST (dogs) were not observed when the fatty acid supply to the intestinal epithelial cells was suppressed through inhibiting lipase activity in the lumen, indicating that acceleration of beta-oxidation of fatty acids takes part in the increase in the small intestinal transaminase activities. Taking all the results of the exploratory studies into consideration, the JTT-553-related increase in plasma transaminase activity is considered to be related to gluconeogenesis in the small intestine, but not in the liver, which was modified by alteration of lipid metabolism due to the pharmacological action of JTT-553 in addition to fasting, which also accelerates gluconeogenesis, before dosing JTT-553.
In conclusion, the JTT-553 (a DGAT1 inhibitor) -related increase in plasma transaminase levels is considered not to be due to release of the enzymes from injured cells into the circulation but to be a phenomenon resulting from enhancement of enzyme protein synthesis in the small intestine following gluconeogenesis accelerated by the pharmacological action of JTT-553 (inhibition of the re-synthesis of triglycerides from free fatty acids and diacylglycerol) in this organ, in combination with physiological responses to starvation.
ACKNOWLEDGMENTS
The author would like to thank the invaluable contributions of the staff at the Toxicology Research Laboratories, Central Pharmaceutical Research Institute, JAPAN TOBACCO INC.
Conflict of interest
The authors declare that there is no conflict of interest.
REFERENCES
- Balfour, J.A., McTavish, D. and Heel, R.C. (1990): Fenofibrate. A review of its pharmacodynamic and pharmacokinetic properties and therapeutic use in dyslipidaemia. Drugs, 40, 260-290.
- Bell, R.M. and Coleman, R.A. (1980): Enzymes of glycerolipid synthesis in eukaryotes. Annu. Rev. Biochem., 49, 459-487.
- Blane, G.F. (1987): Comparative toxicity and safety profile of fenofibrate and other fibric acid derivatives. Am. J. Med., 83, 26-36.
- Bruss, M.D., Khambatta, C.F., Ruby, M.A., Aggarwal, I. and Hellerstein, M.K. (2010): Calorie restriction increases fatty acid synthesis and whole body fat oxidation rates. Am. J. Physiol. Endocrinol. Metab., 298, E108-E116.
- Cases, S., Stone, S.J., Zhou, P., Yen, E., Tow, B., Lardizabal, K.D., Voelker, T. and Farese, R.V. Jr. (2001): Cloning of DGAT2, a second mammalian diacylglycerol acyltransferase, and related family members. J. Biol. Chem., 276, 38870-38876.
- Chen, H.C., Stone, S.J., Zhou, P., Buhman, K.K. and Farese, R.V. Jr. (2002): Dissociation of obesity and impaired glucose disposal in mice overexpressing acyl coenzyme A : diacylglycerol acyltransferase 1 in white adipose tissue. Diabetes, 51, 3189-3195.
- Clampitt, R.B. and Hart, R.J. (1978): The tissue activities of some diagnostic enzymes in ten mammalian species. J. Comp. Pathol., 88, 607-621.
- Coleman, R.A. and Lee, D.P. (2004): Enzymes of triacylglycerol synthesis and their regulation. Prog. Lipid Res., 43, 134-176.
- Cornelius, C.E., Bishop, J., Switzer, J. and Rhode, E.A. (1959): Serum and tissue transaminase activities in domestic animals. Cornell Vet., 49, 116-126.
- Croset, M., Rajas, F., Zitoun, C., Hurot, J.M., Montano, S. and Mithieux, G. (2001): Rat small intestine is an insulin-sensitive gluconeogenic organ. Diabetes, 50, 740-746.
- DeRosa, G. and Swick, R.W. (1975): Metabolic implications of the distribution of the alanine aminotransferase isoenzymes. J. Biol. Chem., 250, 7961-7967.
- Edgar, A.D., Tomkiewicz, C., Costet, P., Legendre, C., Aggerbeck, M., Bouguet, J., Staels, B., Guyomard, C., Pineau, T. and Barouki, R. (1998): Fenofibrate modifies transaminase gene expression via a peroxisome proliferator activated receptor alpha-dependent pathway. Toxicol. Lett., 98, 13-23.
- Gould, S. and Scott, R.C. (2005): 2-Hydroxypropyl-beta-cyclodextrin (HP-beta-CD): a toxicology review. Food Chem. Toxicol., 43, 1451-1459.
- Hoffmann, W.E., Kramer, J., Main, A.R. and Torres, L. (1989): Clinical enzymology. In the clinical chemistry of laboratory animals, (Loeb, W.F. and Quimby, F.W., eds.), pp.239-242, Elsevier Science Ltd., Amsterdam.
- Katchman, B.J. and Zipf, R.E. (1970): Correlation between triglycerides and glutamic-pyruvic transaminase in men on high-fat diets. Clin. Chem., 16, 118-123.
- Keller, P. (1981): Enzyme activities in the dog: tissue analyses, plasma values, and intracellular distribution. Am. J. Vet. Res., 42, 575-582.
- Kennedy, E.P. (1957): Metabolism of lipides. Annu. Rev. Biochem., 26, 119-148.
- Kobayashi, A., Oshida, S., Yamazaki, Y., Maekawa, T., Kuno, H., Sugai, S., Sakakibara, H. and Shimoi, K. (2010): Relationships between plasma and tissue transaminase activities in rats maintained under different feeding conditions. J. Toxicol. Sci., 35, 639-652.
- Kobayashi, A., Suzuki, Y., Kuno, H., Sugai, S., Sakakibara, H. and Shimoi, K. (2009): Effects of fenofibrate on plasma and hepatic transaminase activities and hepatic transaminase gene expression in rats. J. Toxicol. Sci., 34, 377-387.
- Kobayashi, A., Yokoyama, H., Kataoka, J., Ishida, T., Kuno, H., Sugai, S., Sakakibara, H. and Shimoi, K. (2011): Effects of spaced feeding on gene expression of hepatic transaminase and gluconeogenic enzymes in rats. J. Toxicol. Sci., 36, 325-337.
- Kodama, T., Watanabe, E., Tsubuku, S., Otabe, A., Mochizuki, M., Masuyama, T. and Bernard, B.K. (2008): Studies of the toxicological potential of capsinoids: VII. A 13-week toxicity study of dihydrocapsiate in rats. Int. J. Toxicol., 27 Suppl. 3, 79-100.
- Lam, T.K., van de Werve, G. and Giacca, A. (2003): Free fatty acids increase basal hepatic glucose production and induce hepatic insulin resistance at different sites. Am. J. Physiol. Endocrinol. Metab., 284, E281-E290.
- Lardizabal, K.D., Mai, J.T., Wagner, N.W., Wyrick, A., Voelker, T. and Hawkins, D.J. (2001): DGAT2 is a new diacylglycerol acyltransferase gene family: purification, cloning, and expression in insect cells of two polypeptides from Mortierella ramanniana with diacylglycerol acyltransferase activity. J. Biol. Chem., 276, 38862-38869.
- Lee, W.M. (2003): Drug-induced hepatotoxicity. N. Engl. J. Med., 349, 474-485.
- Lehner, R. and Kuksis, A. (1996): Biosynthesis of triacylglycerols. Prog. Lipid Res., 35, 169-201.
- Oelkers, P., Behari, A., Cromley, D., Billheimer, J.T. and Sturley, S.L. (1998): Characterization of two human genes encoding acyl coenzyme A:cholesterol acyltransferase-related enzymes. J. Biol. Chem., 273, 26765-26771.
- Palou, A., Remear, X., Arola, L. and Alemany, M. (1980): Changes in alanine transaminase activity in several organs of the rat induced by a 24-hour fast. Horm. Metab. Res., 12, 505-508.
- Ramaiah, S.K. (2007): A toxicologist guide to the diagnostic interpretation of hepatic biochemical parameters. Food Chem. Toxicol., 45, 1551-1557.
- Ramesh, B. and Pugalendi, K.V. (2006): Impact of umbelliferone (7-hydroxycoumarin) on hepatic marker enzymes in streptozotocin diabetic rats. Indian J. Pharmacol., 38, 209-210.
- Remesar, X., Arola, L. and Palou, A. (1980): Effect of 24-hours fast on aspartate transaminase activities in the organs of the rat. Rev. Esp. Fisiol., 36, 147-150.
- Rosen, F., Roberts, N.R. and Nichol, C.A. (1959): Glucocorticosteroids and transaminase activity I. Increased activity of glutamic-pyruvic transaminase in four conditions associated with gluconeogenesis. J. Biol. Chem., 234, 476-480.
- Smith, D.A. and Schmid, E.F. (2006): Drug withdrawals and the lessons within. Curr. Opin. Drug Discov. Devel., 9, 38-46.
- Smith, S.J., Cases, S., Jensen, D.R., Chen, H.C., Sande, E., Tow, B., Sanan, D.A., Raber, J., Eckel, R.H. and Farese, R.V. Jr. (2000): Obesity resistance and multiple mechanisms of triglyceride synthesis in mice lacking Dgat. Nat. Genet., 25, 87-90.
- Tolman, K.G. (2000): Defining patient risks from expanded preventive therapies. Am. J. Cardiol., 85, 15-19.
- Tomimoto, D., Okuma, C., Ishii, Y., Akiyama, Y., Ohta, T., Kakutani, M., Ohkuma, Y. and Ogawa, N. (2015a): Pharmacological characterization of [trans-5′-(4-Amino-7,7-dimethyl-2-trifluoromethyl-7H-pyrimido[4,5-b][1,4]oxazin-6-yl)-2′,3′-dihydrospiro(cyclohexane-1,1′-inden)-4-yl]acetic acid monobenzenesulfonate (JTT-553), a novel Acyl CoA:diacylglycerol transferase (DGAT) 1 inhibitor. Biol. Pharm. Bull., 38, 263-269.
- Tomimoto, D., Okuma, C., Ishii, Y., Kobayashi, A., Ohta, T., Kakutani, M., Imanaka, T. and Ogawa, N. (2015b): JTT-553, a novel Acyl CoA:diacylglycerol acyltransferase (DGAT) 1 inhibitor, improves glucose metabolism in diet-induced obesity and genetic T2DM mice. J. Pharmacol. Sci., 129, 51-58.
- Unger, R.H. (2002): Lipotoxic diseases. Annu. Rev. Med., 53, 319-336.
- Watford, M. (2005): Is the small intestine a gluconeogenic organ? Nutr. Rev., 63, 356-360.
- Wu, G. (1998): Intestinal mucosal amino acid catabolism. J. Nutr., 128, 1249-1252.