Letter
Necrosis in human neuronal cells exposed to paraquat
2018 年 43 巻 3 号 p. 193-202
詳細
2018 年 43 巻 3 号 p. 193-202
Paraquat (PQ) is an herbicide that was once used worldwide, but is now prohibited in many nations due to its high toxicity to humans. However, there are still rare cases of the fetal intoxication of PQ, which was purchased prior to the prohibition in Japan. In this study, several cell death pathways, the mitochondrial stress response, and autophagy were examined in SH-SY5Y cells exposed to PQ. The results reveal the decrease of a mitochondrial stress sensitive-BNIP3 (Bcl-2/adenovirus E1B 19-kDa-interacting protein 3) protein, the suppression of autophagic flux, and the lack of apoptosis as well as other regulated forms of necrosis, such as necroptosis and ferroptosis. Taken together, our preliminary survey of cellular responses against PQ shows that, although responses of mitochondria and autophagy are observed, subsequent cell death is necrosis. Mechanism of PQ-induced SH-SY5Y cell death should be complicated and cannot be explained thoroughly by already-known mechanisms.
Paraquat (1,1’-dimethyl-4,4’-bipyridium, PQ) is an herbicide that was widely used around the world until several decades ago (Suntres, 2002). PQ is now prohibited in many developed countries due to its high toxicity, but is still used in several countries. Inherent PQ toxicity on humans includes liver and kidney damage, as well as the delayed development of pulmonary fibrosis (Ishida et al., 2006; Tomita et al., 2007; Yamada et al., 2015). Although pulmonary degenerations such as pulmonary edema, interstitial pneumonia, and fibrosis are main characteristics of PQ intoxication, several symptoms in the central nerve system (CNS), such as confusion, coma, and seizures, have also been suggested for PQ intoxication in experimental animals (Wu et al., 2013), as well as humans by use of high resolution neuroimaging techniques (Wu et al., 2012). Indeed, PQ can be transported across the blood-brain barrier into the CNS, suggesting the direct neurotoxicity of PQ (Shimizu et al., 2001).
PQ is a strong inducer of oxidative stress in cells. PQ becomes a cationic radical (PQ radical) after it extracts an electron from mitochondria. The PQ radical easily reacts with molecular oxygen, resulting in the generation of hydroxyl radical and hydrogen peroxide (Suntres, 2002). Thus, oxidative cellular stress by PQ involves both the generation of reactive oxygen species (ROS) and mitochondrial dysfunction. The mitochondrial pathway of apoptosis has been suggested as one of the mechanisms for dopaminergic neuronal cell death by PQ (Yang and Tiffany-Castiglioni, 2008). Recently, many mechanisms of cell death other than apoptosis have been revealed (Aki et al., 2015). For example, necroptosis has been found in ischemic brain injuries and is executed through defined molecules such as receptor-interacting protein 1 and 3 (RIP1 and RIP3) and mixed lineage kinase-like domain protein (MLKL) (Galluzzi et al., 2014). Ferroptosis has been identified as an iron- and lipid peroxide-dependent form of cell death (Dixon et al., 2012). Both are implicated in the degeneration of neuronal cells during ischemia and Parkinson’s disease (Degterev et al., 2005; Venderova and Park, 2012). Interestingly, PQ is also linked to Parkinson’s disease (Berry et al., 2010), raising the interest to examine the involvement of these cell death pathways in PQ neurotoxicity. In addition to these cell death pathways, autophagy is also implicated in the regulation of cell death. Although autophagy is mainly involved in the maintenance of cellular homeostasis, aberrant autophagy rather alleviates cell death (Kroemer and Levine, 2008). Moreover, autosis, an autophagy-dependent mode of cell death, has been suggested (Liu et al., 2013). However, the involvement of these types of cell death in PQ-induced dopaminergic neuronal cell death has not been examined so far. The aim of this study is to obtain in-depth understanding of neurotoxicity of PQ by use of in vitro system. For this purpose, SH-SY5Y human neuroblastoma was selected because the cell is an established model to examine neurotoxicity of chemicals as well as stresses (Cheung et al., 2009; Xicoy et al., 2017) and is shown more sensitive to PQ toxicity than other cells (Zhao et al., 2017). We examined the possible involvement of recently discovered forms of cell death in SH-SY5Y human neuroblastoma cells during PQ exposure, as well as the involvement of other cell death-regulating mechanisms such as the mitochondrial damage response and autophagy.
The reagents used in this study were as follows: paraquat (PQ, Sigma-Aldrich, St. Louis, MO, USA), chelerythrine (Calbiochem, San Diego, CA, USA), carbobenzoxy-valyl-alanyl-aspartyl-(O-methyl)-fluoromethylketone (Z-VAD, Calbiochem), 7-Cl-O-necrostatin-1 (nec-1s, BioVision, Milpitas, CA, USA), Ferrostatin-1 (Fer-1, Sigma-Aldrich), 3-methyladenine (3MA, Sigma-Aldrich), and chloroquine (CQ, Wako). The antibodies used were as follows: anti-caspase-9 (Cell Signaling Technology, Beverly, MA, USA) anti-cleaved caspase-3 (Cell Signaling Technology), anti-actin (Sigma-Aldrich), anti-p62 (MBL), anti-microtubules-associated protein light chain3 (LC3, Cell Signaling Technology), anti-glutathione peroxidase4 (GPX4, abcam, Cambridge, UK), anti-Bcl-2/adenovirus E1B 19-kDa-interacting protein 3 (BNIP3, Santa Cruz Biotechnologies, Dallas, TX, USA), and anti-phospho-receptor-interacting protein-3 (RIP3, abcam).
Cell culture and measurement of viabilitySH-SY5Y human neuroblastoma cells and Neuro2A murine neuroblastoma cells were grown in a 1:1 mixture of Ham’s F12 medium and Modified Eagle’s Medium and Dulbecco’s Modified Eagle’s Medium, respectively, supplemented with 10% fetal bovine serum, 100 units/mL Penicillin, and 100 μg/mL Streptomycin, at 37°C in a humidified atmosphere of 5% CO2. To induce differentiation of SH-SY5Y cells into neuronal cells, the cells were incubated with 10 μM retinoic acid (RA) for 4 days. During the differentiation period, the RA-containing medium was changed every 2 days. Cell viability was measured by a colorimetric assay (MTT assay) using a Cell Counting Kit-8 (Dojindo, Kumamoto, Japan). In brief, cells were grown on 96-well plates, and a 10 μL aliquot of Cell Counting Kit-8 solution was added to each well. The plates were incubated for 30 min at 37°C, and the absorbance at 450 nm was measured using a microplate reader (ARVO X series, Perkin Elmer, Waltham, MA, USA).
Evaluation of mitochondrial membrane potential by JC-1 cationic dyeMitochondrial membrane potential was evaluated by JC-1, a cationic dye that incorporates into mitochondria and emits red fluorescence in a ∆Φm-dependent manner. The cells were incubated with 1 µg/mL JC-1 (Molecular Probes, Eugene, OR, USA), followed by treatment with PQ for 4 hr. Then the cells were observed under fluorescence microscope (Leica, DMi8, Wetzlar, Germany).
Terminal deoxynucleotidyl transferase-mediated dUTP nick-end labeling (TUNEL) analysisTUNEL analysis was performed using MEBSTAIN Apoptosis TUNEL Kit Direct (MBL). FITC fluorescence was observed under a fluorescence microscope (DMi8, Leica).
Assessment of necrotic cell deathCells undergoing necrosis were evaluated by staining cells with 1 µM Hoechst33342 and 1 µM PI for 5 min. After staining, the cells were examined under a fluorescence microscope (DMi8, Leica).
Immunoblot analysisThe cells were detached from the culture dishes using a cell scraper and collected by centrifugation at 1,000 g for 7 min and further 10,000 rpm for 1 min. (MX207, TOMY, Tokyo, Japan). The pellets were immersed in STE buffer [0.32 M sucrose, 10 mM Tris-HCl, 5 mM EDTA, 50 mM NaF, 2 mM Na3VO4, and protease inhibitors (Complete, Roche Diagnosis, Indianapolis, IN, USA)] on ice, and disrupted by an ultrasonic wave disrupter (10 sec, 3 times, Branson, Danbury, CT, USA). Protein concentrations in the cell lysates were determined by the method of Bradford (Bradford, 1976). Equal amounts of proteins were subjected to SDS-polyacrylamide gel electrophoresis (SDS-PAGE) by the method of Laemmli (Laemmli, 1970), blotted onto PVDF membranes, and incubated with primary and peroxidase-conjugated secondary antibodies. A Western Lightning Chemiluminescence Reagent Plus kit (Perkin Elmer Life Sciences, Boston, MA, USA) was used to develop luminescence from the antigen bands. The band densities were measured with an image analyzer (CS analyzer; Atto, Tokyo, Japan).
Quantitative (real-time) reverse-transcription-polymerase chain reaction (qRT-PCR)Total RNA was extracted from the cells using Trizol reagent (Invitrogen, Carlsbad, CA, USA), and reverse transcription was performed using SuperScript II reverse transcriptase (Invitrogen) and oligo(dT)15. Quantitative RT-PCR was performed with the StepOnePlus RT-PCR System (Applied Biosystems, Foster City, CA, USA) using SYBR green as a fluorescent dye. Relative mRNA levels were quantified by the 2-∆∆Cτ method, and amplification of templates was performed using GoTaq Green Master Mix for quantitative PCR (Promega, Madison, WI, USA). The PCR conditions were as follows: 95°C for 20 sec followed by 40 cycles of 95°C for 3 sec and 60°C for 30 sec. The primers used are shown in Table 1.
| Transcript | Sequence |
|---|---|
| p62 | (forward) 5’-CTGAGGCGGAAGCCGAG -3’ |
| (reverse) 5’-CGTCACTGGAAAAGGCAACC-3’ | |
| LC3 | (forward) 5’-CCGCACCTTCGAACAAAGAG-3’ |
| (reverse) 5’-AAGCTGCTTCTCACCCTTGT-3’ | |
| β-Actin | (forward) 5’-CCACGAAACTACCTTCAACTCC-3’ |
| (reverse) 5’-TCATACTCCTGCTGCTTGCTGATCC-3’ |
All data are expressed as mean ± S.D. (standard deviation) of 4 samples. Dunnett’s or Turkey-Kramer statistical analysis was used throughout this study. p values less than 0.05 were considered to be statistically significant.
As shown in Fig. 1A, cell rounding, aggregation, floating, as well as retraction of the neurite-like protrusion were observed in SH-SY5Y cells treated with PQ (600 µM) for 24 or 48 hr. A PQ concentration (100-600 µM)-dependent decrease of cell viability, as measured by the MTT assay, was also observed. In cells exposed to PQ concentrations greater than 600 µM for 24 hr, a significant decrease of viability was observed (Fig. 1B). After 48 hr, significant decreases in cell viability were detectable at PQ concentrations as low as 100 µM (Fig. 1B). The concentration-response (decreased viability) relationship observed in this study was matched well to previous studies (Yang et al., 2009; Zhao et al., 2017). Since the treatment with 600 µM of PQ significantly decreased cell viabilities within 24 hr (Fig. 1B), we adopted this concentration for further analysis. Evaluation of mitochondrial membrane potential by use of JC-1 dye showed a decreased emission of red fluorescence, which indicates healthy mitochondria, and an increased emission of green fluorescence, which indicates the loss of mitochondrial membrane potential, in response to PQ exposure in the cells (Fig. 1C). Nuclei in PQ-treated cells were negative to TUNEL staining, suggesting necrotic feature of the cell death at least in our experimental settings (Fig. 1D). Further treatment with PQ for 48 hr resulted in the plasma membrane breakdown (Fig. 1E). Thus, we concluded that the cell death by PQ (600 µM, 24~48 hr) is necrosis. These results also suggest that PQ induces SH-SY5Y neuroblastoma cell death in both time- and concentration-dependent manners.

PQ exposure decreases the viability of SH-SY5Y neuroblastoma cells in a concentration-dependent manner. Differentiated SH-SY5Y cells were treated with the indicated concentrations (100-1000 µM) of PQ for the indicated time periods (24 or 48 hr). Photomicrographs of the cells (A) and viability as measured by MTT assay (B) are shown. Data are shown as mean ± S.D. (n = 4). *p < 0.05, **p < 0.01 versus 0 µM. Scale bars, 50 µm. (C) PQ decrease mitochondrial membrane potentials. Differentiated SH-SY5Y cells were loaded with JC-1 dye, followed by treatment with PQ (600 µM, 4 hr) and examination under a fluorescence microscope. Increased green and decreased red fluorescence indicate mitochondrial dysfunction in the cells. Yellow arrows indicate JC-1 stained cells. Scale bars, 50 µm. (D) TUNEL analysis of PQ (600 µM, 24 hr-treated SH-SY5Y cells. H2O2 (600 µM, 24 hr) was used as a control. Nuclear green fluorescence of fluorescein isothiocyanate (FITC) indicates TUNEL-positive cells. Phase contrast images (PHASE) were also shown. Scale bars, 50 µm. (E) Loss of plasma membrane integrity of SH-SY5Y cells after exposure to 600 µM PQ for 48 hr. The cells were stained with Hoechst and PI and observed under fluorescence microscope. Scale bars, 50 µm.
The involvement of apoptosis and/or regulated necrosis in SH-SY5Y cell death by PQ was examined using inhibitors of apoptosis, necroptosis, and ferroptosis. Z-VAD is a pan-caspase inhibitor that inhibits almost all types of apoptosis (Thornberry and Lazebnik, 1998). Nec-1s is an inhibitor of RIP1, which is involved in the execution of necroptosis (Vandenabeele et al., 2013; Degterev et al., 2013). Fer-1 is an inhibitor of ferroptosis: ferroptosis is executed through the formation of lipid peroxides and Fer-1 could inhibit ferroptosis by reducing cellular levels of lipid peroxide (Zilka et al., 2017; Dixon et al., 2012). 3MA is an inhibitor of autophagy (Seglen and Gordon, 1982). As shown in Fig. 2A, the decrease in cell viability was not prevented by any of these cell death inhibitors at any doses, suggesting that cell death by PQ is not typical type of apoptosis, necroptosis, ferroptosis, or autophagic cell death. Similar results were also obtained by use of another neuroblastoma cell line, Neuro2A (Fig. 2B), suggesting that the mechanism of SH-SY5Y cell death by PQ should be conserved to some extent between neuronal cells. Also, SH-SY5Y cells showed higher sensitivity to PQ than Neuro2A cells (Fig. 2B), confirming that SH-SY5Y cells are more sensitive to PQ than other cells (Zhao et al., 2017). We also examined effects of these inhibitors on SH-SY5Y cell death by chelerythrine, which is also a mitochondrial toxin and induces rapid apoptotic cell death (Kaminskyy et al., 2008; Funakoshi et al., 2011). As shown in Fig. 2C, treatment with 10 µM chelerythrine for an hour resulted in approx. 70% loss of viabilities. Loss of viabilities by chelerythrine was significantly suppressed by 50 µM Z-VAD (Fig. 2C), confirming that neurotoxicity of PQ is distinct from that of chelerythrine.

Effects of Z-VAD, nec-1s, fer-1, or 3MA on SH-SY5Y and Neuro2A cell death by PQ as well as SH-SY5Y cell death by chelerythrine. Differentiated SH-SY5Y cells (A and C) or Neuro2A cells (B) were treated with or without Z-VAD (50 µM and 500 µM), nec-1s (10 µM and 100 µM), fer-1 (1 µM and 10 µM), or 3MA (5 mM and 10 mM) for 30 min., then further treated with 600 µM PQ for 24 hr (A and B) or 10 µM chelerythrine (CHE) for 1 hr (C). Viability as measured by MTT assay is shown. Data are shown as mean ± S.D. (n = 4). *p < 0.05, **p < 0.01.
To confirm the absence of apoptosis, necroptosis, and ferroptosis, executioner proteins of these forms of cell death were examined by immunoblotting. Apoptosis is executed by caspases (Thornberry and Lazebnik, 1998), but neither caspase-9 nor caspase-3 was activated in PQ-treated cells. Neither a decrease in uncleaved caspase-9 (inactivated pro-form) nor an increase in cleaved caspase-3 (activated mature form) was observed (Fig. 3A). RIP3 is involved in the execution of necroptosis and is activated through phosphorylation (Cho et al., 2009), but the levels of phospho-RIP3 did not change during PQ exposure (Fig. 3B). GPX4 catalyzes the reduction of lipid peroxides, and a decrease in GPX4 and the resultant accumulation of lipid peroxides are prerequisite for ferroptosis (Dixon et al., 2012). Consistent with the inability of Fer-1 to inhibit cell death (Fig. 2B), the levels of GPX4 remained constant during PQ exposure (Fig. 3B). Collectively, the absence of apoptosis, necroptosis, and ferroptosis was further confirmed by these immunoblot experiments.

Changes in caspases, GPX4, and RIP3 levels during exposure of SH-SY5Y cells to PQ. Differentiated SH-SY5Y cells were treated with the indicated concentrations (100-600 µM) of PQ for 24 hr. Cell lysates were prepared and immunoblot analyses were performed using anti-caspase-9, anti-cleaved (activated) caspase-3, anti-GPX4, and anti-phospho-RIP3 antibodies. Data are shown as mean ± S.D. (n = 4).
The status of autophagy was examined in SH-SY5Y cells during PQ exposure. Immunoblot analysis showed that LC3-II, a marker of autophagy (Kabeya et al., 2000), was significantly increased in PQ (600 µM)-treated cells (Fig. 4A). In contrast, the level of an autophagy substrate protein, p62, which should be degraded during autophagy (Komatsu et al., 2007; Ichimura et al., 2008), did not decrease in PQ-treated cells (Fig. 4A). qRT-PCR analysis showed that the expression of LC3 remained constant between PQ-treated and untreated cells while the amount of p62 in PQ-treated cells was higher than in untreated cells (Fig. 4B). Next, proteins that link mitochondrial damage to autophagy were examined by immunoblotting, since PQ has been shown to damage mitochondria and autophagy is involved in the elimination of damaged mitochondria (a process known as mitophagy). Although a well-known mitophagy inducer, PARKIN, could not be detected in SH-SY5Y cells under our experimental conditions (data not shown), the level of BNIP3, another mitophagy inducer, was found to be decreased after exposure to 300-600 µM PQ for 24 hr (Fig. 4C). Evaluation of autophagy flux by use of the lysosome inhibitor chloroquine (CQ) revealed that the increased levels of LC3-II in PQ-treated cells were not affected by co-treatment with CQ (Fig. 4D). Collectively, these results suggest that autophagy was impaired due to the decrease of lysosomal function in PQ-treated cells. p62 functions in various cellular activities other than autophagy and is degraded by several proteases other than lysosomal proteases (Moscat et al., 2016; Colunga et al., 2014). Thus, lack of p62 accumulation in PQ-treated cells, in which p62 mRNA expression is increased (Fig. 4B), might indicate that p62 is degraded through lysosome-independent mechanism(s) in PQ-treated cells.
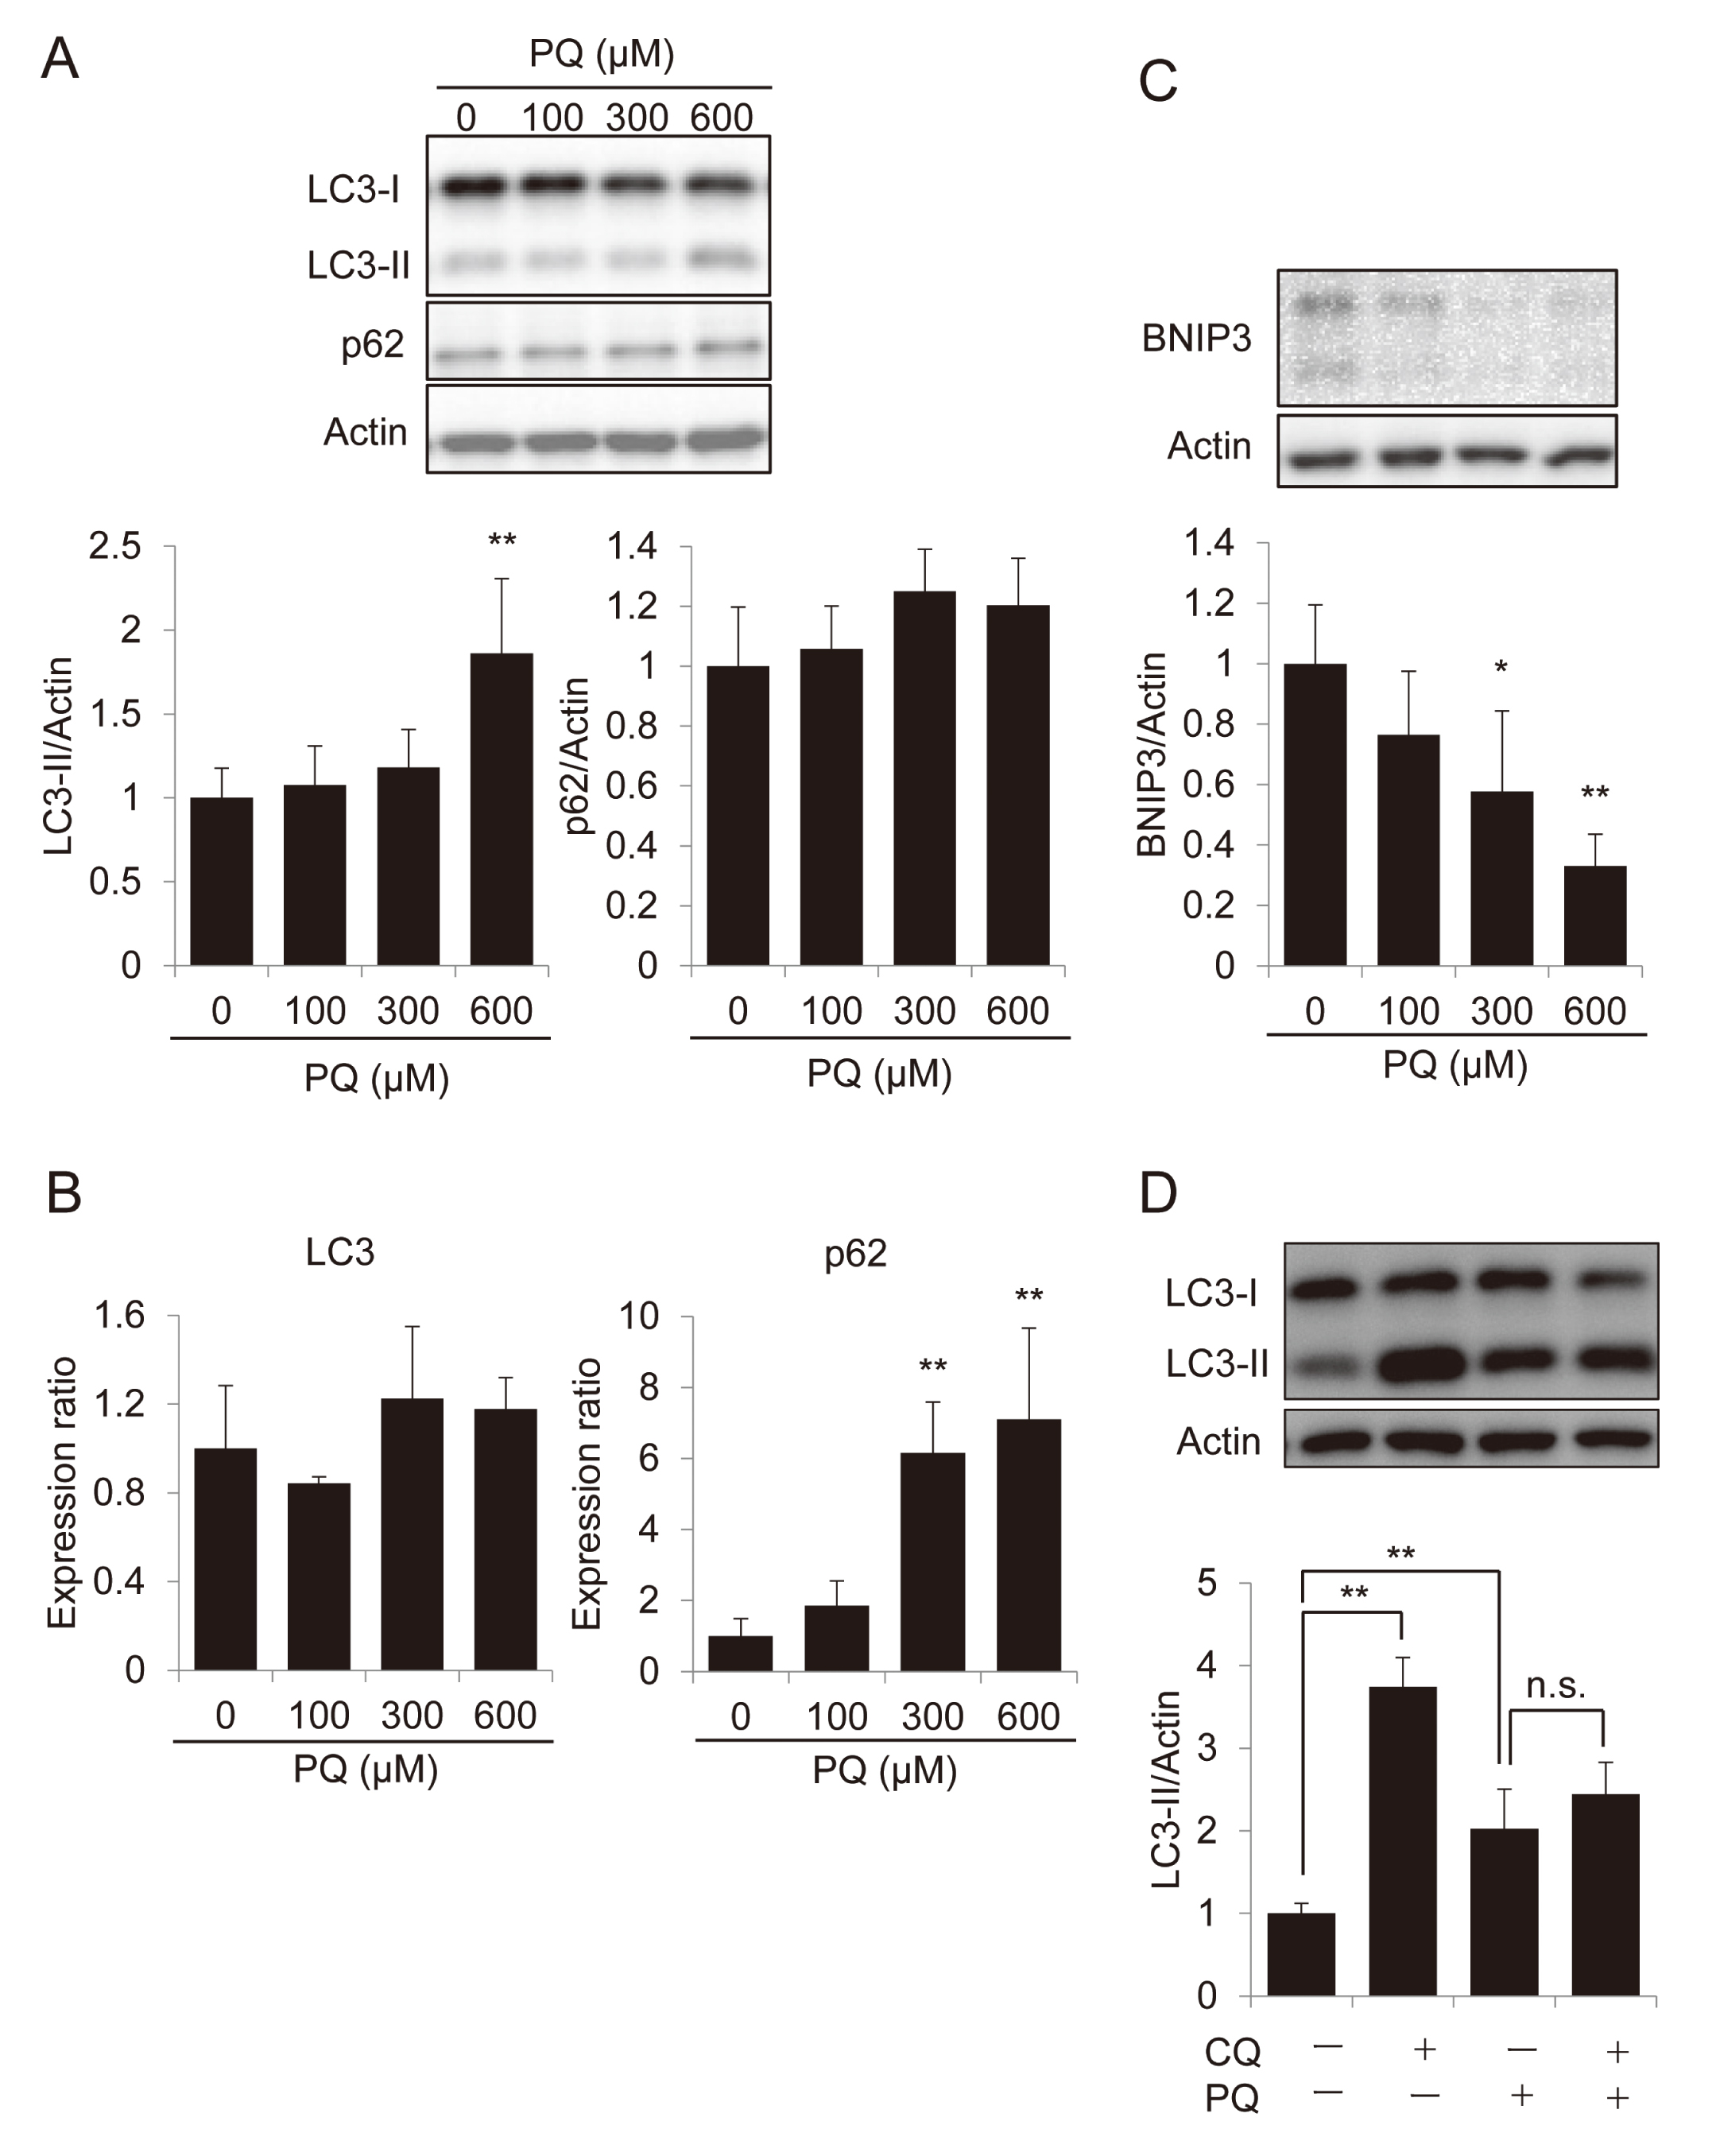
Changes in LC3, p62, and BNIP3 during exposure of SH-SY5Y cells to PQ. (A-C) Differentiated SH-SY5Y cells were treated with the indicated concentrations (100-600 µM) of PQ for 24 hr. Cell lysates were prepared and immunoblot analyses were performed using anti-p62 and anti-LC3 antibodies (A). Total RNA was extracted and qRT-PCR was performed (B). Immunoblot analysis of BNIP3 (C). Data are shown as mean ± S.D. (n = 4). *p < 0.05, **p < 0.01 versus 0 µM. (D) The cells were treated with 10 µM CQ for 30 min., then further treated with 600 µM PQ for 24 hr. Cell lysates were prepared and immunoblot analyses were performed. Data are shown as mean ± S.D. (n = 4). **p < 0.01. n.s., Not significant.
SH-SY5Y neuroblastoma cells are frequently used to examine the neurotoxicity by various stresses and toxic substances, and modes of cell death in the cells after exposure to herbicides and neurotoxins, such as PQ, diquat, rotenone, and 1-methyl-4-phenylpyridinium (MPP+), have been studied extensively. Although there is much literature showing that apoptosis is the main mode of SH-SY5Y cell death during exposure to these substances, recent studies have shown possible involvement of necroptosis and/or ferroptosis in cell death by diquat and MPP+ (Nisar et al., 2015; Ito et al., 2017). Oxidative cellular stress is the main cause of PQ toxicity (Suntres, 2002) and the generation of lipid peroxides has been implicated mostly in PQ cytotoxicity (McCormack et al., 2005). However, we did not observe any indication for the involvement of ferroptosis in PQ-induced SH-SY5Y cell death (Fig. 2). We also could not observe necroptosis in PQ-exposed SH-SY5Y cells (Fig. 2), in contrast to the case of diquat that is an herbicide structurally resembling PQ and has been shown to cause necroptosis of SH-SY5Y cells (Nisar et al., 2015). Therefore, the unique feature of necroptosis- and ferroptosis-independent necrosis caused by PQ on SH-SY5Y cells might represent a model in which to search for a novel mechanism of necrosis.
BNIP3 is a member of the Bcl-2 family of proteins (Zhang and Ney, 2009). Although BNIP3 was initially considered to be a pro-apoptotic member of this family due to its structural feature of being a pro-apoptotic BH3-domain only protein, it has recently been shown that it also acts as a mitophagy inducer (Quinsay et al., 2010). Indeed, BNIP3 binds LC3 and links damaged mitochondria to autophagy machinery (Hanna et al., 2012). In this study, we found a sharp decrease of BNIP3 after 24 hr of exposure (Fig. 4C). This should suggest that PQ should eliminate BNIP3 during the death of neuronal SH-SY5Y cells.
In summary, the lack of apoptosis, necroptosis, and ferroptosis in PQ-treated SH-SY5Y cells was demonstrated. Although the status of autophagy as well as BNIP3 is strongly affected by PQ, lack of the effect of 3MA on PQ-induced cell death (Fig. 2A) suggests that autophagy impairment should be a result from cell death by necrosis. However, further studies are needed to understand the exact relationship between BNIP3, autophagy, and cell death in PQ-treated cells.
Conflict of interestThe authors declare that there is no conflict of interest.