Abstract
Chronic exposure to cadmium (Cd) leads to an accumulation of Cd in the kidneys. Metallothionein (MT) is a low-molecular-weight protein having a high affinity for Cd. Cd bound to MT in serum is filtered through the glomeruli of kidney nephrons and reabsorbed by endocytosis into the proximal tubules from the luminal side. Accumulation of Cd in renal cells induces MT synthesis, leading to long-term deposition of Cd and the suppression of Cd toxicity. Recently, many studies have investigated the tissue distribution of metals using laser ablation ICP-MS (LA-ICP-MS). However, little information has been available regarding renal Cd distribution. Hence, we dually investigated the renal distribution of Cd by LA-ICP-MS and that of MT by immunohistochemistry to clarify the dose- and time-dependent changes in the distributions of Cd and MT in mice exposed to Cd from drinking water for 1, 2, and 4 months. Both Cd and MT exhibited characteristic heterogeneous distribution patterns in the renal cortex. The accumulation of Cd and MT near the surface of the cortex suggests a preferential accumulation of Cd in the surface nephrons. MT distribution was more pronounced in the proximal tubules than in the distal tubules, and there were clear differences in MT immunostaining even among the proximal tubules. The heterogeneous localization of MT may reflect the nephron-specific accumulation of Cd. Combining elemental imaging of Cd with immunostaining of MT proved a successful strategy to reveal the characteristic renal Cd distribution, especially in the early stages of Cd accumulation.
INTRODUCTION
Prolonged exposure to cadmium (Cd) causes preferential accumulation of Cd in the kidneys, leading to renal dysfunction in extreme cases (Baba et al., 2014; Himeno and Aoshima, 2019; Nordberg et al., 2021). Cd accumulates in the proximal tubules in the renal cortex, causing defects in the reabsorption of glucose, amino acids, and low-molecular-weight proteins such as β2-microglobulin. Cd is tightly bound to metallothionein (MT) in tissues and body fluids (Klaassen et al., 2009). Due to the small size of MT (6,000–7,000 kDa), the Cd-MT complex in serum is filtered through the glomeruli and reabsorbed into the proximal tubule epithelial cells (PTECs) from the luminal side via endocytosis mainly at the convoluted (the S1 and S2 segments) proximal tubules (Onodera et al., 2012; Sabolić et al., 2010; Vesey, 2010). It has been presumed that the Cd ions released from the Cd-MT deposited in the PTECs induce MT and are bound again to the MT within cells, resulting in prolonged Cd deposition in the kidney (Nordberg et al., 2021). However, little information has been available concerning the precise localization of Cd and MT in the renal cortex, especially in the early phase of Cd exposure.
Laser ablation inductively coupled plasma mass spectrometry (LA-ICP-MS) is an elemental imaging technique in which small sections of laser-ablated tissues are sequentially introduced into ICP-MS to create a grid image of metal concentrations (Becker et al., 2014; Qin et al., 2011). LA-ICP-MS has recently been used in various studies to investigate the renal distribution of metals, such as mercury (Hg) (Iwase et al., 2021; Liu et al., 2021), lead (Torimoto et al., 2021), and platinum (Pt) (Egger et al., 2014; Legin et al., 2016; Moreno-Gordaliza et al., 2011). Many studies have shown that the renal toxicity of heavy metals, such as Hg, Pt, Cd, and chromium, is manifested in a region-specific manner, i.e., some metals induce more pronounced damage in the S1 and S2 regions of the proximal tubules while others do so in the S3 regions (Dorian et al., 1992; Ichimura et al., 2004; Zalups et al., 2014; Zhang et al., 2008; Zhou et al., 2008). It is crucial to identify in what subregions of the kidneys the metals accumulate to clarify the mechanisms of region-specific renal toxicities of metals. However, no study has yet examined the dose- and time-dependent changes in the renal distribution of Cd using LA-ICP-MS.
Tissue distribution of MT detected by immunohistochemistry may reflect the tissue distribution of Cd in animals exposed to Cd. Many studies have been carried out to examine the localization of MT in the tissues, including the kidneys (Banerjee et al., 1982; Danielson et al., 1982; Ljubojević et al., 2019; Nishimura et al., 1989; Sabolić et al., 2018). However, most microscopic observations of MT have been restricted to narrow areas. Some have focused on the subcellular localization of MT in the cytosol and nucleus (Banerjee et al., 1982; Nishimura et al., 1989). In contrast, little information has been available on the distribution of MT through the broader region of the kidneys, from the surface of the cortex to the medulla.
Hence, this study aimed to clarify the spatial localization of Cd and MT in the kidneys of mice receiving Cd under conditions where renal toxicity is minimally manifested. We used LA-ICP-MS and immunohistochemistry to investigate the distributions of Cd and MT, respectively, in female mice receiving CdCl2 from drinking water for 1, 2, and 4 months. Here we demonstrate characteristic distributions of Cd and MT in the kidneys of mice in the early phase of Cd accumulation.
MATERIALS AND METHODS
Materials
Mouse anti-metallothionein monoclonal antibody was purchased from Abcam (Cambridge, UK), mouse Kim-1 polyclonal antibody was purchased from Novus Biologicals (Osaka, Japan), and a mouse TIM-1/KIM-1/HAVCR Quantikine ELISA kit was purchased from R&D Systems USA & Canada (Minneapolis, MN, USA). An in situ apoptosis detection kit (TdT-mediated dUTP nick end labeling (TUNEL) assay) was purchased from Takara Bio (Shiga, Japan). A LabAssay Creatinine kit was purchased from FUJIFILM Wako Pure Chemical Corporation (Gunma, Japan).
Animals
Female ICR mice (25–30 g, Japan SLC, Shizuoka, Japan) were housed under a 12 hr dark/light cycle and given regular food and water ad libitum. We used female mice in this experiment because previous studies have shown higher sensitivity of female animals than males to Cd toxicity (Brzóska et al., 2005a, 2005b). The mice were administered Cd (0, 20, or 50 ppm) via drinking water for 1, 2, and 4 months (n = 4–5). At the time of sacrifice, sections of the kidney tissues were prepared. Half of the kidney tissue was embedded in the Optimal Cutting Temperature (O.C.T.) compound (Sakura Finetek USA; Torrance, CA, USA) and immediately frozen at –80°C. The other half was formalin-fixed and used for section preparation. The contralateral kidney was used to measure Cd concentrations and extract total RNAs. The Experimental Animal Research Committee of Tokushima Bunri University provided ethical approval for the use of laboratory animals in this study (Permit No:25).
Determination of Cd
Tissue samples of liver and kidneys (about 50 mg) were digested in Teflon vessels with 1 mL of concentrated nitric acid using a closed microwave digestion system (Ethos One; Milestone, Germany). After decomposition at 180°C for 10 min, Milli-Q water was added to the samples until the volume reached 10 mL. The concentrations of Cd in these samples were determined by ICP-MS (Agilent 7700x Japan). Indium (115In) was used as an internal standard for analyzing 111Cd. The detection limit of 111Cd was 0.1 μg/L.
LA-ICP-MS
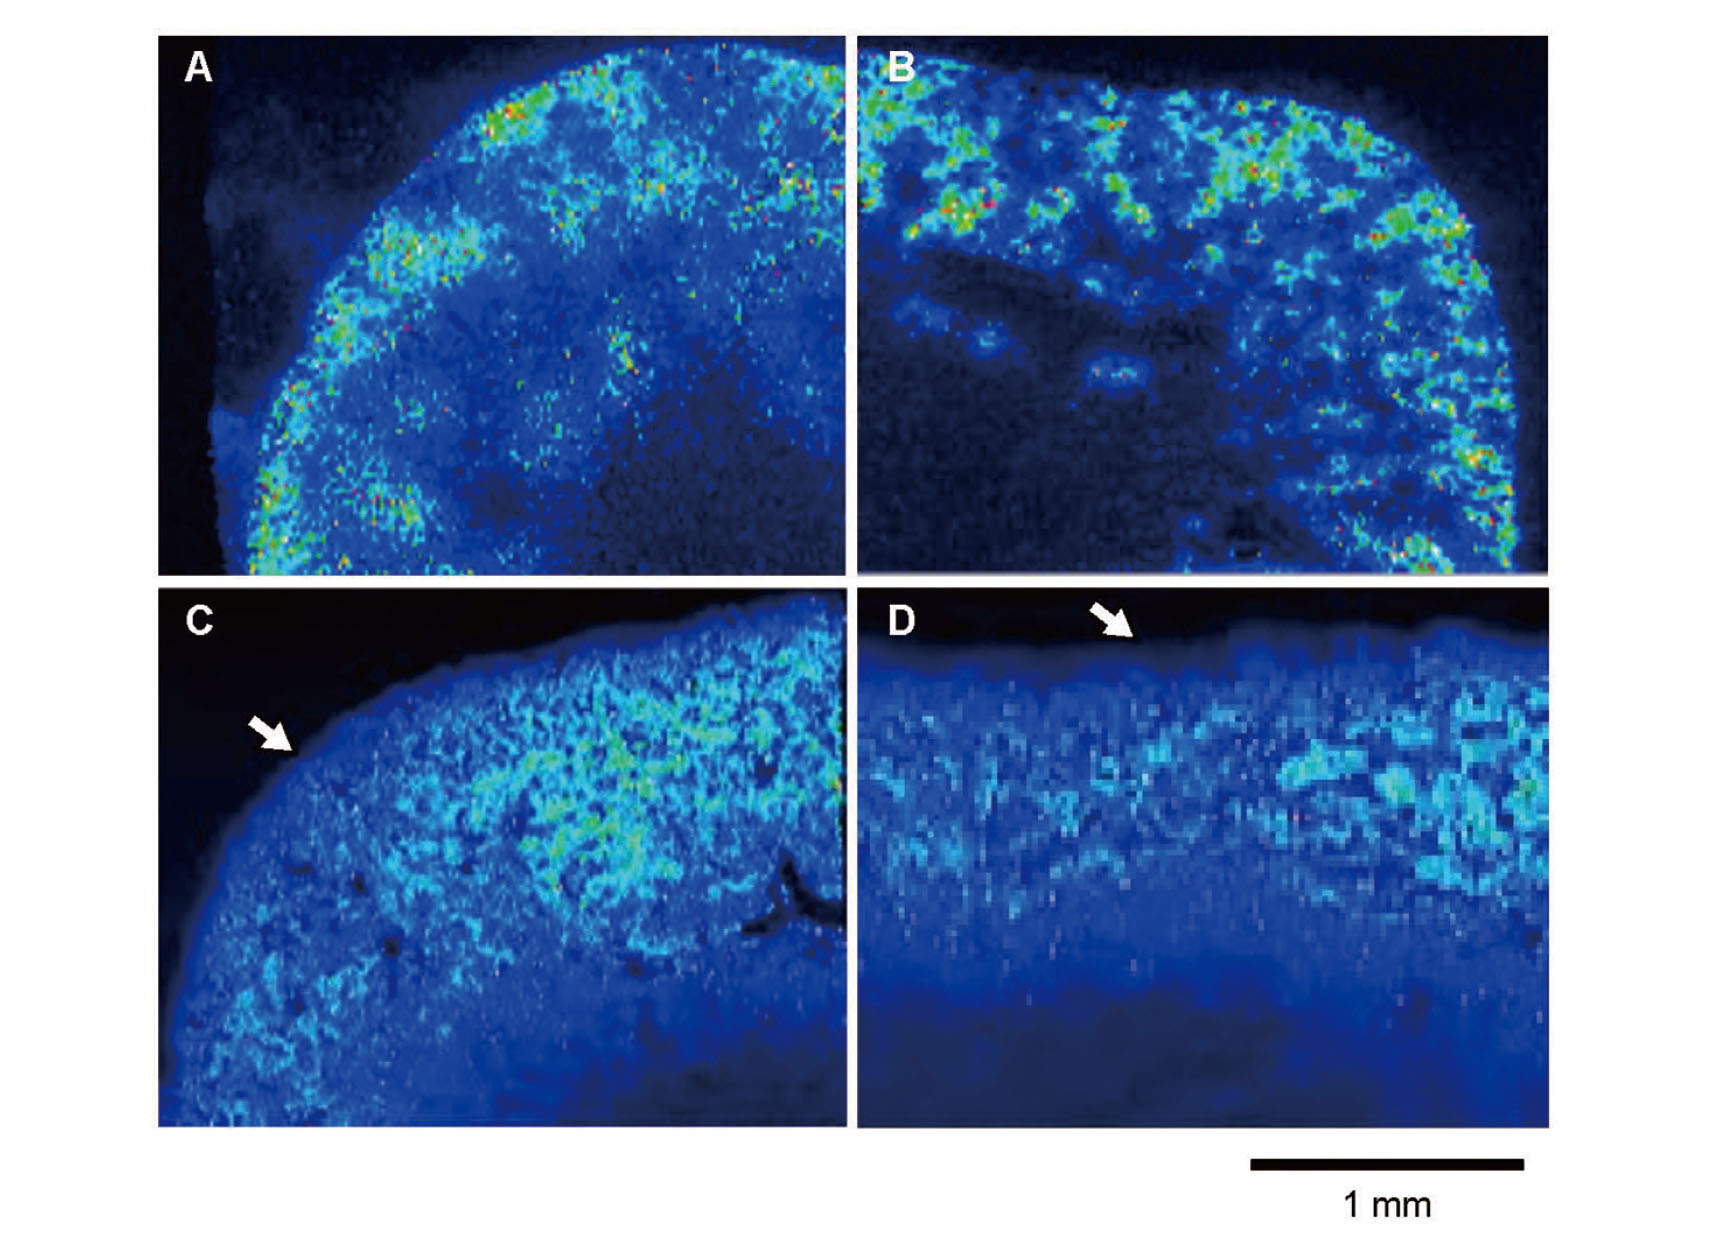
In the first experiment, we prepared serial sections for histology (2 μm) and for LA-ICP-MS (5 μm) using the formalin-fixed, paraffin-embedded specimens of the kidneys to compare the localization of Cd and MT directly between adjacent sections. However, we found that a large part of the Cd in the renal tissues had been lost during the formalin fixation process (Fig. 2). Hence, we used cryostat sections from the frozen tissues for LA-ICP-MS.
We prepared standard sections for Cd to examine the quantitative relationship between the signal intensity obtained by LA-ICP-MS and the Cd concentration in the kidney. Solutions of Milli-Q water containing different concentrations of Cd were added to the O.C.T. compound and mixed gently for 5 min. Portions of the mixtures containing 0.1, 0.5, 1, 5, and 25 μg/g (final concentrations) were packed into plastic histology molds and frozen at –80°C using the same method as that for tissue embedding. The cryostat sections (5 μm) were mounted on glass microscope slides, air-dried, and stored at –80°C.
LA-ICP-MS analysis was conducted using a laser ablation instrument, NWR213 (ESI New Wave Research, USA), coupled to an ICP-MS, Agilent 8800 Triple Quad ICP mass spectrometer (Agilent Technologies, Japan) as described previously (Kubota et al., 2019). The sections of tissues and Cd standard were inserted into the vacuum chamber of NWR213, and 25 × 25-µm squares were ablated sequentially. The distribution of 111Cd was visualized using iQuant2 software (Suzuki et al., 2018).
H&E, PAS, and TUNEL staining
Tissues of the kidneys were fixed in 10% neutral phosphate-buffered formalin, dehydrated in alcohol, and then embedded in paraffin. The 2-µm-thick sections were stained with hematoxylin and eosin (H&E) or with Periodic acid-Schiff stain (PAS). The PAS staining was conducted to identify the brush borders of proximal tubules. Apoptosis was detected by a TUNEL assay using an in situ apoptosis detection kit.
Immunohistochemistry
The 2-µm-thick sections were immunostained using standard immunostaining procedures. Mouse monoclonal antibody against MT (1:100 dilution) and mouse polyclonal antibody against Kim-1 (1:100 dilution) were used. Envision-peroxidase (DAKO, Glostrup, Denmark) for mouse primary antibodies was used for secondary antibodies. 3,3′-diaminobenzidine (DAB) was used as a substrate for peroxidase. The staining was examined with microscopy or an All-in-one Fluorescence Microscope BZ-X700 (Keyence Corporation, Osaka, Japan). Images covering a wide area were generated by combining multiple images using the image joint software BZ-H4A (Keyence Corporation). Positive controls for Kim-1 and TUNEL staining were shown in Supplementary Fig. 1.
Analysis of urinary Kim-1
Urine samples were collected from individual mice placed in a metabolic cage overnight with free access to water and diet after 4 months of Cd exposure. The urinary Kim-1 and creatinine concentrations were determined using a mouse-specific Kim-1 ELISA kit (R&D Systems) and a LabAssay Creatinine kit (FUJIFILM Wako Pure Chemical Corporation).
Real-time RT-PCR for Kim-1 and MT-I
Total RNA was extracted and purified from kidney tissue samples (25 mg) after homogenization using the SV Total RNA Isolation System (Promega, Madison, WI, USA). The reverse transcription (RT) reaction was performed as described previously (Fujishiro et al., 2011). Real-time RT-PCR was performed using a StepOnePlus real-time PCR system (Applied Biosystems, Alameda, CA, USA). The reaction mixture contained 10 μL of 2 x SYBR Premix Ex Taq™ (Takara Bio), 0.4 μL of 50 x ROX Reference Dye, 0.4 μL of 10 μM forward and reverse primers, and 2 μL of RT products. The reaction mixture was initially heated at 95°C for 5 min and then subjected to 40 thermal cycles (95°C for 5 sec and 60°C for 1 min). PCR primers for Kim-1, MT-I, and β-actin (internal control) were purchased from Takara Bio Inc. (Shiga, Japan).
Statistics
One-way ANOVA was performed, followed by a Tukey Multiple Comparison Test using GraphPad Prism 8 software. Differences were considered significant at P < 0.05 and < 0.01 (* and **, respectively).
RESULTS
Tissue Cd accumulation and renal toxicity
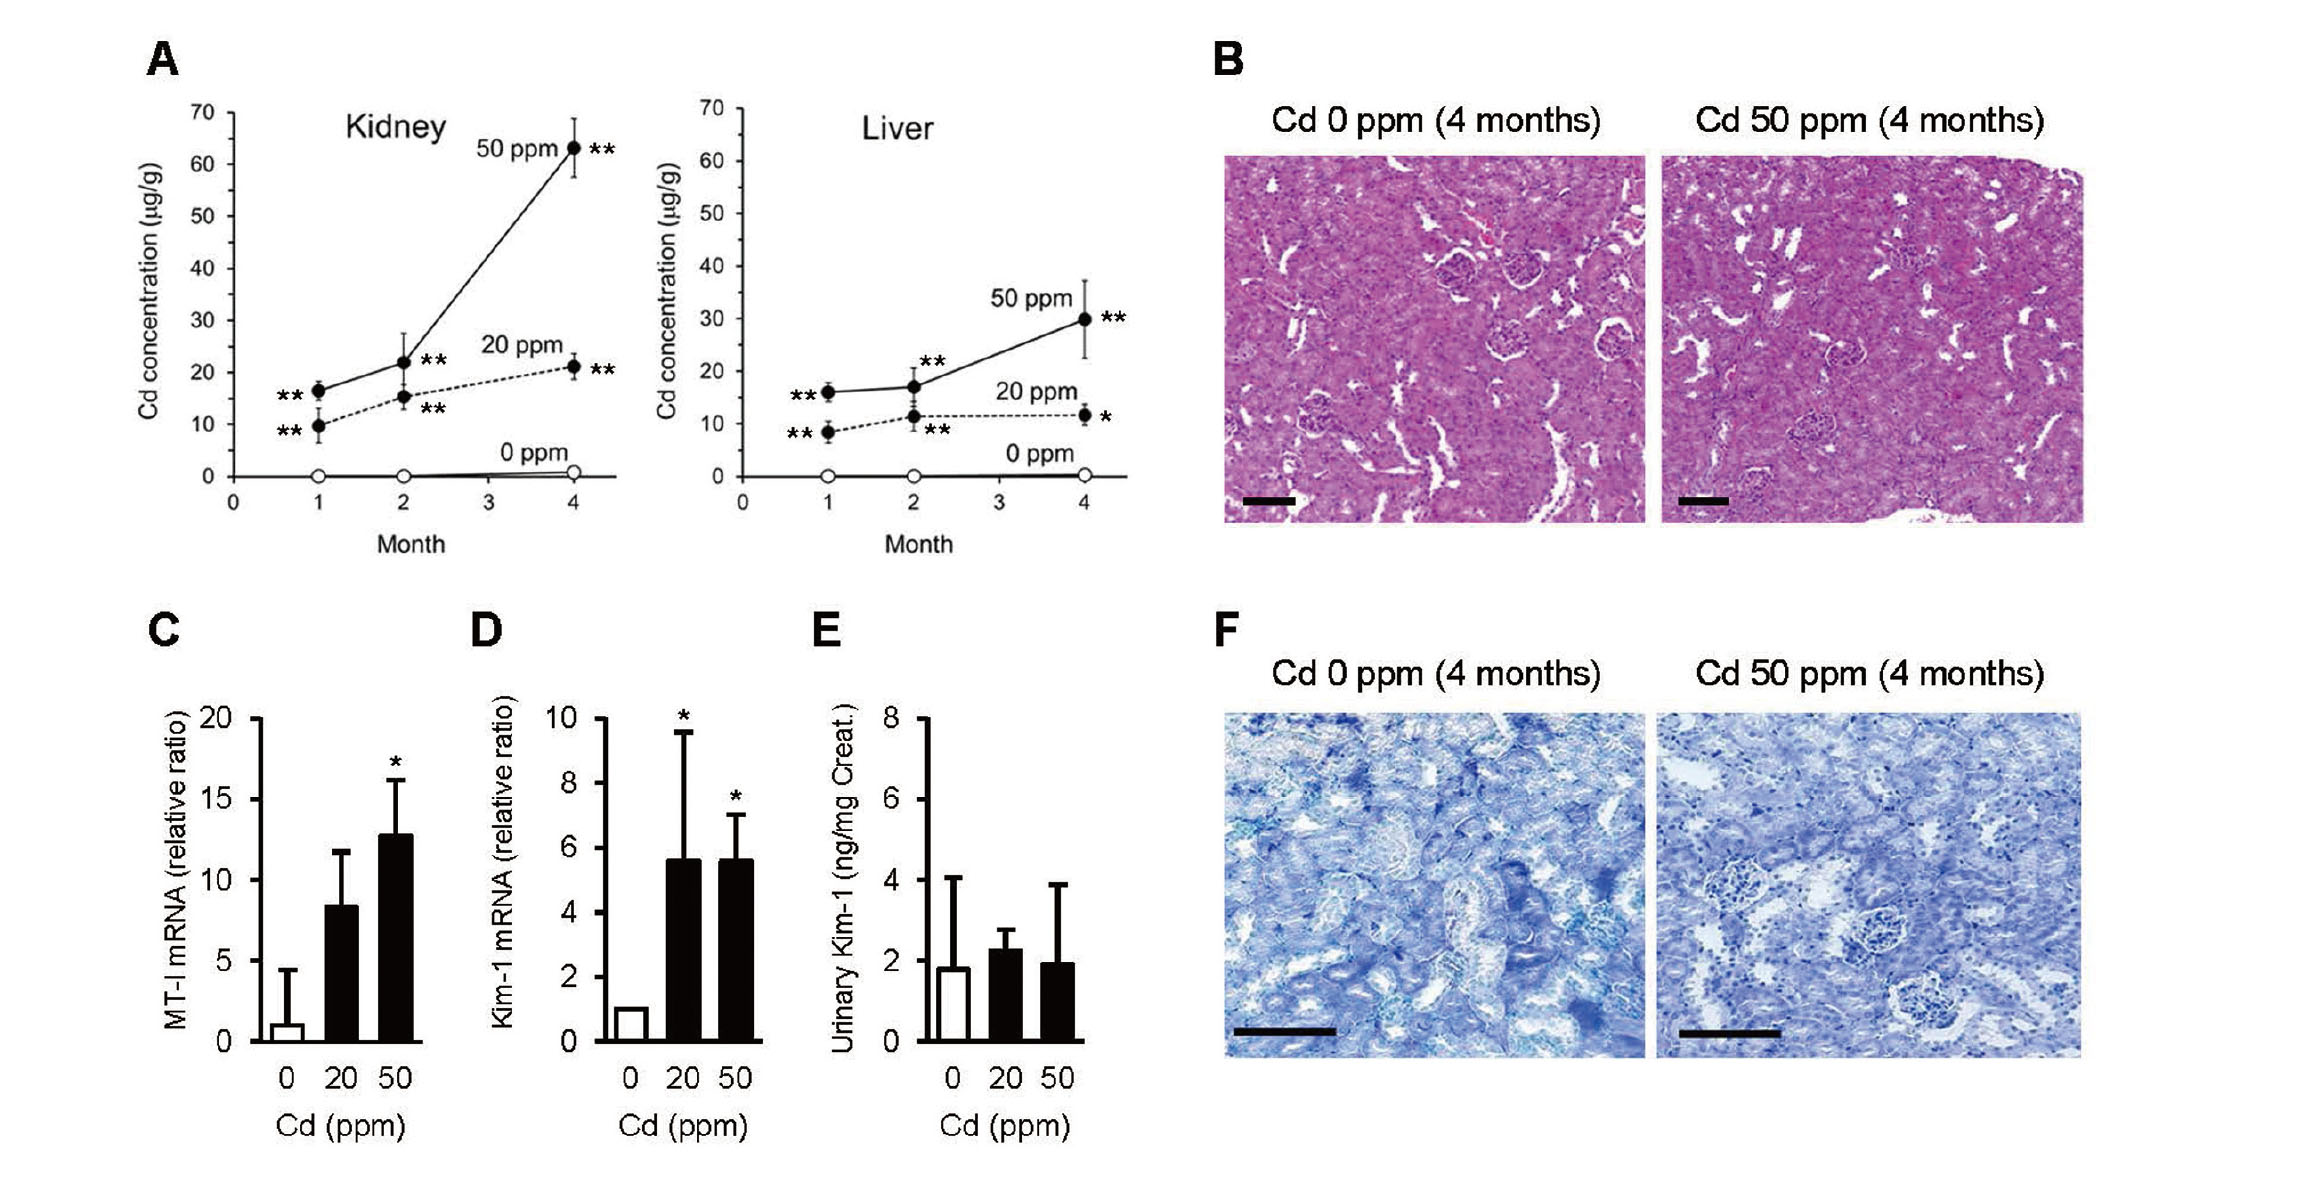
Figure 1A shows time- and dose-dependent increases in Cd concentrations in the liver and kidneys of mice. The mice receiving 50 ppm Cd for 4 months showed the highest renal Cd concentration, reaching 60–70 μg/g. Histological examination by H&E staining (Fig. 1B) and TUNEL staining (Fig. 1F) showed no apparent lesions or apoptotic changes in the kidneys, even in the mice receiving 50 ppm Cd for 4 months. The mRNA levels of MT-I in the kidney at the 4th month were significantly higher in the 20- and 50-ppm group than in the controls (Fig. 1C). The urinary concentrations of Kim-1 did not show significant increases in the 20- or 50-ppm groups at the 4th month compared to the controls (Fig. 1E). The mRNA levels of Kim-1 in the kidney at the 4th month were slightly but significantly higher in the 20- and 50-ppm group than in the controls, but there was no dose-dependency (Fig. 1D). Thus, even the mice showing the highest renal Cd concentration (60–70 μg/g) did not exhibit apparent renal damage, except for a slight increase in Kim-1 mRNA in the kidney.
First, we prepared serial sections from formalin-fixed, paraffin-embedded tissue samples to directly compare the distribution of Cd and MT in renal tissues; the 5-µm-thick sections were subjected to LA-ICP-MS for determination of Cd, and the adjacent 2-µm-thick sections underwent immunohistochemical analysis for MT. Frozen sections were also prepared for comparison. As shown in Figs. 2A and 2B, the frozen sections of the mice receiving 50 ppm Cd for 4 months showed clear signals of Cd in the renal cortex starting from the surface areas. In contrast, the signals of Cd in the formalin-fixed sections were weak and unclear (Figs. 2C and 2D). Notably, the Cd signals in the surface areas were markedly reduced, suggesting that Cd was lost during the formalin fixation process, especially in the surface regions. Consistent with our observation, an early study (Koizumi et al., 1994) showed that Cd in formalin-fixed human kidney tissues was markedly lost, especially in the cortex. Hence, we used half the kidney to prepare frozen sections for LA-ICP-MS and another half for formalin fixation in the subsequent immunohistochemistry experiments. Furthermore, to compare the signal intensities of Cd quantitatively among the groups, we applied the frozen sections of samples and standard together to the chamber of LA-ICP-MS.
Time-dependent changes in Cd distribution in the kidney
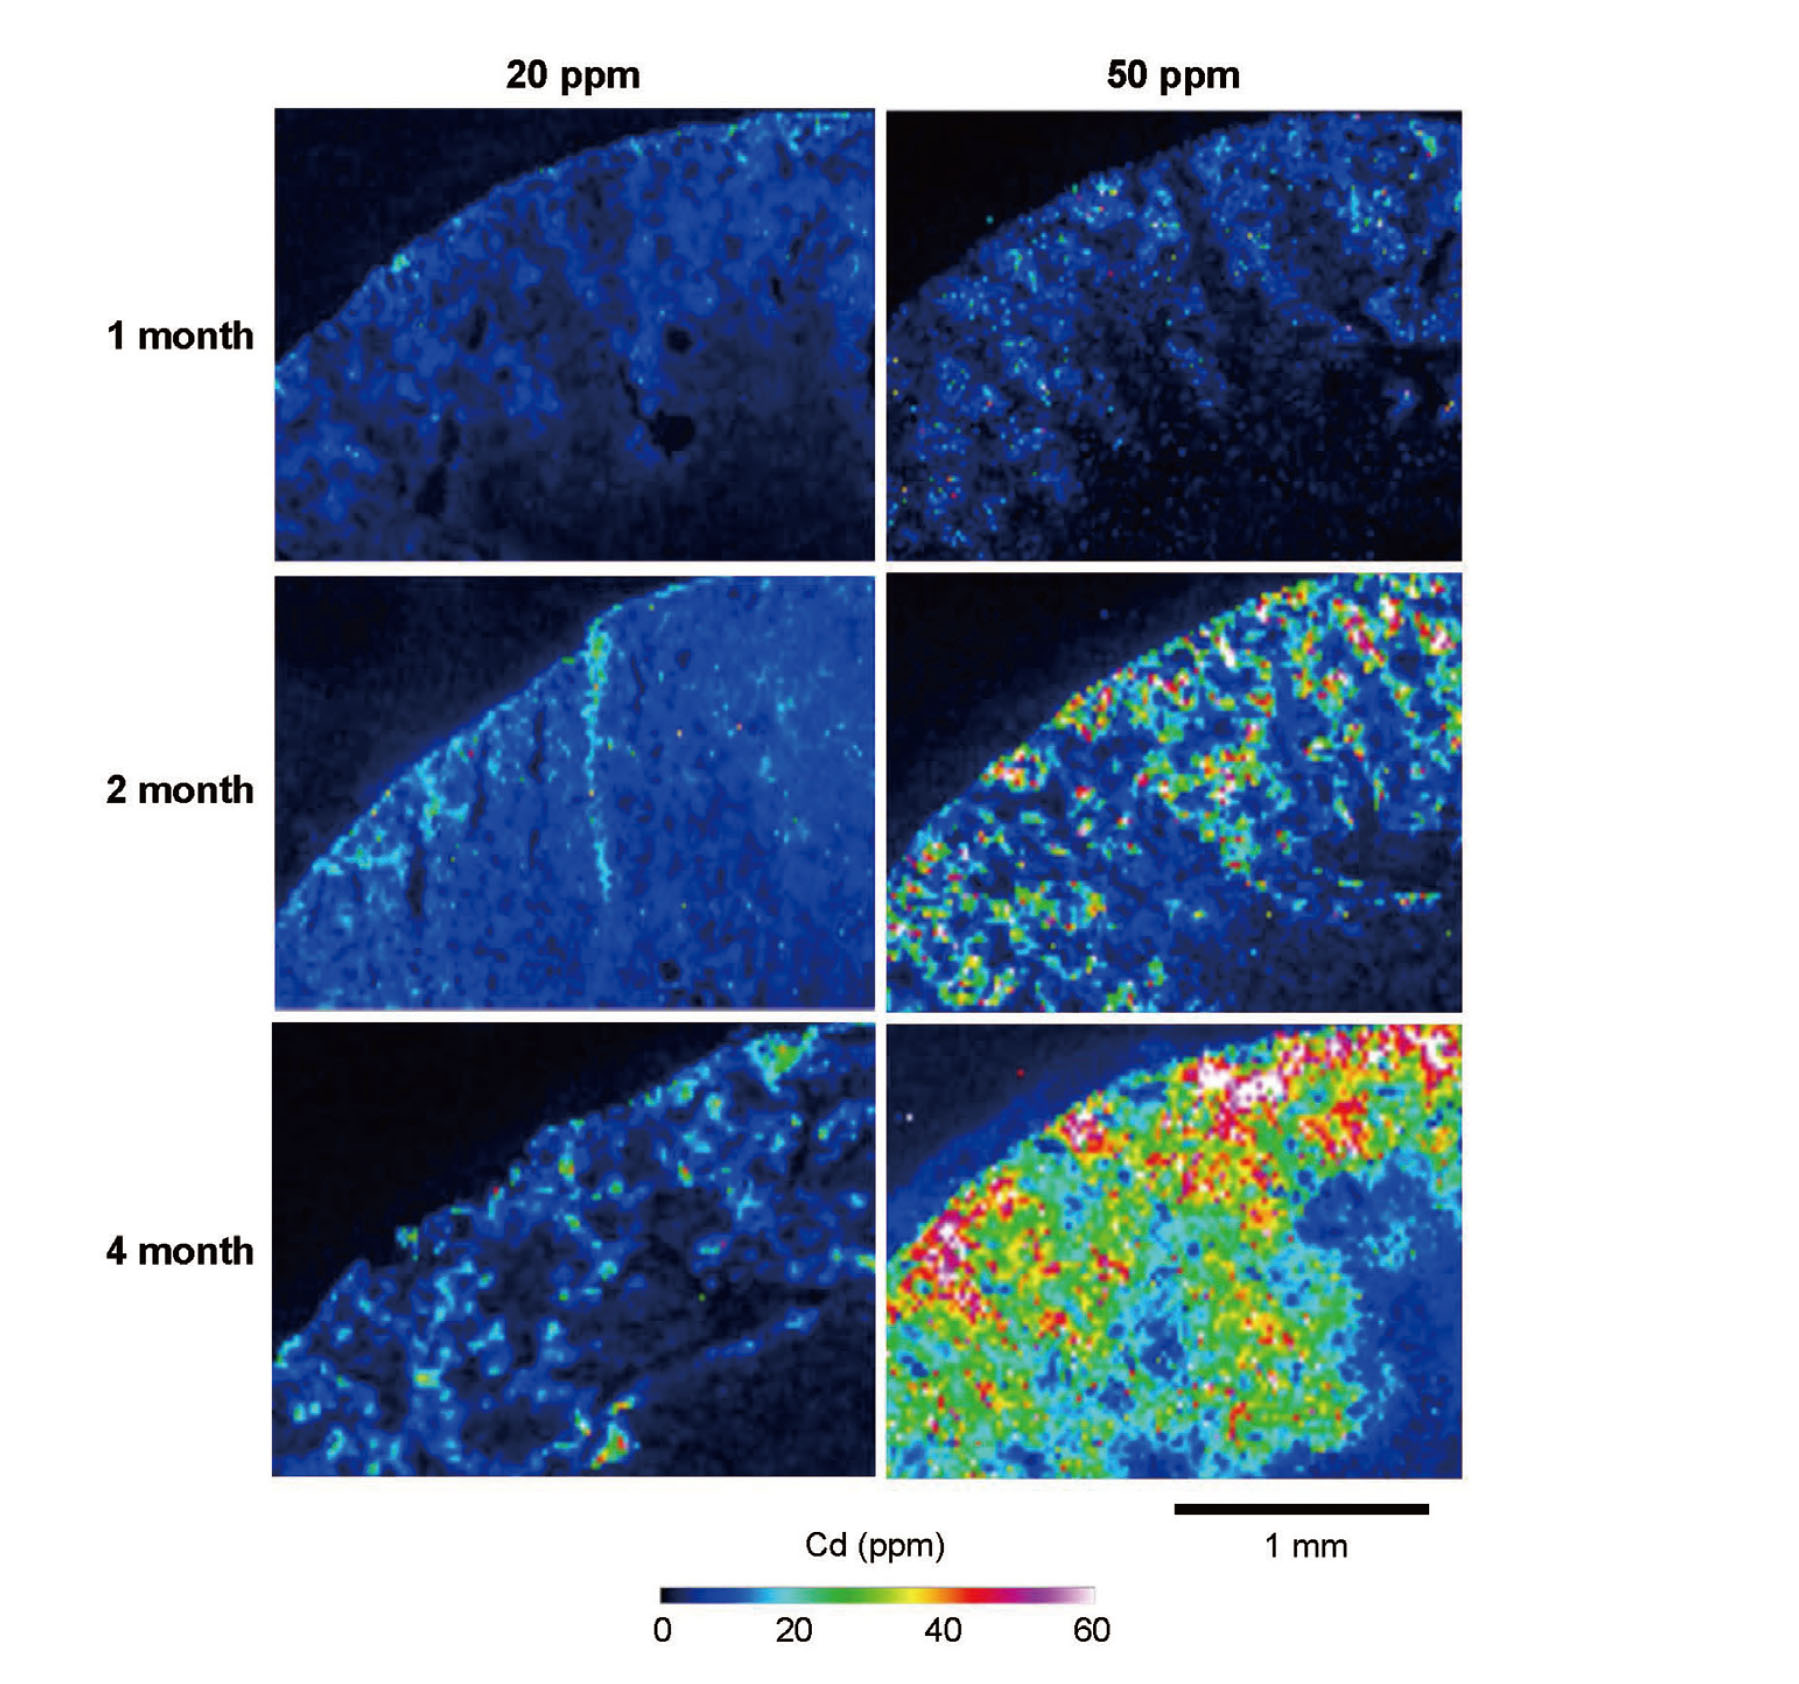
Time-dependent changes in Cd distribution in the kidneys of the 20- and the 50-ppm group were examined by LA-ICP-MS (Fig. 3). Cd signals were detected exclusively in the cortex, and the intensities of the Cd signals increased with time in both 20- and 50-ppm groups. Notably, Cd was not uniformly distributed in the cortex; the areas of strong Cd signals were focally distributed from near the surface to the medulla. Similarly, Fig. 2A and B also showed a heterogeneous distribution of Cd, although quantitative comparisons could not be conducted between the data in Fig. 2 and Fig. 3. These distribution patterns suggest that Cd accumulated mainly in the surface nephrons and that the amounts of accumulated Cd varied from nephron to nephron.
Spatial distribution patterns of MT
Figure 4 shows the distribution patterns of MT in the kidneys at the 1st, 2nd, and 4th months in the 0, 20, and 50 ppm groups. The image-jointing function of BioRevo microscopy enabled us to show the distribution of MT over a wide area from the surface to the medulla without losing resolution. The covered areas were comparable to the pictures of the LA-ICP-MS for Cd distribution. Overall, the levels of MT immunostaining became stronger in a time- and dose-dependent manner. MT also showed heterogeneous distribution patterns, similar to Cd distribution (Fig. 3). Strong expression of MT was frequently detected in the surface areas. The MT expression was the highest in the 50-ppm group after 4 months, but the heterogeneous MT distribution pattern was still maintained.

Figure 5 shows a more detailed localization of MT in the renal cortex. The immunostaining of MT was evident in the proximal tubules but not in the distal tubules (Figs. 5A and 5C). In addition, some proximal tubules showed strong immunoreactivity for MT while others did not. This distinct difference in MT distribution among the proximal tubules may have been caused by the differences in Cd accumulation among the proximal tubules. Thus, the heterogeneous distribution of Cd and MT suggests the differential accumulation of Cd among the nephrons, especially at the early phase of renal Cd accumulation. The MT immunostaining in the outer stripe of the outer medulla, as evidenced by strong PAS staining, was very weak (Fig. 5).
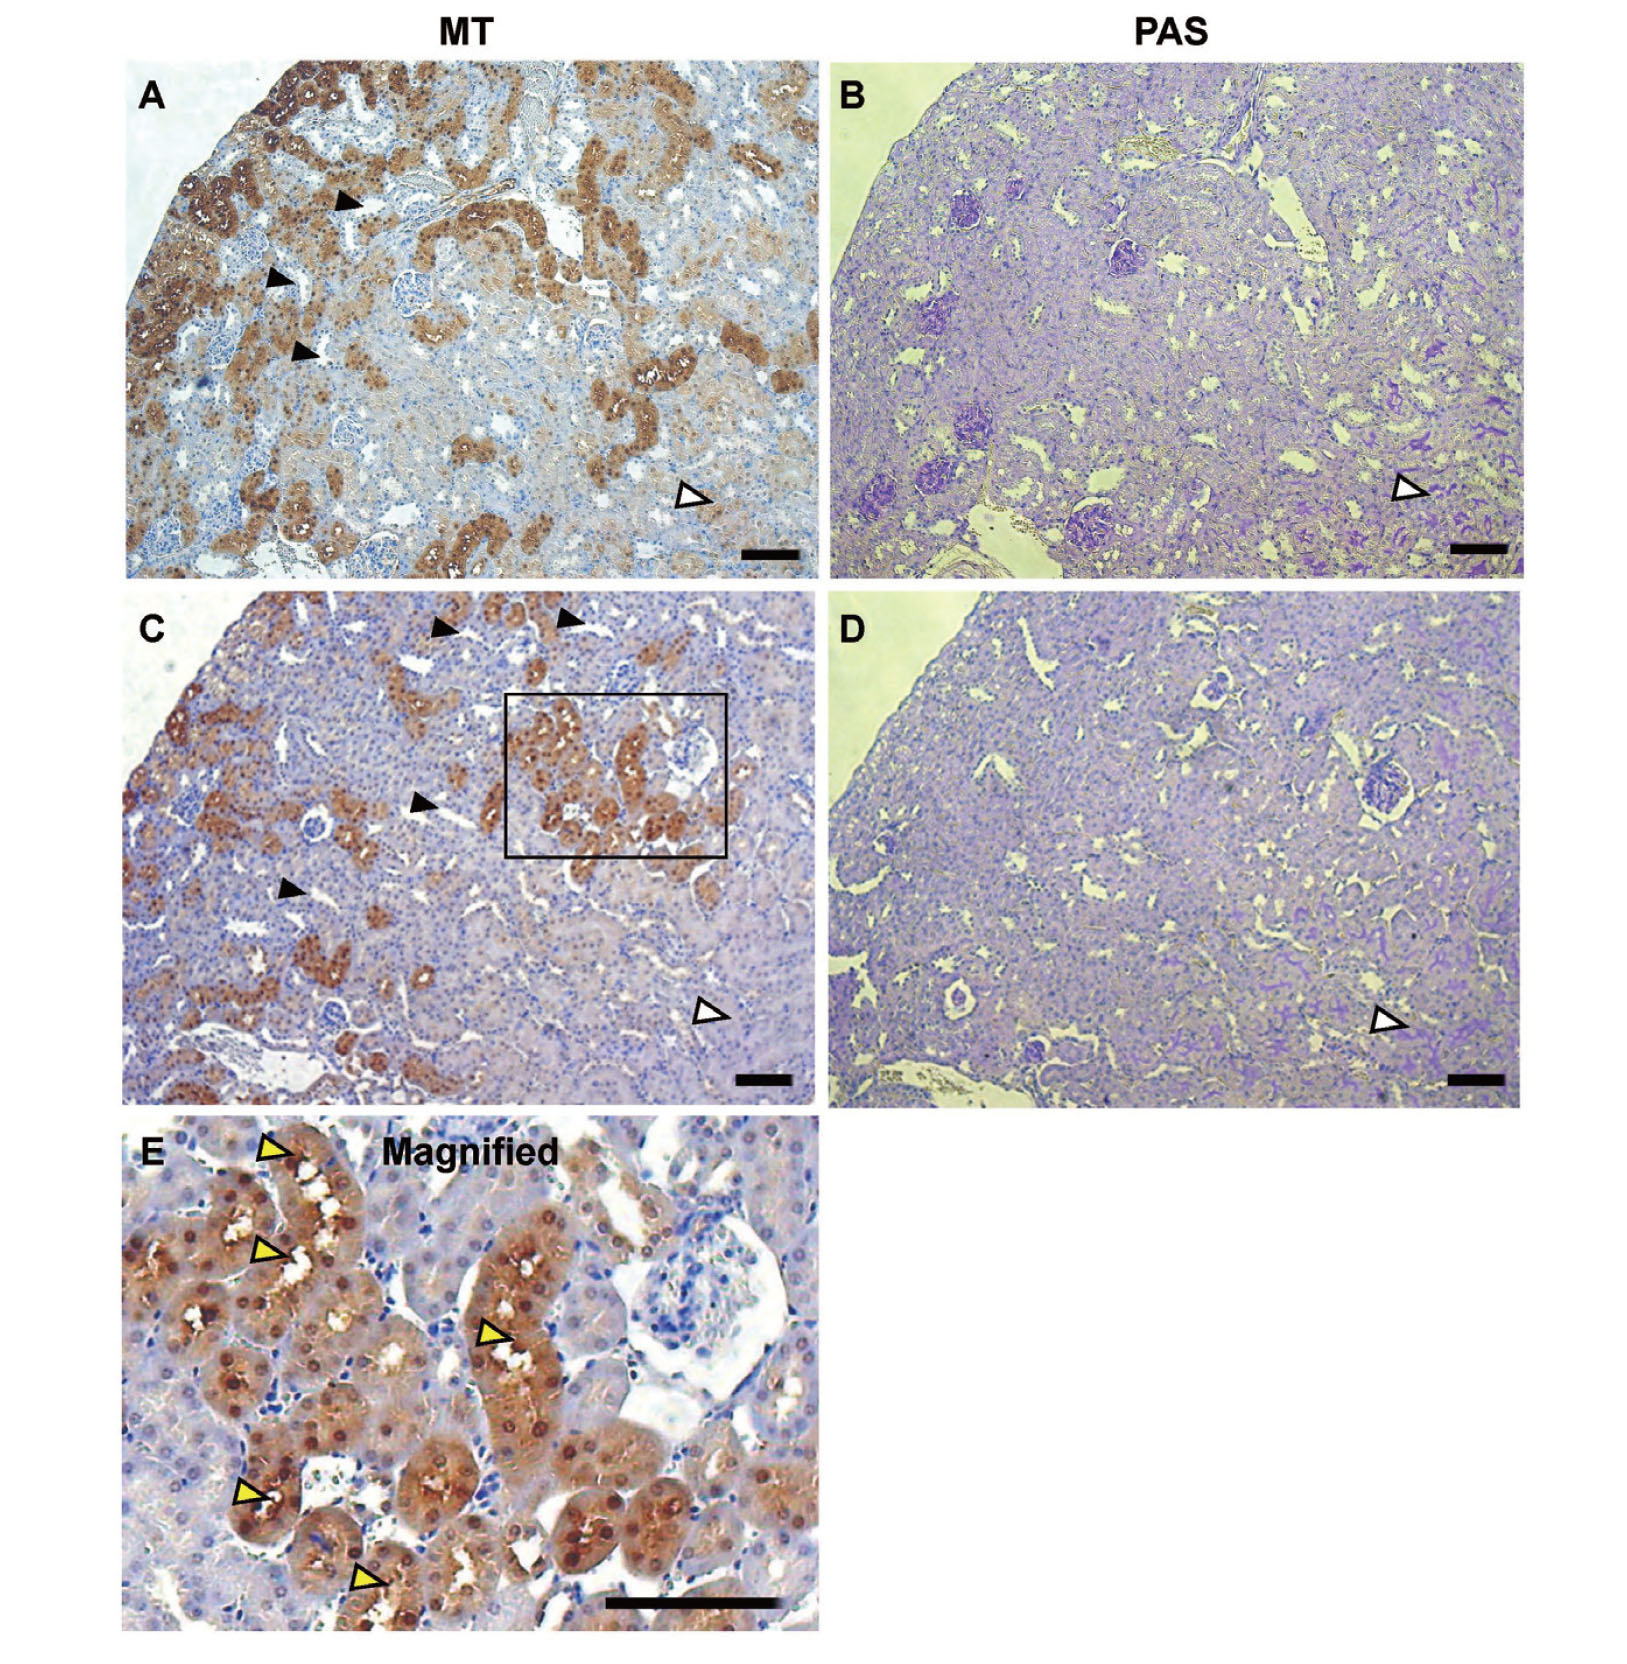
Figure 5E shows the subcellular distribution of MT in the proximal tubules. MT proteins were detected in both the cytosol and nucleus. In some proximal tubules, MT immunostaining was also detected in the surface areas of the luminal side of PTECs, suggesting the localization of MT in the brush borders.
Expression of Kim-1 protein
Since the mRNA levels of Kim-1 increased slightly in the Cd-exposed kidneys (Fig. 1C), we attempted to detect the renal Kim-1 protein by immunohistochemistry. However, little difference in the immunostaining of Kim-1 was found between the 50-ppm and 0-ppm group mice (Figs. 6A and 6B). In serial sections (Figs. 6B, 6C, and 6D), some proximal tubules around the glomerulus showed focal and marked expression of MT (Fig. 6C), indicative of specific Cd accumulation. However, the Kim-1 expression was not elevated in the same regions in the adjacent section (Fig. 6B).
DISCUSSION
In the present study, we examined the distribution of Cd and its binding protein MT in the kidneys of the mice administered Cd for 1, 2, and 4 months via drinking water. We observed approximately the same areas of the kidneys using LA-ICP-MS for Cd and immunohistochemistry for MT. This combination enabled us to examine the dose- and time-dependent changes in the distribution of Cd and MT in the kidney cortex, especially in the early phase of renal Cd accumulation.
It has long been documented that Cd accumulates predominantly in the cortex rather than the medulla of the kidneys (Svartengren et al., 1986). However, no study has used LA-ICP-MS to examine the dose- and time-dependent distribution patterns of Cd in experimental animals. This study confirmed the preferential accumulation of Cd in the cortex and found characteristic Cd distribution patterns within the cortex during the early stage of Cd accumulation. The distribution of Cd detected by LA-ICP-MS exhibited heterogeneous and striated patterns from the cortical surface to the medulla (Figs. 2 and 3). Similarly, MT also showed heterogeneous distribution with striated patterns from the cortical surface to the medulla (Figs. 4 and 5). This heterogeneity could be partly explained by the distinct differences in the MT immunostaining between the proximal tubules and the distal tubules (Fig. 5). In addition, apparent differences in the intensities of MT immunostaining were found even among the proximal tubules (Fig. 5). The overall immunostaining of MT increased gradually up to the 4th month, but the heterogeneity of MT distribution remained intact (Fig. 4).
Previous immunohistochemical studies have also pointed out the heterogeneous MT distribution in the kidneys of rats exposed to Cd (Ljubojević et al., 2019; Nishimura et al., 1989; Sabolić et al., 2018), although the reason remained unclear. The results of our study covering broader areas of the renal cortex suggest that Cd may accumulate more in the surface (cortical) nephrons than the deep (juxtamedullary) nephrons in the cortex. In addition, not all surface nephrons accumulated Cd similarly, especially in the early stages of Cd accumulation. Because the observation period of our study was limited to 4 months of exposure, future studies are needed to clarify whether more prolonged Cd exposure results in a uniform distribution of Cd throughout the cortex or continued heterogeneity of Cd distribution. It is noteworthy that the autopsy of the kidneys of patients with Itai-itai disease, who had been exposed to high concentrations of Cd for a long time, demonstrated that the surface areas of the kidneys were utterly lost (Imura et al., 2019). Further clarification of the Cd distribution within the cortex after prolonged exposure to Cd is warranted.
Our results support the previous notion that Cd accumulates mainly in the S1 and S2 regions of the proximal tubules (Dorian et al., 1992; Nordberg et al., 2021). In the S3 region of proximal tubules, ZIP8, a zinc transporter having affinities for Cd, is highly expressed (Fujishiro et al., 2012). Using cultured S1, S2, and S3 cells, we have demonstrated that the Cd ions released from the S1 and S2 cells into the lumen could be reabsorbed from the luminal side of S3 cells, possibly via ZIP8 (Fujishiro et al., 2019, 2012). The outer stripe of the outer medulla is known to contain abundant S3 region proximal tubules. However, the results of the present study showed no apparent accumulation of MT in the S3 area, at least in the early phase of chronic exposure to Cd. It is likely that the Cd accumulated in the PTECs in the S1 and S2 regions was tightly bound to MT and that only small amounts of Cd were released from these PTECs into the lumen. The lack of positive MT immunostaining in the distal tubules confirmed that the distal tubules play little role in renal Cd accumulation in the early phase, although a recent study has suggested an additional role of the distal tubules in the uptake of Cd-MT when the endocytic functions of the proximal tubules are heavily damaged by the other renal toxicant gentamicin (Gu et al., 2020).
LA-ICP-MS has also been used for studying the localization of metals such as Hg and Pt (Egger et al., 2014; Iwase et al., 2021; Legin et al., 2016; Liu et al., 2021; Moreno-Gordaliza et al., 2011). The administration of inorganic Hg or cisplatin to mice also resulted in fairly heterogeneous distributions of Hg or Pt in the renal cortex. However, the heterogenicity of their distribution was not as pronounced as that of Cd observed in the present study. Cisplatin is mainly taken up from the vascular side of PTECs rather than reabsorbed from the luminal side (Ciarimboli et al., 2005). In contrast, Cd-MT is primarily taken up by endocytosis from the luminal side of PTECs. Hence, Cd accumulates specifically in the S1 and S2 regions of the proximal tubules that have higher endocytic activities, resulting in a markedly uneven distribution of Cd.
Previous studies have detected MT in both the cytoplasm and the nucleus of renal cells in animals exposed to Cd (Banerjee et al., 1982; Nishimura et al., 1989; Svartengren et al., 1986). We found that MT was located in both the cytoplasm and the nucleus in the kidneys of mice exposed to Cd (Fig. 5). Furthermore, we also detected MT in the microvilli of some proximal tubules. The possibility of an edge effect in immunostaining cannot be ruled out. However, several studies have also observed that MT was localized on the luminal side cell surface of the kidney proximal tubules of rats exposed to Cd, although the role of this MT remained unclear (Nishimura et al., 1989; Sabolić et al., 2018).
Although no apparent renal damage was detected by H&E staining, we found slight increases in the mRNA levels of Kim-1 in the kidneys of mice exposed to 50 ppm Cd for 4 months (Fig. 1). Several studies have shown that chronic exposure of rats or mice to Cd causes sporadic Kim-1 immunostaining in the kidney (Gu et al., 2020; Prozialeck et al., 2007; Santoyo-Sánchez et al., 2013). However, it remains unclear whether the renal cells that show positive Kim-1 immunoreactivity have high levels of Cd deposition or MT induction. To examine whether the expression of Kim-1 is enhanced at least in the proximal tubules showing positive MT immunostaining, we compared the Kim-1 and MT immunostaining between adjacent sections (Fig. 6). However, there was no co-localization of MT and Kim-1. The expression of Kim-1 is primarily induced by acute renal injury (Griffin et al., 2019), and the amounts of the induced MT may be sufficient to suppress Cd toxicity at the levels of the Cd accumulation (60–70 μg at most) in this study. Further studies are needed to clarify the relationship between Cd accumulation in individual renal cells and the expression of the cell injury markers.
In conclusion, this study demonstrated that Cd accumulates and induces MT synthesis in the proximal tubules of particular nephrons, especially surface neurons, during the initial process of renal Cd accumulation. Future studies are warranted to clarify whether this heterogeneous distribution persists after prolonged exposure to Cd and whether the higher distribution of Cd in the cortical surface is related to the vulnerability of the kidney surface to Cd toxicity observed in humans.
Fundings
This work was partly supported by JSPS KAKENHI Grant Numbers 19H05770 (H.F.) and 19H01081 (H.F., T.M., K.Y., and S.H.) and by the Study of Health Effects of Heavy Metals organized by Ministry of the Environment, Japan (H.F. and S.H.).
Conflict of interest
The authors declare that there is no conflict of interest.
REFERENCES
- Baba, H., Tsuneyama, K., Kumada, T., Aoshima, K. and Imura, J. (2014): Histopathological analysis for osteomalacia and tubulopathy in itai-itai disease. J. Toxicol. Sci., 39, 91-96.
- Banerjee, D., Onosaka, S. and Cherian, M.G. (1982): Immunohistochemical localization of metallothionein in cell nucleus and cytoplasm of rat liver and kidney. Toxicology, 24, 95-105.
- Becker, J.S., Matusch, A. and Wu, B. (2014): Bioimaging mass spectrometry of trace elements - recent advance and applications of LA-ICP-MS: A review. Anal. Chim. Acta, 835, 1-18.
- Brzóska, M.M. and Moniuszko-Jakoniuk, J. (2005a): Disorders in bone metabolism of female rats chronically exposed to cadmium. Toxicol. Appl. Pharmacol., 202, 68-83.
- Brzóska, M.M. and Moniuszko-Jakoniuk, J. (2005b): Bone metabolism of male rats chronically exposed to cadmium. Toxicol. Appl. Pharmacol., 207, 195-211.
- Ciarimboli, G., Ludwig, T., Lang, D., Pavenstädt, H., Koepsell, H., Piechota, H.J., Haier, J., Jaehde, U., Zisowsky, J. and Schlatter, E. (2005): Cisplatin nephrotoxicity is critically mediated via the human organic cation transporter 2. Am. J. Pathol., 167, 1477-1484.
- Danielson, K.G., Ohi, S. and Huang, P.C. (1982): Immunochemical localization of metallothionein in rat liver and kidney. J. Histochem. Cytochem., 30, 1033-1039.
- Dorian, C., Gattone, V.H. 2nd and Klaasen, C.D. (1992): Renal cadmium deposition and injury as a result of accumulation of cadmium-metallothionein (CdMT) by the proximal convoluted tubules--A light microscopic autoradiography study with 109CdMT. Toxicol. Appl. Pharmacol., 114, 173-181.
- Egger, A.E., Theiner, S., Kornauth, C., Heffeter, P., Berger, W., Keppler, B.K. and Hartinger, C.G. (2014): Quantitative bioimaging by LA-ICP-MS: a methodological study on the distribution of Pt and Ru in viscera originating from cisplatin- and KP1339-treated mice. Metallomics, 6, 1616-1625.
- Fujishiro, H., Doi, M., Enomoto, S. and Himeno, S. (2011): High sensitivity of RBL-2H3 cells to cadmium and manganese: an implication of the role of ZIP8. Metallomics, 3, 710-718.
- Fujishiro, H., Hamao, S., Isawa, M. and Himeno, S. (2019): Segment-specific and direction-dependent transport of cadmium and manganese in immortalized S1, S2, and S3 cells derived from mouse kidney proximal tubules. J. Toxicol. Sci., 44, 611-619.
- Fujishiro, H., Yano, Y., Takada, Y., Tanihara, M. and Himeno, S. (2012): Roles of ZIP8, ZIP14, and DMT1 in transport of cadmium and manganese in mouse kidney proximal tubule cells. Metallomics, 4, 700-708.
- Griffin, B.R., Faubel, S. and Edelstein, C.L. (2019): Biomarkers of Drug-Induced Kidney Toxicity. Ther. Drug Monit., 41, 213-226.
- Gu, J., Ren, Z., Zhao, J., Peprah, F.A., Xie, Y., Cheng, D., Wang, Y., Liu, H., Chu Wong, C.K., Zhou, Y. and Shi, H. (2020): Calcimimetic compound NPS R-467 protects against chronic cadmium-induced mouse kidney injury by restoring autophagy process. Ecotoxicol. Environ. Saf., 189, 110052.
- Himeno, S. and Aoshima, K. (eds.). (2019): Cadmium Toxicity - New Aspects in Human Disease, Rice Contamination, and Cytotoxicity. Springer, Singapore.
- Ichimura, T., Hung, C.C., Yang, S.A., Stevens, J.L. and Bonventre, J.V. (2004): Kidney injury molecule-1: a tissue and urinary biomarker for nephrotoxicant-induced renal injury. Am. J. Physiol. Renal Physiol., 286, F552-F563.
- Imura, J., Tsuneyama, K. and Ueda, Y. (2019): Novel Pathological Study of Cadmium Nephropathy of Itai-itai Disease. In: Cadmium Toxicity - New Aspects in Human Disease, Rice Contamination, and Cytotoxicity (Himeno, S., Aoshima, K. eds.), pp. 39-50. Springer, Singapore.
- Iwase, M., Tanaka, Y.K., Suzuki, N. and Ogra, Y. (2021): Determination of spatial mercury concentration by laser ablation-inductively coupled plasma mass spectrometry. J. Toxicol. Sci., 46, 193-198.
- Klaassen, C.D., Liu, J. and Diwan, B.A. (2009): Metallothionein protection of cadmium toxicity. Toxicol. Appl. Pharmacol., 238, 215-220.
- Koizumi, N., Hatayama, F. and Sumino, K. (1994): Problems in the analysis of cadmium in autopsied tissues. Environ. Res., 64, 192-198.
- Kubota, A., Matsukawa, T., Yanagie, H., Yanagawa, M., Hirata, T., Shinohara, A. and Yokoyama, K. (2019): Quantitative bio-imaging of gadolinium-157 in tissues through laser-ablation ICP-MS for neutron capture therapy. Juntendo Med. J., 65, 461-467.
- Legin, A.A., Theiner, S., Schintlmeister, A., Reipert, S., Heffeter, P., Jakupec, M.A., Mayr, J., Varbanov, H.P., Kowol, C.R., Galanski, M., Berger, W., Wagner, M. and Keppler, B.K. (2016): Multi-scale imaging of anticancer platinum(iv) compounds in murine tumor and kidney. Chem. Sci. (Camb.), 7, 3052-3061.
- Liu, J., Cui, J., Wei, X., Li, W., Liu, C., Li, X., Chen, M., Fan, Y. and Wang, J. (2021): Investigation on selenium and mercury interactions and the distribution patterns in mice organs with LA-ICP-MS imaging. Anal. Chim. Acta, 1182, 338941.
- Ljubojević, M., Orct, T., Micek, V., Karaica, D., Jurasović, J., Breljak, D., Madunić, I.V., Rašić, D., Jovanović, I.N., Peraica, M., Gerić, M., Gajski, G., Oguić, S.K., Rogić, D., Nanić, L., Rubelj, I. and Sabolić, I. (2019): Sex-dependent expression of metallothioneins MT1 and MT2 and concentrations of trace elements in rat liver and kidney tissues: effect of gonadectomy. J. Trace Elem. Med. Biol., 53, 98-108.
- Moreno-Gordaliza, E., Giesen, C., Lázaro, A., Esteban-Fernández, D., Humanes, B., Cañas, B., Panne, U., Tejedor, A., Jakubowski, N. and Gómez-Gómez, M.M. (2011): Elemental bioimaging in kidney by LA-ICP-MS as a tool to study nephrotoxicity and renal protective strategies in cisplatin therapies. Anal. Chem., 83, 7933-7940.
- Nishimura, H., Nishimura, N. and Tohyama, C. (1989): Immunohistochemical localization of metallothionein in developing rat tissues. J. Histochem. Cytochem., 37, 715-722.
- Nordberg, G.F., Agneta, A., Nogawa, K. and Nordberg, M. (2021): Cadmium. In: Handbook on the Toxicology of Metals, Fifth Edition, Volume II: Specific Metals (Nordberg, G.F. and Costa, M. eds.), p. 141-196, Academic Press, London.
- Onodera, A., Tani, M., Michigami, T., Yamagata, M., Min, K.S., Tanaka, K., Nakanishi, T., Kimura, T. and Itoh, N. (2012): Role of megalin and the soluble form of its ligand RAP in Cd-metallothionein endocytosis and Cd-metallothionein-induced nephrotoxicity in vivo. Toxicol. Lett., 212, 91-96.
- Prozialeck, W.C., Vaidya, V.S., Liu, J., Waalkes, M.P., Edwards, J.R., Lamar, P.C., Bernard, A.M., Dumont, X. and Bonventre, J.V. (2007): Kidney injury molecule-1 is an early biomarker of cadmium nephrotoxicity. Kidney Int., 72, 985-993.
- Qin, Z., Caruso, J.A., Lai, B., Matusch, A. and Becker, J.S. (2011): Trace metal imaging with high spatial resolution: applications in biomedicine. Metallomics, 3, 28-37.
- Sabolić, I., Breljak, D., Škarica, M. and Herak-Kramberger, C.M. (2010): Role of metallothionein in cadmium traffic and toxicity in kidneys and other mammalian organs. Biometals, 23, 897-926.
- Sabolić, I., Škarica, M., Ljubojević, M., Breljak, D., Herak-Kramberger, C.M., Crljen, V. and Ljubešić, N. (2018): Expression and immunolocalization of metallothioneins MT1, MT2 and MT3 in rat nephron. J. Trace Elem. Med. Biol., 46, 62-75.
- Santoyo-Sánchez, M.P., Pedraza-Chaverri, J., Molina-Jijón, E., Arreola-Mendoza, L., Rodríguez-Muñoz, R. and Barbier, O.C. (2013): Impaired endocytosis in proximal tubule from subchronic exposure to cadmium involves angiotensin II type 1 and cubilin receptors. BMC Nephrol., 14, 211.
- Svartengren, M., Elinder, C.G., Friberg, L. and Lind, B. (1986): Distribution and concentration of cadmium in human kidney. Environ. Res., 39, 1-7.
- Suzuki, T., Sakata, S., Makino, Y., Obayashi, H., Ohara, S., Hattori, K. and Hirata, T. (2018): iQuant2: software for rapid and quantitative imaging using laser ablation-ICP mass spectrometry. Mass Spectrom. (Tokyo), 7, A0065-A0065.
- Torimoto, R., Ishii, C., Sato, H., Saito, K., Watanabe, Y., Ogasawara, K., Kubota, A., Matsukawa, T., Yokoyama, K., Kobayashi, A., Kimura, T., Nakayama, S.M., Ikenaka, Y. and Ishizuka, M. (2021): Analysis of lead distribution in avian organs by LA-ICP-MS: study of experimentally lead-exposed ducks and kites. Environ. Pollut., 283, 117086.
- Vesey, D.A. (2010): Transport pathways for cadmium in the intestine and kidney proximal tubule: focus on the interaction with essential metals. Toxicol. Lett., 198, 13-19.
- Zalups, R.K., Joshee, L. and Bridges, C.C. (2014): Novel Hg2+-induced nephropathy in rats and mice lacking Mrp2: evidence of axial heterogeneity in the handling of Hg2+ along the proximal tubule. Toxicol. Sci., 142, 250-260.
- Zhang, J., Brown, R.P., Shaw, M., Vaidya, V.S., Zhou, Y., Espandiari, P., Sadrieh, N., Stratmeyer, M., Keenan, J., Kilty, C.G., Bonventre, J.V. and Goering, P.L. (2008): Immunolocalization of Kim-1, RPA-1, and RPA-2 in kidney of gentamicin-, mercury-, or chromium-treated rats: relationship to renal distributions of iNOS and nitrotyrosine. Toxicol. Pathol., 36, 397-409.
- Zhou, Y., Vaidya, V.S., Brown, R.P., Zhang, J., Rosenzweig, B.A., Thompson, K.L., Miller, T.J., Bonventre, J.V. and Goering, P.L. (2008): Comparison of kidney injury molecule-1 and other nephrotoxicity biomarkers in urine and kidney following acute exposure to gentamicin, mercury, and chromium. Toxicol. Sci., 101, 159-170.