Letter
Involvement of Npas2 and Per2 modifications in zinc-induced acute diurnal toxicity in mice
2022 年 47 巻 12 号 p. 547-553
詳細
2022 年 47 巻 12 号 p. 547-553
Zinc (Zn) is one of the most essential trace elements in the body and an integral part of many enzyme systems. Zn deficiency is characterized by growth retardation, loss of appetite, and impaired immune function. In contrast, Zn overdoses can be associated with liver, kidney, and stomach damage. We focused on the “chronotoxicity,” or the relationship between injection time and severity of chemical toxicity. The aim of this study was to investigate the chronotoxicity of Zn and the in vivo factors involved. Seven-week-old male ICR mice were administered Zn at six different time points per day (zeitgeber time [ZT]: ZT2, ZT6, ZT10, ZT14, ZT18, and ZT22). Mortality was monitored for 7-days after administration. The mice were tolerant to Zn administered at ZT2 and ZT6, and were highly sensitive at ZT14 and ZT18. Furthermore, when mice were administered a non-lethal dose of Zn, the levels of hepatic injury indicators (AST and ALT) were much higher at ZT14 than at ZT2. To explore the mechanism of Zn-induced diurnal hepatotoxicity, we performed an in vitro experiment, focusing on the clock genes. We found that Zn downregulated the expression levels of several clock genes, neuronal PAS domain protein 2 (Npas2) and Peroid2 (Per2), in Hepa1-6 cells. Interestingly, overexpression of both Npas2 and Per2 restored Zn-induced toxicity in Hepa1-6 cells. Since NPAS2 and PER2 are known to modulate the hepatic injury induced by carbon tetrachrolide or acetaminophen, our results suggest that Zn-induced diurnal toxicity may be associated with modulation of Npas2 and Per2 gene expression.
Zinc (Zn) is an essential trace element found in many human enzymes and transcription factors. Currently, more than 300 enzymes require Zn for their activation, and nearly 2,000 transcription factors require Zn to exert their function (Maret, 2013; McCall et al., 2000). Zn ion is an essential cofactor for the observed biological functions of these metalloenzymes. Zn is observed in many tissues, and is involved in many biological factors, such as Zn-finger protein. Furthermore, Zn has been prescribed to treat Wilson disease and atopic dermatitis (Linn et al., 2009; Sugiura et al., 2005). Zn is widely present in foods, with the highest levels found in shellfish and red meat. The recommended dietary allowances is 10 mg for men and 8 mg for women per day. Zn deficiency is typically caused by malnutrition and reduced dietary intake. In animals, several symptoms such as growth failure, loss of hair, thickening and hyperkeratinization of the epidermis, and testicular atrophy have been reported (Golub et al., 1995; Hagmeyer et al., 2015). However, Zn overdoses have also been reported and can be associated with liver injury, renal toxicity, and abnormal sperm motility (Abban et al., 2003; Agnew and Slesinger, 2022; Turgut et al., 2003).
We focused on the “chronotoxicity,” or the relationship between injection time and severity of chemical toxicity. We previously demonstrated that Cd-induced diurnal hepatic toxicity was drastically different, where Cd showed no toxic effect when injected during the night (2:00), while fulminant hepatitis was induced during light-phase injection (14:00) (Miura et al., 2013; Miura et al., 2017). We have additionally evaluated the chronotoxicological profiles of seven metals (Hg, Pb, Ni, Cr, Cu, Zn, and Fe) (Yoshioka et al., 2018). We found that mice were tolerant against Cr toxicity during light phase, and were tolerant against Ni toxicity during dark phase. The pattern of toxicity of Hg and Pb appears to be biphasic. The mice were susceptible to Cu and Zn toxicity in the time zone when light period and dark period switched. Compared with Cd chronotoxicity, less information is available regarding the other seven metals as we only tested for the lethal toxicity (Yoshioka et al., 2018). Therefore, providing further information is important to elucidate chronotoxicity related to metal exposure. In the present study, we examined the diurnal variation in Zn-induced acute hepatic toxicity, and searched for biological factors involved in this chronotoxicity in mice.
Male ICR mice were purchased from Japan SLC Inc. (Shizuoka, Japan) and maintained under standard conditions of 24 ± 1°C, 55 ± 5% humidity, and 12:12 hr light (8:00–20:00)/dark cycles (20:00–8:00), with free access to water and food. Experimental treatments were performed on 7-week-old mice. At the end of the experiment, surviving mice were euthanized using carbon dioxide gas. All experiments were approved by the Institutional Animal Care and Experiment Committee of Kinjo Gakuin University (No. 130) and the Gifu University of Medical Science (2022-07).
Experimental protocol in non-lethal toxicity testSeven-week-old male ICR mice (4–6 mice) were i.p. injected with 32.3 mg (235.2 μmol Zn)/kg ZnCl2 (Fujifim Wako Pure Chemical, Osaka, Japan) at ZT2 (10:00) or ZT14 (22:00). Control mice received the same volume of saline, as described above. Animals were euthanized using carbon dioxide gas, and their plasma and liver samples were collected at 3, 6, 12, or 24 hr post-injection. The obtained samples were stored at −80°C.
Plasma biochemical analysisPlasma alanine aminotransferase (ALT) and aspartate aminotransferase (AST) activities were measured using the Transaminase CII Test (Fujifim Wako Pure Chemical) according to the manufacturer’s instructions. For relative quantification, calibration curves were prepared using the standard solutions.
Determination of liver zinc concentrationsIndividual liver specimens (0.2–0.3 g each) were placed in 0.5 mL concentrated nitric acid in glass test tubes. The temperature was maintained at 80°C for 1 hr, then gradually increased (at 10°C per hr) to 130°C. When the acid-treated specimens became transparent, their volume was increased to 5 mL with distilled water, and zinc concentrations were determined by atomic absorption using Z-2300 (Hitachi, Tokyo, Japan).
Determination of metallothionein (MT) levels in the liverHepatic MT protein levels were determined using the Cd saturation-hemolysate method (Cd-hem method). Liver and kidney tissues were homogenized with 5 volumes of 0.25 M sucrose. The homogenates were centrifuged at 18,000 × g for 20 min at 4°C to separate the postmitochondrial supernatant, and suitable aliquots were used for MT assay by the Cd-hem method, as described previously (Yoshioka et al., 2016).
Cell proliferation assayMurine hepatoma Hepa1-6 cells were obtained from RIKEN Cell Bank (Tsukuba, Japan) and maintained in Dulbecco’s modified Eagle’s medium (high glucose) (DMEM; Fujifilm Wako Pure Chemical) supplemented with 10% fetal bovine serum and penicillin/streptomycin (Fujifilm Wako Pure Chemical) at 37°C in a humidified atmosphere with 5% CO2. Hepa1-6 cells were plated in 96-well plates at a density of 10,000 cells per well and treated with various concentrations of ZnSO4 • 7H2O (Fujifilm Wako Pure Chemical) after 24 hr of seeding. After 24 hr of Zn treatment, the cell viability was evaluated using Alamar Blue (Bio-Rad Laboratories, Hercules, CA, USA). For the rescue experiment, Hepa1-6 cells were plated onto 96-well plates at a density of 10,000 cells per well and transfected with 50 ng pcDNA3.1, pcDNA3.1-Period2 (Per2), or pcDNA3.1- neuronal PAS domain protein 2 (Npas2) after 3 hr of seeding. After 24 hr of transfection, cells were treated with 200 μM Zn and cell numbers were evaluated after 24 hr of Zn treatment. The construction of plasmids is described in the supplementary information.
Apoptosis assayHepa1-6 cells were plated in 24-well plates at a density of 100,000 cells per well and treated with 200 μM Zn after 24 hr of seeding. After 24 hr of treatment, the number of apoptosis-positive cells was measured using Apotracker Green (BioLegend, San Diego, CA, USA) according to the manufacturer’s instructions. The nuclei were counterstained with Hoechst 33342 (Nacalai Tesque, Kyoto, Japan).
Quantitative RT-PCRHepa1-6 cells were plated at a density of 500,000 cells per 35 mm dish. When the cells reached 80% confluence, they were treated with 200 μM Zn or a vehicle (MilliQ water). After 24 hr of treatment, total RNA was extracted using an RNA Basic Kit (NIPPON Genetics, Tokyo, Japan), according to the manufacturer’s protocol (n = 3–5). The procedure for reverse transcription and PCR conditions have been described previously (Yoshioka et al., 2019). The levels of each target mRNA were normalized to those of β-actin. The oligonucleotide sequences of the primers used are: mouse β -actin (NM_007393) sense, 5′-GCAACGAGCGGTTCCG-3′, and antisense, 5′-CCCAAGAAGGAAGGCTGGA-3′; mouse brain muscle arnt-like 1 (Bmal1) (NM_007489) sense, 5′-TTCTCCAGGAGGCAAGAAGA-3′, and antisense, 5′-TTGCTGCCTCATCGTTACTG-3′; mouse circadian associated repressor of transcription (Ciart) (NM_001033302) sense, 5′-ATAGCTGCCCAGAAGTCATCC-3′, and antisense, 5′-TCTAGGAGAGGTGCAGGAGAAG-3′; mouse circadian locomotor output cycles kaput (Clock) (NM_007715) sense, 5′-TGCCAGCTCATGAAAAGATG-3′, and antisense, 5′-CGCTGCTCTAGCTGGTCTTT-3′; mouse cryptochrome 1 (Cry1) (NM_007771) sense, 5′-AGTTCCCCTCCCCTTTCTCTT-3′, and antisense, 5′-GGGTTCCCTTCCATTTTGTCA-3′; mouse Cry2 (NM_0099963) sense, 5′-GCAAAGGACTACGGCTCCAC-3′, and antisense, 5′-ATCTTCCAGAGATTGCAGTAGGAAC-3′; mouse Per1 (NM_011065) sense, 5′-GGGAGCCAAACTTCGACTG-3′, and antisense, 5′-TCGGATGTGATAGCTCCAA-3′; mouse Per2 (NM_011066) sense, 5′-TAGAATCCCTCCTGAGAAGAGG-3′, and antisense, 5′-AGAATAATCGAAAGGCTGTCCAC-3′; mouse Per3 (NM_011067) sense, 5′-TGGCTGCAGGAGGATTTAAG-3′, and antisense, 5′-TGCTGTGCTTAGCAGTGGAC-3′; mouse Npas2 (NM_008719) sense, 5′-GAGGCAGCTTGAACCCAAAGG-3′, and antisense, 5′-GTCAAAGCCATTACAGGAGGGG-3′.
Statistical analysisAll statistical analyses were performed using the SPSS software (version 26.0; SPSS, Chicago, IL, USA). The statistical significance of the differences between two groups was evaluated using a two-tailed Student t test. Multiple comparisons were evaluated with one-way analysis of variance (ANOVA) adjusted by the post hoc Tukey–Kramer’s test. Statistical significance was set at p < 0.05.
First, we tested the effect of injection timing on the severity of hepatic toxicity using a non-lethal dose of Zn since our previous report is a lethal toxicity test (Yoshioka et al., 2018). For this experiment, we chose ZT2 and ZT14 as representative injection times based on the previous result (Yoshioka et al., 2018). Since Zn-induced toxicity affects the liver (Grüngreiff et al., 2016; Jihen et al., 2008), liver samples in addition to plasma samples were collected at 0, 3, 6, 12, and 24 hr after the injections. In both injection groups, the plasma levels of AST, an indicator of hepatotoxicity, increased 3 hr after the administration of Zn and saturated at 6 hr. However, the AST levels were higher in the ZT14 group than in the ZT2 group after 6 and 12 hr of administration (Fig. 1A). Plasma ALT levels, another indicator of hepatotoxicity, increased in both injection groups at 3 hr and saturated at 12 hr. Significant higher levels of ALT were also observed in the ZT14 group after 6 hr compared to the ZT2 group (Fig. 1B). The same tendency was observed for renal toxicity markers (blood urine nitrogen and creatinine: Supplementary Fig. S1). These results suggest that Zn-induced toxicity was conserved in the non-lethal toxicity test.

Differences in the severity of hepatotoxicity and hepatic Zn and metallothionein (MT) levels induced by Zn administration. Male ICR mice (n = 4–6) were intraperitoneally injected with 32.3 mg (235.2 μmol Zn) /kg ZnCl2 at ZT2 or ZT14. The levels of plasma AST (A) and ALT (B) were measured at 0, 3, 6, 12, and 24 hr after injection. Data are plotted as the mean ± S.D. of each group. *p < 0.05 versus control at ZT2, #p < 0.05, ##p < 0.01; versus control at ZT14, $p < 0.05, versus the indicated time at ZT2. Hepatic Zn (C) and MT (D) levels were determined using atomic absorption spectrometry. **p < 0.01 and ***p < 0.001 versus control at ZT2, ###p < 0.001 versus control at ZT14.
To explore the mechanism of Zn-induced diurnal hepatotoxicity, we measured the Zn concentrations and MT levels in the liver. Since some medicine-induced pharmacological and toxicological effects are different depending on the exposure time (Beauchamp and Labrecque, 2007), we hypothesized that Zn-induced chronotoxicity might be affected by its accumulation. We found that Zn concentration in the liver continued to increase until 24 hr in both injection groups (at ZT2 and ZT14), but the levels were similar (Fig. 1C). Therefore, Zn accumulation might not be associated with Zn-induced diurnal toxicity. Moreover, we determined the MT levels in the liver. MT has antioxidant properties against reactive oxygen species via scavenging free radicals (Sato and Kondoh, 2002). Various metals, such as Zn and Cd, increase the levels of MT in many organs (Sato and Kondoh, 2002). It has potential for application in hepatic injury. For example, acetaminophen-induced hepatotoxicity was attenuated by Zn-induced MT (Saito et al., 2010). In addition, Cd-induced hepatic injury was potentiated by MT knockout mice (Park et al., 2001). Therefore, we postulate that Zn-induced MT levels may differ between ZT2 and ZT14. Hepatic MT levels significantly increased at 6 hr and continued to increase until 24 hr (Fig. 1D). The fold induction of hepatic MT was at the same level in both ZT2 and ZT14, indicating that diurnal toxicity by Zn may not affect MT induction levels.
The expression levels of many biological factors are known to fluctuate according to circadian rhythm. For instance, the expression levels of antioxidant genes have been reported to have a significant diurnal pattern in mice (Xu et al., 2012). Glutathione (GSH), an antioxidant that is critical for maintaining health and protecting against toxic compounds, also presented diurnal fluctuation along with GSH-related genes in mice (Xu et al., 2012). Zn toxicity is associated with cellular GSH and MT levels (Palmiter, 2004; Trevisan et al., 2014; Goodarzi et al., 2020). A decrease in GSH levels is followed by an increase in Zn-mediated toxicity (Walther et al., 2008). Our present investigation showed no significant differences in hepatic MT levels at either ZT2 or ZT14. Xu et al. reported that hepatic GSH levels are high in the morning, which is responsible for acetaminophen-induced hepatotoxicity (Lu et al., 2013). Moreover, we previously showed that GSH depletion by buthionine sulfoximine canceled Cd-induced chronotoxicity (Miura et al., 2013). Taken together, our results indicate that GSH levels may be an important factor in inducing Zn-induced chronotoxicity.
To explore the mechanism of Zn-induced diurnal toxicity, we performed in vitro experiments using murine hepatoma Hepa1-6 cells. ZnSO4 treatment resulted in a dose-dependent reduction in the proliferation of Hepa1-6 cells (Fig. 2A). We also evaluated cellular apoptosis because Zn overdose is known to induce cell death (Provinciali et al., 2015; Zhou et al., 2017). Apoptotic Hepa1-6 cells were detected by Zn (200 μM) treatment, but not by vehicle treatment (Fig. 2B). Therefore, we hypothesized that Zn-induced reduction in cell proliferation was caused by the induction of apoptosis. To investigate the involvement of clock genes, we measured their expression levels after Zn treatment. We found that the levels of Per2 and Npas2 expression were downregulated following treatment of Hepa1-6 cells with Zn (Fig. 2C). A recent study reported that clock genes, such as Per2 and Cry1, regulate the oxidative status in zebrafish (Alifu et al., 2021). Therefore, we speculated that Per2 and Npas2 has a protective effect against Zn-induced hepatotoxicity such as antioxidant proteins.
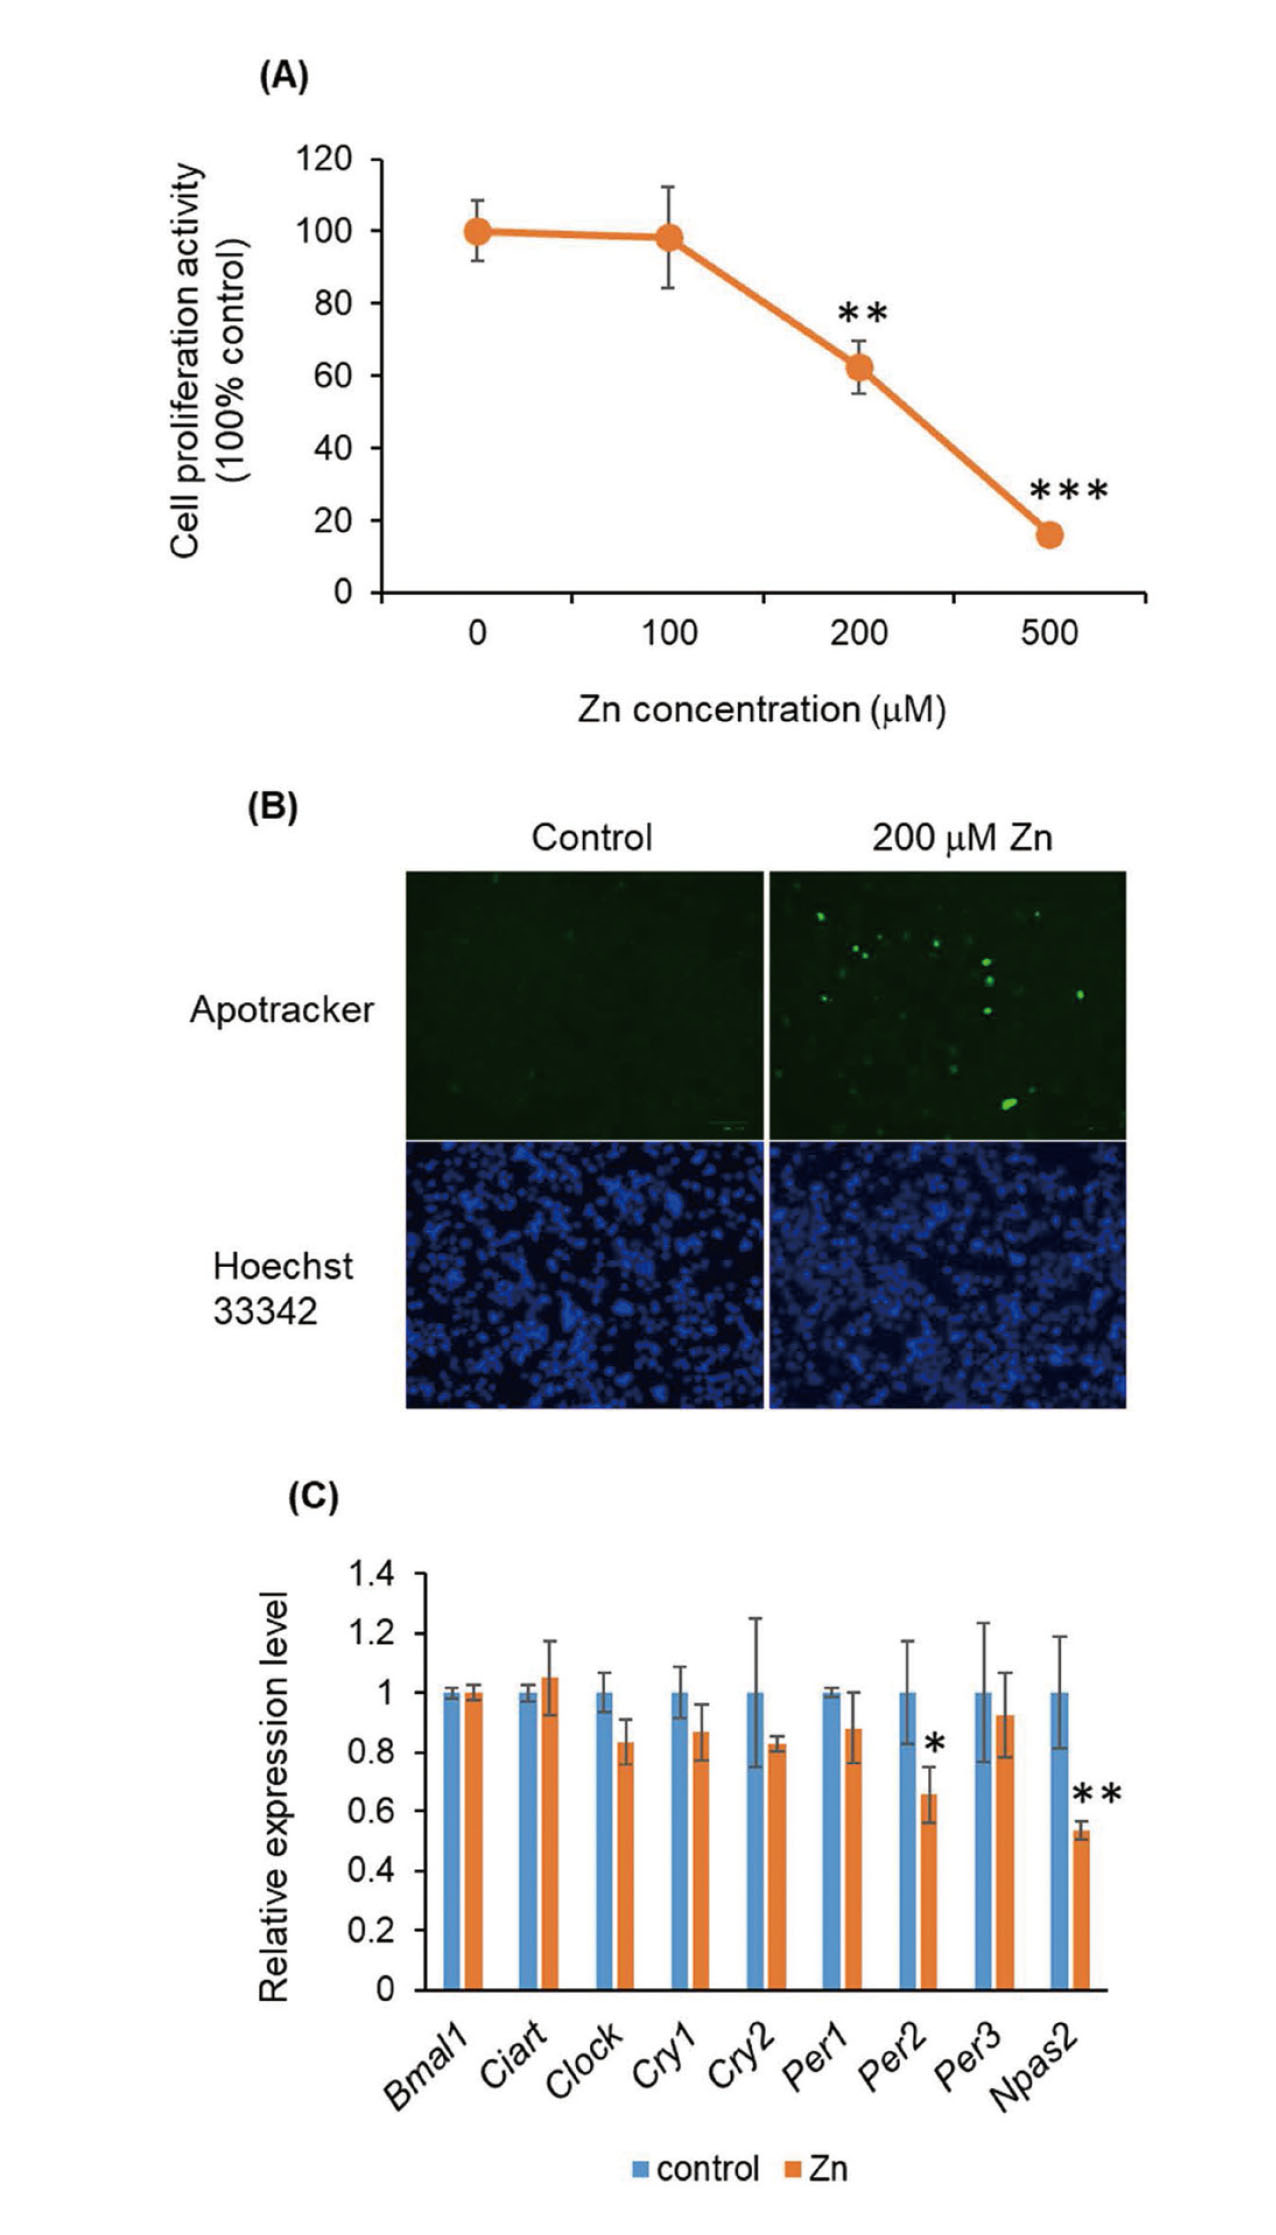
Effect of Zn on proliferation and clock gene expression in Hepa1-6 cells. (A) Proliferation of Hepa1-6 cells treated with Zn (0–500 μM) for 24 hr. **p < 0.01 and ***p < 0.001 versus control. (B) Apotracker staining (green) of Hepa1-6 cells after treatment with 200 μM Zn for 24 hr. The nuclei were counterstained with Hoechst 33342 (blue). Scale bar, 100 μm. (C) Quantitative RT-PCR for clock genes after treatment of Hepa1-6 cells with 200 μM Zn for 24 hr.
To investigate this hypothesis, we evaluated the protective effects of PER2 and NPAS2 against Zn-induced toxicity in Hepa1-6 cells. We showed that transfection of Per2 or Npas2 upregulated Per2 or Npas2 mRNA levels by 320-fold or 4800-fold, respectively (Fig. 3A). Although endogenous protein levels of PER2 and NPAS2 were low or below the limit of detection in Hepa1-6 cells, distinct protein expression was confirmed by transfection of each vector (Supplementary Fig. S2). As shown in Fig. 3B, overexpression of Per2 and Npas2 has no effect on cell proliferation. Zn treatment markedly reduced proliferation of Hepa1-6 cells, whereas overexpression of Per2 and Npas2 reversed Zn-induced toxicity. Moreover, apoptotic Hepa1-6 cells were observed following Zn treatment, but were not detected following overexpression of Per2 and Npas2 (Fig. 3C). In addition, we found that Zn depleted overexpressed Per2 (8.6 times) and Npas2 (2.5 times) in Hepa1-6 cells (Fig. 3A). These results indicated that Per2 and Npas2 modulated Zn-induced hepatotoxicity as antioxidant proteins.

Protective effect of Npas2 and Per2 against Zn-induced reduction of proliferation of Hepa1-6 cells. (A) Quantitative RT-PCR for Per2 and Npas2 after transfection with Per2 or Npas2 plasmid for 48 hr and treatment of Hepa1-6 cells with 200 μM Zn for 24 hr. ***p < 0.001 versus control and ###p < 0.001 versus Per2 or Npas2. (B) Proliferation of Hepa1-6 cells overexpressing Npas2 or Per2 after treatment with 200 µM Zn for 24 hr. ***p < 0.001 versus control and ###p < 0.001 versus Zn. (C) Apotracker staining (Green) of Hepa1-6 cells overexpressing of Npas2 or Per2 after treatment with 200 μM Zn for 24 hr. Nuclei were counterstained with Hoechst 33342 (Blue). Scale bar, 100 μm.
Circadian rhythms allow an organism to achieve temporal homeostasis with its environment at the molecular level by regulating gene expression, which peaks once every 24 hr, when a particular physiological process is most active with respect to the solar day. The transcription and translation of core clock components (CLOCK, NPAS2, BMAL1, BMAL2, PER1, PER2, PER3, CIART, CRY1, and CRY2) play a critical role in rhythm generation (Rijo-Ferreira and Takahashi, 2019). The transcription factors CLOCK or NPAS2 and BMAL1 or BMAL2, form the positive limb of the feedback loop, act in the form of a heterodimer, and activate the transcription of core clock genes and clock-controlled genes, harboring E-box elements (5'-CACGTG-3') within their promoters. The core clock genes PER1/2/3, CIART and CRY1/2, which are transcriptional repressors, form the negative limb of the feedback loop. PER/CRY heterodimers interact with the CLOCK/NPAS2 and BMAL1/2 heterodimers, and inhibit their activity, thereby negatively regulate their expressions (Supplementary Fig. S3). Recent reports have shown that the circadian rhythm is associated with several hepatic diseases, such as cancer (Kettner et al., 2016) and metabolic syndrome (Guan et al., 2018). Moreover, hepatic injury induced by carbon tetrachloride and brucine was affected by NPAS2 expression (Yang et al., 2019; Zhou et al., 2019). PER2 is also known to modulate hepatotoxicity of acetaminophen and carbon tetrachloride in mice (Chen et al., 2009; Kakan et al., 2011). Therefore, it is feasible that NPAS2 and PER2 are associated with Zn-induced diurnal hepatic injury. However, the present study still has some limitations since our hypothesis is derived from an in vitro experiment. Additionally, when we investigated the diurnal variation of mRNA expression levels for Npas2 and Per2, the Npas2 mRNA level was lower while Per2 is higher at the dark phase (ZT14) (Supplementary Fig. S4). This different patterning makes it hard to explain our hypothesis. In the future, we need to monitor Npas2 and Per2 expression level in vivo and use Npas2 knock out and Per2 knock out mice.
In conclusion, our results show that Zn-induced diurnal toxicity was not associated with its accumulation or MT induction levels. In addition, we suggest that diurnal Npas2 and Per2 expression may affect Zn-induced diurnal toxicity. Although further investigation is needed, our study provides valuable information regarding metal toxicity.
This research was supported by The Uehara Memorial Foundation, and JSPS KAKEN Grant-in-Aid for Young Scientists Grant Number 22K15328.
Conflict of interestThe authors declare that there is no conflict of interest.