Original Article
N-acetyl cysteine inhibits IL-1α release from murine keratinocytes induced by 2-hydroxyethyl methacrylate
2023 年 48 巻 10 号 p. 557-569
詳細
2023 年 48 巻 10 号 p. 557-569
The hydrophilic compound 2-hydroxyethyl methacrylate (HEMA) is a major component of dental bonding materials, and it enhances the binding of resin-composites to biomolecules. However, HEMA is a well-known contact sensitizer. We reported previously that intradermal injection of HEMA induces the production of IL-1 locally in the skin. Keratinocytes are the first barrier against chemical insults and constitutively express IL-1α. In this study, we analyzed whether HEMA induces the production of inflammatory cytokines from murine keratinocyte cell line Pam212 cells. We demonstrated that HEMA induced the release of 17-kDa mature IL-1α and caused cytotoxicity. The activity of calpain, an IL-1α processing enzyme, was significantly higher in HEMA-treated cells. The thiol-containing antioxidant N-acetyl cysteine (NAC) inhibited HEMA-induced IL-1α release but not cytotoxicity. NAC inhibited intracellular calpain activity and reactive oxygen species (ROS) production induced by HEMA. NAC post-treatment also inhibited IL-1α release and intracellular ROS production induced by HEMA. Furthermore, HEMA-induced in vivo inflammation also inhibited by NAC. NAC inhibited polymerization of HEMA through adduct formation via sulfide bonds between the thiol group of NAC and the reactive double bond of HEMA. HEMA-induced IL-1α release and cytotoxicity were also inhibited if HEMA and NAC were pre-incubated before adding to the cells. These results suggested that NAC inhibited IL-1α release through decreases in intracellular ROS and the adduct formation with HEMA. We concluded that HEMA induces IL-1α release from skin keratinocytes, and NAC may be a promising candidate as a therapeutic agent against inflammation induced by HEMA.
Methacrylates have a wide variety of applications in industrial, medical, dental, and cosmetic fields (Gautam et al., 2012). Among them, 2-hydroxyethyl methacrylate (HEMA) is a major component of dental bonding materials at concentrations of 0.3-28% (Henriks-Eckerman et al., 2004). Gel nails also contain HEMA, and a maximum of 30% HEMA was contained in nail enhancement products (Constandt et al., 2005; Cosmetic Ingredient Review Expert, 2005). Because of its hydrophilicity, HEMA enhances the binding of resin-composites to biomolecules. However, methacrylates are well-known contact sensitizers. Spencer et al. reported that 52 of 475 patients (10.9%) tested with 28 acrylates/methacrylates using patch tests had at least one positive reaction, and 29 patients (55.8%) were positive for HEMA (Spencer et al., 2016). Other studies also reported that HEMA is the most frequent positive allergen in patch tests (Raposo et al., 2017; Uter and Geier, 2015; Gonçalo et al., 2018).
The cytotoxic effects of HEMA have also been intensively investigated (Gallorini et al., 2014). HEMA induces apoptosis by the induction of oxidative stress (Paranjpe et al., 2005; Paranjpe et al., 2008). The electrophilic β-carbon of HEMA can bind to the nucleophilic thiol group of glutathione (GSH), and HEMA decreased GSH levels both in cells and in a cell-free system (Ansteinsson et al., 2013; Samuelsen et al., 2011). These studies indicated that GSH depletion is a one of mechanisms by which HEMA exhibits cytotoxicity. Inflammatory cytokines were also induced by HEMA. HEMA induced the production of interleukin (IL)-6, IL-8, monocyte chemoattractant protein-1, and interferon γ via the nuclear factor-κB and extracellular signal-regulated kinase signaling pathway in dental pulp stem cells (Sinjari et al., 2019).
HEMA activates nuclear factor erythroid 2-related factor (Nrf2)-Kelch-like ECH-associated protein 1 (Keap1) system, which is a major mechanism in cellular defense against oxidative and electrophilic stress. Nrf2 is a transcription factor that induces the expression of antioxidant genes, such as heme oxygenase-1 (Hmox1), by binding to the antioxidant response element, whereas Keap1 directly binds to Nrf2 and promotes proteasomal degradation of Nrf2 (Itoh et al., 2004). HEMA induces dissociation of Keap1 from Nrf2 through oxidative stress and/or direct binding with cysteine residues on Keap1 because of its electrophilic property, preventing subsequent Nrf2 degradation (Becher et al., 2019; Gallorini et al., 2015).
We previously reported that intradermal (i.d.) injection of HEMA induced significant ear swelling and local IL-1α and β production (Bando et al., 2014). IL-1α and β are proinflammatory cytokines that are produced as a 31-kDa precursor and processed to a 17-kDa mature protein (Dinarello, 2011; Di Paolo and Shayakhmetov, 2016). Of these two, IL-1α is produced by hematopoietic and non-hematopoietic cells, and pro- and mature forms exert biological functions (Di Paolo and Shayakhmetov, 2016). IL-1α is constitutively expressed in a variety of cell types in healthy tissues, and it functions as a damage-associated molecular pattern (DAMP), which is released simultaneously when cells are damaged and induces sterile inflammation (Bianchi, 2007).
Because of its usage as an adhesive in various fields, HEMA can come directly into contact with skin. Keratinocytes are the first barrier against chemical insults and they produce various inflammatory cytokines (Nestle et al., 2009). The aim of the present study was to elucidate whether HEMA induces the production of inflammatory cytokines from keratinocytes, and if so, how to inhibit them. To achieve this, we stimulated murine keratinocyte cell line Pam212 cells with HEMA. We demonstrated that HEMA induced mature IL-1α release from Pam212 cells in a calpain-dependent manner. Thiol-containing antioxidants N-acetyl cysteine (NAC) inhibited HEMA-induced IL-1α release. Furthermore, we showed that NAC inhibited in vivo inflammation.
4-(2-aminoethyl)-benzenesulfonyl fluoride (AEBSF) and calpeptin were purchased from Cayman Chemical (Ann Arbor, MI, USA). HEMA and NAC were purchased from SIGMA-Aldrich (St. Louis, MO, USA). Pan-caspase inhibitor Z-VAD-FMK was purchased from R&D Systems (Minneapolis, MN, USA). Anti-β-actin polyclonal antibody (rabbit IgG) was purchased from BioLegend (San Diego, CA, USA). Anti-mouse IL-1α polyclonal antibody (rabbit IgG) was purchased from Peprotech (Rocky Hill, NJ, USA). Anti-p16 INK4A monoclonal antibody (rabbit IgG) was purchased from Cell Signaling Technology (Danvers, MA, USA). Anti-Nrf2 polyclonal antibody(rabbit IgG) was purchased from Proteintech (Rosemont, IL USA). Horseradish peroxidase-conjugated anti-rabbit IgG was purchased from Pierce (Thermo Scientific, Waltham, MA, USA). All other reagents were purchased from Nacalai Tesque (Kyoto, Japan) unless otherwise indicated.
Cell cultureMurine keratinocyte cell line Pam212 cells were obtained from Dr. S.H. Yuspa (Laboratory of Cancer Biology and Genetics, Center for Cancer Research, National Cancer Institute) (Yuspa et al., 1980). Cells were grown at 37°C in a humidified atmosphere of 5% CO2 in Dulbecco’s modified Eagle’s medium (DMEM)-high glucose (4.5 mg/mL) supplemented with 10% (v/v) fetal bovine serum (FBS). For in vitro stimulation, Pam 212 cells were seeded in a 48-well culture plate at 2 × 10⁵ cells/500 μL. After culture for 24 hr, 400 μL of culture supernatant was removed, and each stimulus was added to make a final volume of 500 μL/well. The cells were incubated in the presence of stimulus at 37°C in a humidified atmosphere of 5% CO2 for the indicated times.
Measurement of cytokines in culture supernatantsCulture supernatants were collected by centrifugation. The concentrations of IL-1α, IL-33, and thymic stromal lymphopoietin (TSLP) in the culture supernatants were measured using an enzyme-linked immunosorbent assay (ELISA) with a commercial kit (BioLegend).
Measurement of cell viabilityCell viability was measured using a commercial kit (Cell Counting Kit-8, DOJINDO, Kumamoto, Japan).
Measurement of lactate dehydrogenase activityCells were cultured in the presence of 1% (v/v) FBS, and lactate dehydrogenase (LDH) activity in the culture supernatant was measured using a commercial kit (LDH Cytotoxicity Assay Kit, Nacalai Tesque).
Reverse transcription polymerase chain reactionCells were lysed in Isogen II (Nippon Gene, Toyama, Japan), and total RNA was extracted as described in the manufacturer’s instructions. The synthesis of complementary DNA was performed with a Transcriptor First Strand cDNA Synthesis Kit (Roche Diagnostic, Indianapolis, IN, USA). The mRNA expression levels were analyzed by quantitative RT-PCR using SYBR Select Master Mix and a Step One Plus Real-Time PCR system (Applied Biosystems, Waltham, MA, USA). The primers used for PCR were as follows: IL-1α (GenBank accession number NM_010554), forward: 5’-AGCAGCCTTATTTCGGG-3’ and reverse: 5’-TCTTCTCTTACAAAGAGGGTAAACA-3’; IL-33 (GenBank accession number NM_001164724.1), forward: 5’-ACAGATATATGACTTACGGCG-3’ and reverse: 5’-AAATGGACCCTCTCTAAAGCAAA-3’; TSLP (GenBank accession number NM_021367.2), forward: 5’-GGACTGTGAGAGCAAGCCAG-3’ and reverse: 5’-GGGCAAATGTTTTGTCGGGG-3’; Hmox1 (GenBank accession number NM_010442.2), forward: 5’-ATGGCGTCACTTCGTCAGAG-3’ and reverse: 5’-AAGCTGAGAGTGAGGACCCA-3’;β-actin (GenBank accession number NM_007393), forward: 5’-CGTTGACATCCGTAAAGACCTC-3’ and reverse: 5’-AGCCACCGATCCACACAGA-3’. mRNA expression levels were quantified by the ΔΔCT method using β-actin as an internal control.
Western blottingCulture supernatants were concentrated by ultrafiltration (molecular weight cut-off = 3 kDa). Cells were lysed in radio-immunoprecipitation assay buffer, which consisted of 50 mM Tris-HCl, pH 7.5, 150 mM NaCl, 1% (v/v) Nonidet P40, 0.1% (w/v) sodium dodecyl sulfate (SDS), 0.25% (w/v) sodium deoxycholate, 1 mM EDTA, and protease inhibitor cocktail, and incubated on ice for 15 min. After being centrifuged (15,000 g, 4°C, 15 min), supernatants were collected as whole cell lysates. Protein concentrations were measured using a BCA protein assay kit (Takara Bio, Kusatsu, Japan). To analyze Nrf2, cells were lysed directly in SDS-polyacrylamide gel electrophoresis (SDS-PAGE) sample buffer. Proteins were separated by SDS-PAGE in reducing conditions and then transferred to polyvinylidene difluoride membranes. After blocking with phosphate buffered saline (PBS) supplemented with 0.05% (v/v) Tween 20 and 3% (w/v) skim milk, the blot was incubated with a primary antibody, followed by a horseradish peroxidase-conjugated secondary antibody. The blot was analyzed using Chemi-Lumi One Ultra (Nacalai Tesque) and a FUSION FX Chemiluminescence Imaging System (Vilber Lourmat, Collégien, France). To strip the antibodies, the blot was incubated with 2 M glycine-HCl (pH 2.8) for 60 min. After washing, the blot was re-probed with different antibodies.
Measurement of intracellular calpain activitiesIntracellular calpain activities were analyzed using flow cytometry. Pam 212 cells (2 × 10⁵ cells/500 μL/tube) were stained with 200 μL of 30 μM 7-amino-4-chloromethylcoumarin, t-BOC-L-leucyl-L-methionine amide (tBOC-LM-CMAC, Thermo Scientific) in 10% FBS-DMEM at 37°C for 1 hr. After centrifugation, cells were stimulated with 200 μL of 1% HEMA and antioxidants in 10% FBS-DMEM at 37°C for 4 hr. Data were acquired on a FACSCanto II cell analyzer (BD Biosciences, San Jose, CA, USA) and analyzed using FlowJo software (Three Star, Ashland, OR, USA). Data were shown as mode of fluorescence intensity (MFI).
Measurement of intracellular reactive oxygen speciesIntracellular reactive oxygen species (ROS) were measured using flow cytometry. Pam 212 cells (2 × 10⁵ cells/500 μL/tube) were stained with 200 μL of 10 μM dihydrorhodamine 123 (DHR123, SIGMA-Aldrich) in 10% FBS-DMEM at 37°C for 1 hr. After centrifugation, cells were stimulated with 200 μL of 1% HEMA and antioxidants in 10% FBS-DMEM at 37°C for 2 hr, washed with medium, and further incubated for 2 hr. Data were acquired on a FACSCanto II cell analyzer and analyzed using FlowJo software. Data were shown as MFI.
Detection of phosphorylation of H2AX (γH2AX)Pam212 cells were seeded in an 8-well chamber slide at 2 × 10⁵ cells/500 μL. After culture for 24 hr, 400 μL of culture supernatant was removed, and each stimulus was added to make a final volume of 500 μL/well. The cells were incubated in the presence of stimulus at 37°C in a humidified atmosphere of 5% CO2 for 4 hr. γH2AX was detected by immunocytochemistry using a commercial kit (DNA damage detection kit-γH2AX-Green, DOJINDO, Kumamoto, Japan). Cell nuclei were counterstained with 4',6-diamidino-2-phenylindole (DAPI). Hydrogen peroxide (final concentration 1 mM) was used as a positive control.
In vivo inflammation mouse modelFemale BALB/cA mice were purchased from CLEA Japan (Tokyo, Japan). IL-1KO mice (deficient in both IL-1α and IL-1β, BALB/c background) were obtained from Prof. Yoichiro Iwakura (Research Institute for Biomedical Sciences, Tokyo University of Science, Noda, Japan) (Horai et al., 1998). Mice were maintained at 22 ± 3°C with 50 ± 15% humidity and a 12 hr light/dark cycle in conventional conditions. The mice were fed ad libitum with a commercial diet (Labo MR Stock, Nosan Corporation, Yokohama, Japan) and tap water. All animal procedures were approved by the Institutional Animal Care and Use Committee of Tohoku University (approved number: 2015DnA-038, 2016DnA-007, 2018DnA-011, 2018DnA-014) and were performed in accordance with their guidelines. Mice were challenged with an i.d. injection of 20 μL of saline containing of 5% HEMA with or without antioxidants into both pinnae (Bando et al., 2014). Ear swelling was measured 48 hr after the challenge using the Peacock dial thickness gauge. Mean values of both pinnae were used as a value for each mouse. For histological analysis, ear pinnae were cut out at 48 hr after the challenge. These were fixed in 10% formalin neutral buffer solution and embedded in paraffin. Sections (5 μm thick) were stained with hematoxylin and eosin. To measure the concentrations of cytokines in tissues, ear pinnae were cut out at 48 hr after the challenge. Tissues were homogenized in homogenization buffer (DMEM containing 10% bovine serum albumin, 10 mM HEPES, 0.01% Triton X-100, and protease inhibitor cocktail), and incubated for 2 hr on ice. After centrifugation, supernatants were collected as tissue homogenates. Cytokine concentrations were measured using an ELISA.
Polymerization of HEMAHEMA and a reagent were mixed at a liquid volume ratio of 9:1 to prepare solutions. The reagents were ultrapure water, NAC, or ascorbic acid (AA). Unmixed HEMA was also prepared. Five milliliters of HEMA solutions and 0.025 g of dimethyl 2,2'-azobis (isobutyrate) were mixed and polymerized at 55°C for 3 hr. The polymerized HEMA was dry-polished with a SiC abrasive paper up to #2000, and then held in a constant temperature bath at 37°C for 24 hr to prepare test specimens (n = 4). The Vickers hardness of the specimens was determined using a micro-Vickers hardness tester (HM-221, Mitutoyo, Kawasaki, Japan); a load of 0.01961 N (2 gf) and dwell time of 15 sec were used. The tests (n = 20) were conducted at five randomly chosen points on each specimen.
Analysis of [HEMA + NAC] adduct formationEqual volumes of 10% HEMA (dissolved in Milli Q water) and 400 mM NAC (dissolved in Milli Q water and adjusted pH to around 7 with 2 M NaOH) were mixed and incubated for at 37°C for 24 hr. Aliquots were diluted 4-times with 10% FBS-DMEM and added to Pam212 cells. Final concentrations of HEMA and NAC in cell culture were 1% and 40 mM, respectively. The resulting samples were diluted 100-times with Milli Q water and analyzed by mass spectrometry (MS). Final concentrations of HEMA and NAC for MS analysis were 0.05% (4.1 mM) and 2 mM, respectively. The samples were introduced into the MS system using a syringe pump into the solvent flow from a liquid chromatography (LC) system. LC conditions were as follows: Ultimate 3000 LC system (Thermo Scientific) equipped with DGP-3600MB pump; solvent A, water containing 0.1% (v/v) formic acid; solvent B, acetonitrile containing 0.1% (v/v) formic acid; the ratio of solvent A to B, 7:3; flow rate, 0.2 mL/min. MS conditions were as follows: LTQ Orbitrap Velos hybrid ion trap-orbitrap mass spectrometer (Thermo Scientific) equipped with an ESI source; analyzer, ion trap/positive ion mode; source heater temperature, 400°C; capillary temperature, 200°C; spray voltage, 4.5 kV; sheath and auxiliary gas (nitrogen) pressures, 50 and 15 (arbitrary units), respectively; syringe pump flow rate, 20 μL/min. Full scanning analyses were performed in the range of m/z 100–500. Data were processed using Xcalibur (version 2.2.SR2, Thermo Scientific).
Statistical analysisExperimental values are given as the mean ± standard deviation (S.D.) of a single experiment performed in triplicate unless otherwise stated. All experiments in the present study except for polymerization of HEMA and in vivo experiments were performed at least three times to confirm the reproducibility of the results. The data shown are representative results. Statistical analyses were performed with a one- or two-way analysis of variance (ANOVA) using Dunnett’s and Tukey’s multiple comparison tests (GraphPad Prism version 7.02, GraphPad Software, San Diego, CA, USA). P < 0.05 was considered to be significant.
When Pam212 cells were incubated with various concentrations of HEMA for 24 hr, only 1% HEMA induced significantly higher concentrations of IL-1α in culture supernatants and significantly lower cell viabilities (Fig. 1A and B). When cells were incubated with 1% HEMA for various times, significantly higher concentrations of IL-1α were induced after 12 hr incubation (Fig. 1C). Cell viabilities were decreased after incubation for 4 hr or longer and less than 10% after incubation for 12 hr. LDH activities in culture supernatants reached more than 90% after incubation for 8 hr (Fig. 1D). No significant differences were detected in the expression levels of IL-1α mRNA (Fig. 1E). On the other hand, the concentrations of IL-1α in culture supernatants and cell viabilities were not affected if cells were incubated with 1% methyl methacrylate (MMA) (Fig. 1F and G). We also measured IL-33 and TSLP. IL-33 is a member of IL-1 family and functions as a DAMP (Bertheloot and Latz, 2017). TSLP is also produced by keratinocytes, and induces Th2-type immune responses (Ziegler and Artis, 2010). However, the concentrations of IL-33 and TSLP in culture supernatants were lower than detection limits even cells were incubated with 1% HEMA for 24 hr (data not shown). No significant differences in the mRNA expression levels of IL-33 and TSLP were induced by stimulation with HEMA (Fig. 1E).

HEMA induces IL-1α release from Pam212 cells. (A and B) Pam212 cells were stimulated with the indicated concentrations of HEMA for 24 hr. IL-1α concentrations in the culture supernatants (A) and cell viabilities (B) are shown. **P < 0.01. (C and D) Pam212 cells were stimulated with 1% HEMA for the indicated times. IL-1α concentrations in culture supernatants (C) and cell viabilities and LDH activities in culture supernatants (D) are shown. **P < 0.01, significantly different from the control (medium). (E) Pam212 cells were stimulated with 1% HEMA for the indicated times. Expression levels of IL-1α, IL-33, and TSLP mRNA are expressed as relative units after normalizing using β-actin levels. (F and G) Pam212 cells were stimulated with 1% HEMA (H) or MMA (M) for 24 hr. IL-1α concentrations in culture supernatants (F) and cell viabilities (G) are shown. **P < 0.01.
Because HEMA induces dissociation of Keap1 from Nrf2 and prevents Nrf2 degradation, we analyzed intracellular protein levels of Nrf2 in Pam212 cells stimulated with HEMA. Stimulation with HEMA significantly increased intracellular levels of Nrf2 (Fig. 2A). However, no significant differences were induced in mRNA expression levels of Hmox1, a typical Nrf2-regulated gene (Fig. 2B).
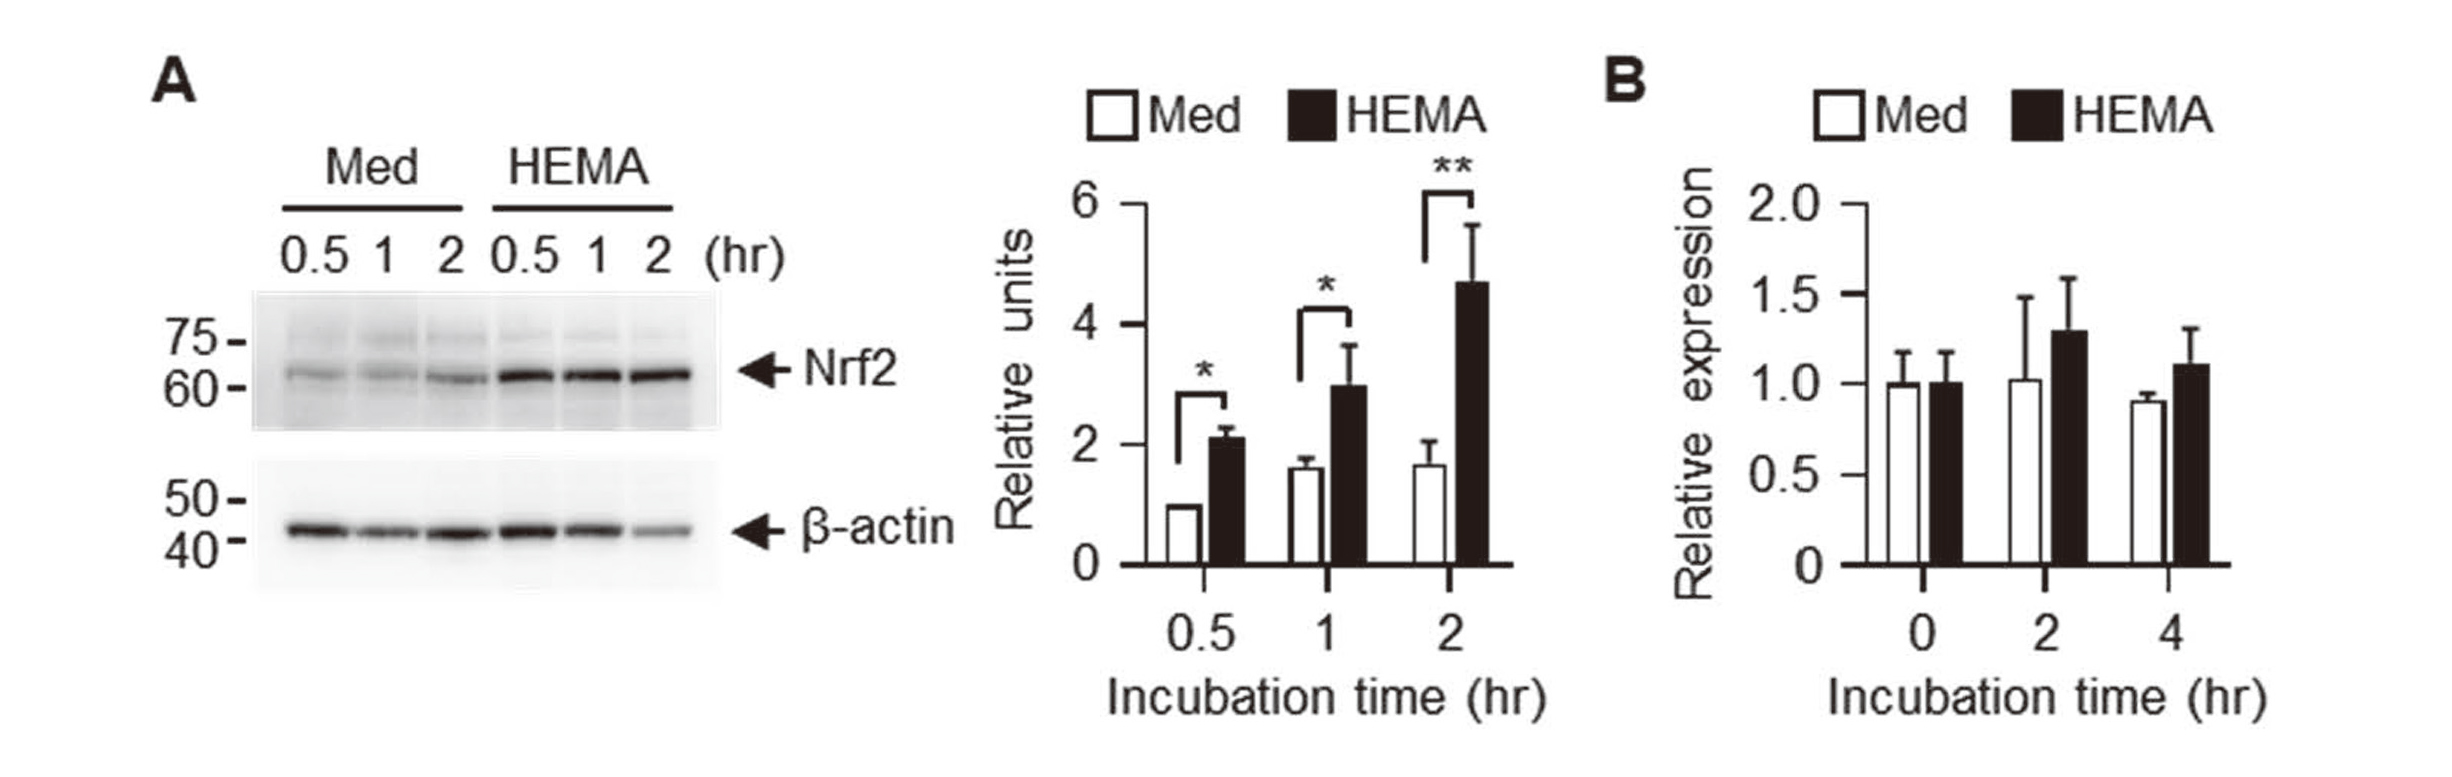
HEMA increases intracellular Nrf2 protein levels but not mRNA expression levels of Hmox1. Pam212 cells were stimulated with 1% HEMA for the indicated times. (A) Whole cell lysates were analyzed using western blotting with anti-Nrf2 and anti-β-actin antibodies. Expression levels were normalized to β-actin levels and expressed as relative expression based on the value of medium, 0.5 hr. Data shown are representative of three independent experiments. Bars show the mean ± SD of three independent experiments. **P < 0.01, *P < 0.05. (B) Expression levels of Hmox1 mRNA were expressed as relative units after normalizing using β-actin levels.
Because HEMA induces DNA damage (Gallorini et al., 2014), we analyzed γH2AX expression, which is a well-known marker for DNA double-strand breaks (Kinner et al., 2008), in Pam212 cells. Stimulation with HEMA for 4 hr apparently induced γH2AX in cell nuclei (Fig. 3A), indicating that HEMA induced DNA double-strand breaks. DNA damage is closely related to cellular senescence (Hernandez-Segura et al., 2018); therefore, we analyzed cellular expression of p16, a cellular senescence marker. Although the molecular weight of p16 was slightly higher in cells stimulated with HEMA, no significant changes in the expression levels of p16 were induced by stimulation with HEMA (Fig. 3B).

HEMA induces DNA damage but not cellular senescence. (A) Pam212 cells were stimulated with 1% HEMA or 1 mM H2O2 (positive control) for 4 hr. γH2AX was detected by immunocytochemistry (green, left panels). Cell nuclei were counterstained with DAPI (middle panels). Right panels show merged images. Bar: 50 μm. (B) Pam212 cells were stimulated with 1% HEMA for the indicated times. Whole cell lysates were analyzed using western blotting with anti-p16 and anti-β-actin antibodies. Expression levels were normalized to β-actin levels and expressed as relative expression based on the value of medium, 2 hr. Data shown are representative of three independent experiments. Bars show the mean ± SD of three independent experiments.
Pam212 cells constitutively expressed 31-kDa IL-1α precursor (Pro-IL-1α) and 17-kDa mature IL-1α was released into the culture supernatants if cells were incubated with HEMA (Fig. 4A). Calpain is a major processing enzyme of IL-1α (Di Paolo and Shayakhmetov, 2016). The pan-calpain inhibitor calpeptin partially but significantly inhibited IL-1α release (Fig. 4B). Western blotting analysis showed that mature IL-1α was released even if cells were incubated with HEMA and calpeptin (Fig. 4A). Because calpain is a Ca2+-dependent Cys-protease (Storr et al., 2011), we analyzed the effects of the intracellular Ca2+ chelator BAPTA-AM. As shown in Fig. 4C, IL-1α release was significantly inhibited by BAPTA-AM. Intracellular calpain activities were also analyzed using the fluorescent substrate tBOC-LM-CMAC. Incubation with HEMA induced significantly higher intracellular calpain activities in Pam212 cells (Fig. 4D). Ser-proteases and caspase-11 were also reported as IL-1α-processing enzymes (Ketelut-Carneiro et al., 2019; Afonina et al., 2011). IL-1α release induced by HEMA was partially inhibited by the Ser-protease inhibitor AEBSF but not by the pan-caspase inhibitor Z-VAD-FMK (Figs. 4E and F). Mature IL-1α was detected in culture supernatants even in the presence of each inhibitor (Fig. 4A).
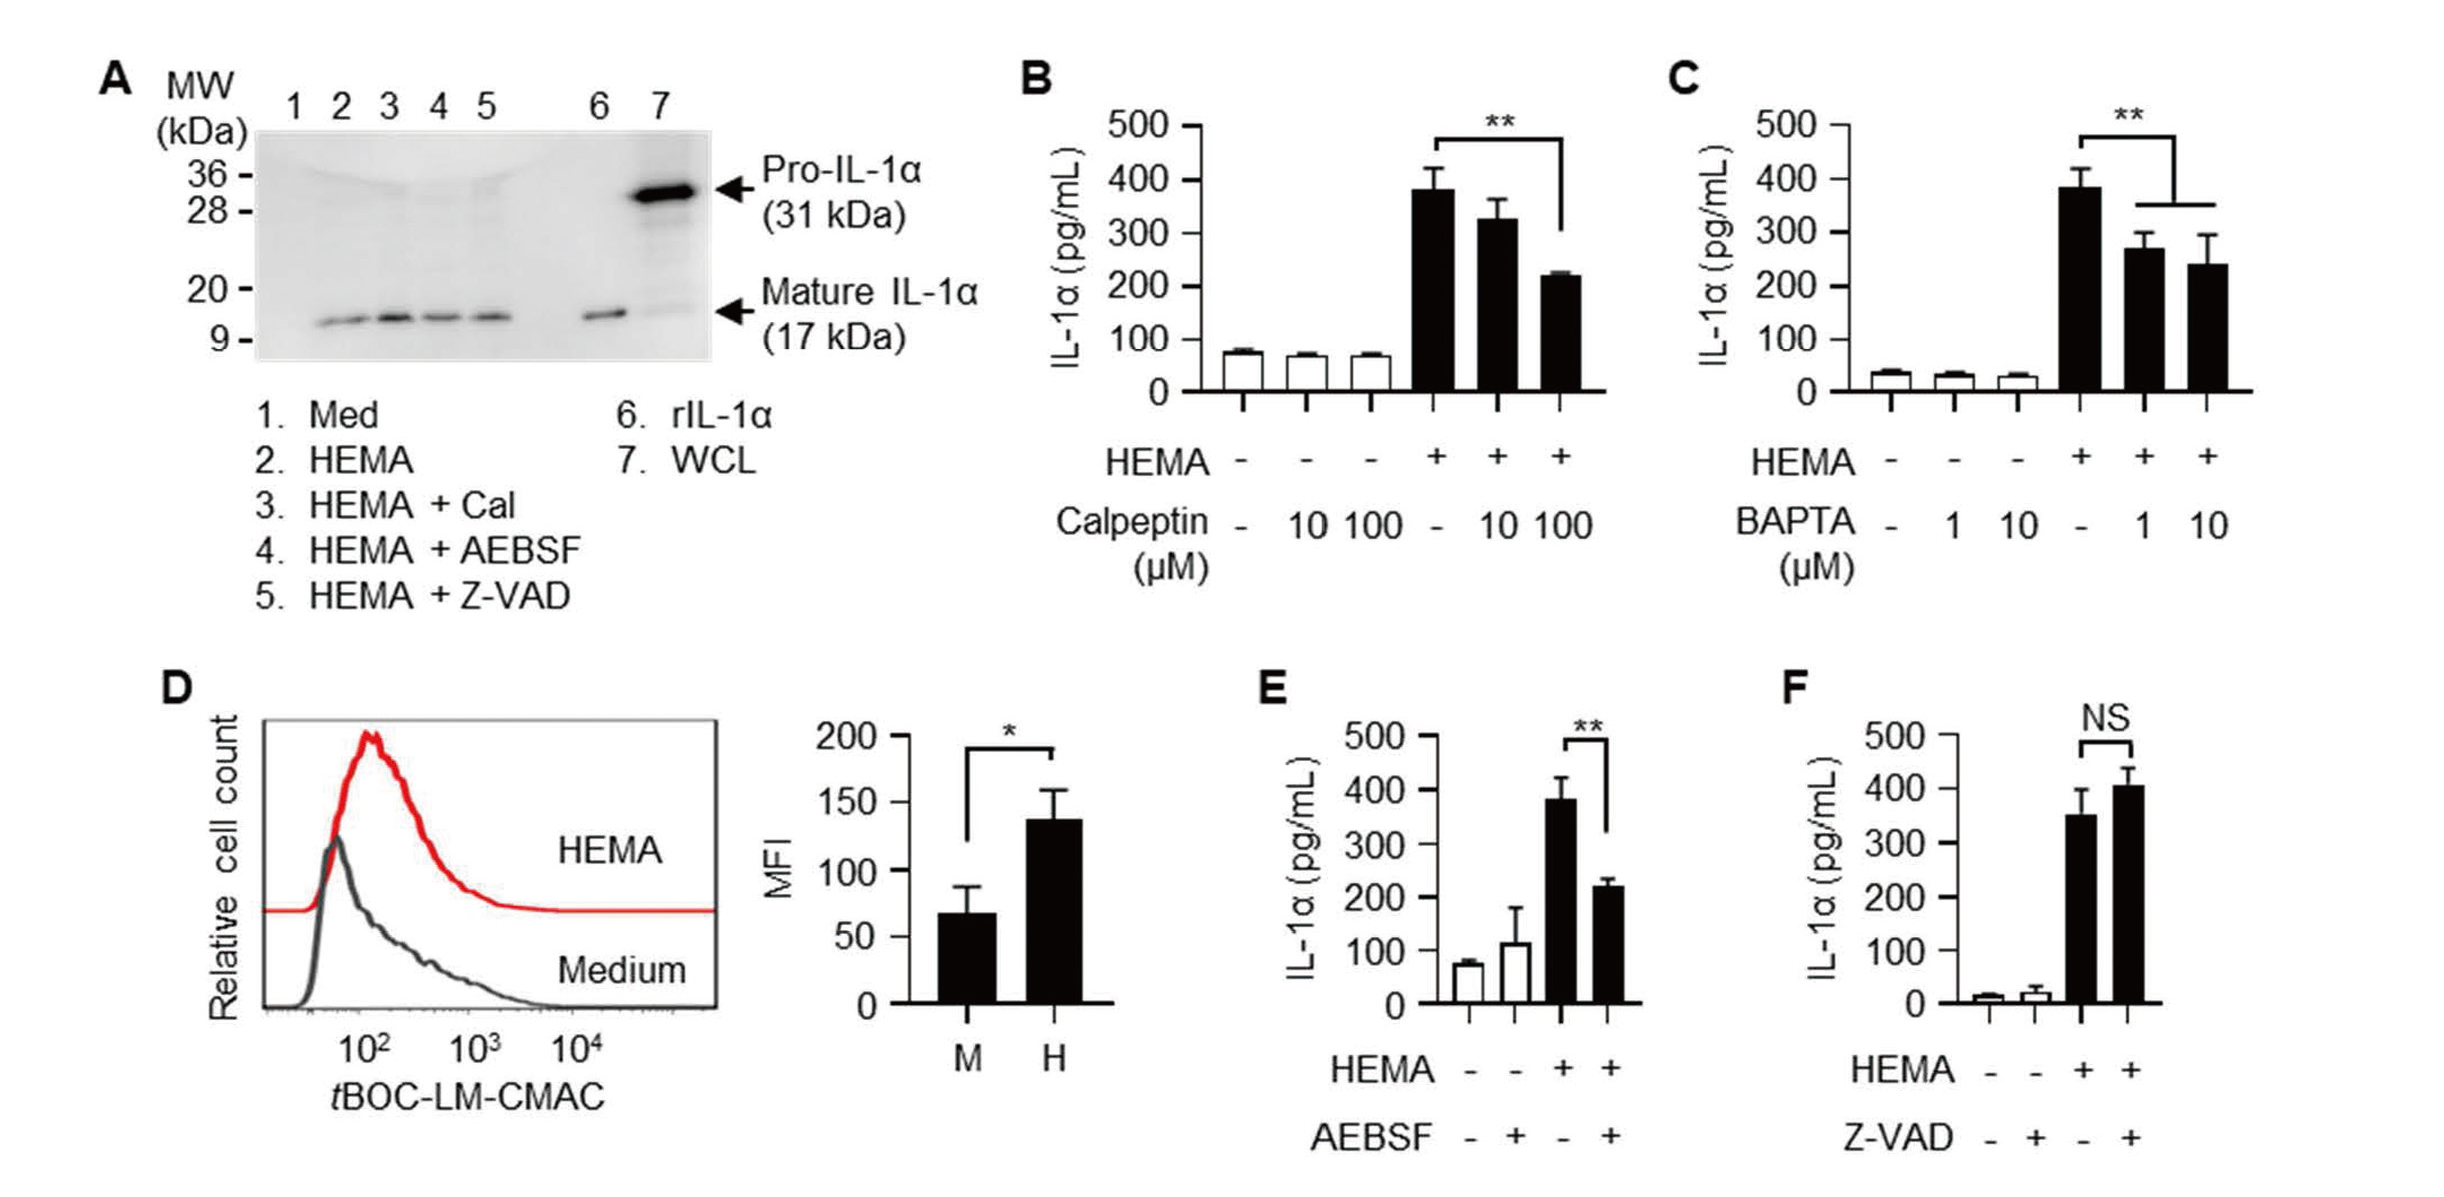
Calpain is involved in IL-1α release induced by HEMA. (A) Pam212 cells were stimulated with 1% HEMA with or without 100 μM inhibitors for 24 hr. IL-1α in culture supernatants was analyzed by western blotting. Lanes 2-5 contain 100 pg of IL-1α. rIL-1α (lane 6, 200 pg/well) was used as a positive control. WCL; whole cell lysate of Pam212 cells. (B and C) Pam212 cells were stimulated with 1% HEMA and the indicated concentrations of calpeptin (B) or BAPTA-AM (C) for 24 hr. IL-1α concentrations in culture supernatants are shown. **P < 0.01. (D) tBOC-LM-CMAC-loaded Pam212 cells were stimulated with 1% HEMA for 4 hr. Cells were analyzed using a flow cytometer. Histograms show representative tBOC-LM-CMAC fluorescence of three independent experiments. Bars represent the mean ± SD of MFI of cells obtained from three independent experiments. M: medium, H: HEMA. *P < 0.05. (E and F) Pam212 cells were stimulated with 1% HEMA with 100 μM AEBSF (E) or 100 μM Z-VAD-FMK (F) for 24 hr. IL-1α concentrations in culture supernatants are shown. **P < 0.01, NS, not significant.
It was reported that HEMA induces oxidative stress and NAC protects cells from HEMA-induced apoptosis (Paranjpe et al., 2008; Gallorini et al., 2014). We analyzed whether antioxidants inhibit the IL-1α release induced by HEMA. Thiol-containing antioxidant NAC but not a non-thiol-containing antioxidant AA, significantly inhibited IL-1α release induced by HEMA (Fig. 5A). On the other hand, the cytotoxic effect of HEMA was not inhibited by both antioxidants (Fig. 5B). HEMA-induced increases in intracellular calpain activities were also decreased in the presence of NAC, but not AA (Fig. 5C). Because HEMA induced oxidative stress in various cells (Gallorini et al., 2014), we measured intracellular ROS production in HEMA-treated Pam212 cells. To measure intracellular ROS, the cells were loaded with DHR123 then treated with HEMA and antioxidants. As shown in Fig. 5D, MFI of DHR123 was significantly higher in HEMA-treated cells, and NAC, but not AA decreased HEMA-induced increases in intracellular ROS production. To further analyze how NAC inhibits HEMA-induced IL-1α release, Pam212 cells were treated with NAC before or after HEMA stimulation. Cells were pre-treated with NAC for 4 hr, rinsed with medium, then stimulated with HEMA (NAC pre-treatment), or stimulated with HEMA for 4 hr, rinsed with medium, then post-treated with NAC (NAC post-treatment). IL-1α release was slightly inhibited by NAC pre-treatment (Fig. 5E). On the other hand, NAC post-treatment completely inhibited HEMA-induced IL-1α release (Fig. 5E). The cytotoxic effect of HEMA was not inhibited by both pre- and post-treatment (data not shown). HEMA-induced ROS production was also inhibited by NAC post-treatment (Fig. 5F).

NAC inhibits HEMA-induced IL-1α release from Pam212 cells. (A and B) Pam212 cells were stimulated with 1% HEMA, 40 mM NAC and 200 μM AA for 24 hr. IL-1α concentrations in culture supernatants (A) and cell viabilities (B) are shown. **P < 0.01. (C) tBOC-LM-CMAC-loaded Pam212 cells were stimulated with 1% HEMA, 40 mM NAC and 200 μM AA for 4 hr. Bars represent the mean ± SD of MFI of cells obtained from four independent experiments. **P < 0.01. (D) DHR123-loaded Pam212 cells were stimulated with 1% HEMA, 40 mM NAC and 200 μM AA for 2 hr. After washing, the cells were further incubated for 2 hr. Cells were analyzed using a flow cytometer. Bars represent the mean ± SD of MFI of cells obtained from three independent experiments. *P < 0.05. (E) Pam212 cells were pre-treated with NAC for 4 hr, rinsed with medium, then stimulated with HEMA (NAC pre-treatment, black columns); stimulated with HEMA for 4 hr, rinsed with medium, then post-treated with NAC (NAC post-treatment, gray columns). Culture supernatants were collected 24 hr after the addition of HEMA. IL-1α concentrations in culture supernatants are shown. **P < 0.01. (F) DHR123-loaded Pam212 cells were stimulated with 1% HEMA for 2 hr, rinsed with medium, then post-treated with 40 mM NAC for 2 hr. Bars represent the mean ± SD of MFI of cells obtained from three independent experiments. *P < 0.05.
An i.d. injection of 5% HEMA into the ear pinnae induced significant ear swelling (Fig. 6A). IL-1KO mice showed significantly lower ear swelling, indicating that HEMA-induced inflammation is dependent on IL-1 (Fig. 6A). Co-administration of 40 mM NAC with HEMA significantly reduced ear swelling (Fig. 6B). Histological analysis showed that reduced edema and inflammatory cell migration were detected in ear pinnae after co-administration of NAC and HEMA (Fig. 6B). These results indicated that NAC inhibited in vivo inflammation induced by HEMA. Concentrations of IL-1α were significantly lower in HEMA-injected ear pinnae than those in saline-injected ear pinnae (Fig. 6C). Concentrations of IL-33 were not significantly different between groups (Fig. 6D). Concentrations of TSLP were lower than the detection limit (data not shown).

NAC inhibits HEMA-induced inflammation in vivo. (A) Ear pinnae of WT and IL-1KO mice were i.d. challenged with 5% HEMA. Bars show ear swelling 48 hr after challenge. Results represent the mean ± SD of 6 ear pinnae. Each symbol represents the value from each ear pinna. **P < 0.01. (B) Ear pinnae of WT mice were i.d. challenged with 5% HEMA and 40 mM NAC. Bars show ear swelling 48 hr after challenge. Results represent the mean ± SD of 6 mice. Each symbol represents the value from each mouse. **P < 0.01. Ear pinnae were cut out at 48 hr after the challenge, fixed in formalin, and embedded in paraffin. Sections were stained with hematoxylin and eosin. Bar: 200 μm. (C and D) Ear pinnae were cut out at 48 hr after the challenge, and homogenized. Concentrations of IL-1α (C) and IL-33 (D) in tissue homogenates were measured using ELISA. Results represent the mean ± SD of 4 ear pinnae. Each symbol represents the value from each ear pinna. *P < 0.05.
It was reported that NAC detoxifies HEMA by adduct formation through a sulfide bond between the thiol group of NAC and the reactive double bond of HEMA which contributes to polymerization (Nocca et al., 2010). In fact, NAC inhibited the polymerization of HEMA (Fig. 7A). IL-1α release and cytotoxicity were inhibited if HEMA and NAC were pre-incubated before adding to the cell culture (Figs. 7B and C). MS analysis revealed that [HEMA+NAC] adducts were formed after overnight incubation and free HEMA and NAC were not detected (Figs. 7D-F).

Pre-incubation of HEMA and NAC inhibits IL-1α releases and cytotoxicity. (A) HEMA was polymerized with 40 mM NAC and 200 μM AA. Cont.: HEMA with water. Vickers hardness values are shown. **P < 0.01. (B and C) HEMA and antioxidants were pre-incubated for 24 hr, then added to Pam212 cell culture. Final concentrations of HEMA, NAC and AA were 1%, 40 mM and 200 μM, respectively. Culture supernatants were collected 24 hr after the addition of HEMA. IL-1α concentrations in culture supernatants (B) and cell viabilities (C) are shown. **P < 0.01. (D-F) HEMA and NAC were incubated for 24 hr, then analyzed by MS. Representative MS spectra of three independent experiments are shown. The highest peak in each mass spectrum was normalized to 100%, and the normalization level (NL) is indicated in the spectra. D, NAC; E, HEMA; F, HEMA + NAC.
We showed that HEMA induced release of IL-1α, but not IL-33 and TSLP, from murine keratinocyte cell line Pam212 cells. Because the expression levels of IL-1α mRNA were not changed, we described IL-1α release, but not IL-1α production. IL-1α is constitutively expressed as an alarmin in various cell types, and induces sterile inflammation (Bianchi, 2007). These results suggested that IL-1α release involved with inflammation and contact hypersensitivities induced by HEMA. In contrast, the hydrophobic methacrylate MMA did not induce IL-1α release and cytotoxicity in Pam212 cells, suggesting the involvement of the hydrophilicity of HEMA.
Concentrations of HEMA (1% = 82 mM) that induced IL-1α release in this study were much higher than those eluted from dental restorative materials (Manojlovic et al., 2011), which was less than 0.0001%. These observations suggested that IL-1α release from oral epithelial cells induced by HEMA eluted from dental restorative materials are considered as rare cases. On the other hand, it was reported that dental materials and nail enhancement products contain a maximum of 28% and 30% HEMA, respectively. (Henriks-Eckerman et al., 2004; Cosmetic Ingredient Review Expert, 2005). Moreover, HEMA can permeate through gloves (Andreasson et al., 2003; Nakamura et al., 2003), suggesting that occupational exposure to high concentrations of HEMA can happen in dental and cosmetic workers. In fact, European surveillance reported that occupational cases were more frequent in allergic contact dermatitis caused by methacrylates (Gonçalo et al., 2018; Uter and Geier, 2015).
It was reported that HEMA induces dissociation of Keap1 from Nrf2 through oxidative stress and/or direct binding with cysteine residues on Keap1, thus preventing Nrf2 degradation (Becher et al., 2019; Gallorini et al., 2015). We also confirmed increases in Nrf2 protein levels in HEMA-stimulated cells. However, no significant changes were detected in the mRNA expression of the typical Nrf2-regulated gene Hmox1. Because cell viabilities were less than 50% 4 hr after HEMA stimulation, we considered that cytotoxicity was exerted before the induction of gene expression by Nrf2. These observations suggested that the Nrf2-Keap1 system is less involved in the HEMA-induced IL-1α release.
γH2AX expression was clearly higher in HEMA-stimulated cells, indicating that HEMA induced DNA double-strand breaks, as reported previously (Gallorini et al., 2014). DNA damage is closely related to cellular senescence (Hernandez-Segura et al., 2018); however, the expression of p16, a cellular senescence marker, was not induced by stimulation with HEMA. These results suggested that HEMA induced DNA damage but not cellular senescence. The molecular weight of p16 was slightly higher in cells stimulated with HEMA. Because murine p16 has 4 cysteine residues (Cys-64, 127, 130 and 137), modification of thiols with HEMA may affect the molecular weight of p16.
HEMA induced the release of mature IL-1α, indicating that pro-IL-1α, which is constitutively expressed in Pam212 cells, is proteolytically processed. Calpain is a Ca2+-dependent Cys-protease and major IL-1α-processing enzyme (Di Paolo and Shayakhmetov, 2016). Inhibition of HEMA-induced IL-1α release was observed with the pan-calpain inhibitor calpeptin and intracellular Ca2+ chelator BAPTA-AM. Moreover, HEMA induced the activation of intracellular calpain. These results indicated the involvement of calpain with HEMA-induced IL-1α release. On the other hand, Ser-protease inhibitor AEBSF also inhibited HEMA-induced IL-1α release. Ser-proteases, such as granzyme B, elastase, and chymase, also reported as IL-1α-processing enzymes (Afonina et al., 2011). Several studies reported the expression of granzyme B and elastase in human keratinocytes (Hernandez-Pigeon et al., 2006; Bonnart et al., 2010). Pam212 cells also express and secrete Ser-protease (Marthinuss et al., 1995), suggesting that some kinds of Ser-proteases contribute to the HEMA-induced IL-1α release.
Thiol-containing antioxidant NAC inhibited IL-1α release but not cytotoxicity induced by HEMA, suggesting that IL-1α release was not just a leakage of intracellular contents. Consistent with this, HEMA induced mature IL-1α release but not the precursor. It was reported that oxidative stress induces calpain activation (Páramo et al., 2013; Zhu et al., 2019). HEMA-induced ROS production was inhibited in the presence of NAC or by NAC post-treatment, suggesting that the antioxidative activity of NAC contributes to the inhibition of HEMA-induced IL-1α release.
HEMA binds to GSH and decreases the GSH levels, which reduced intracellular antioxidant capacity and increased oxidative stress. In addition, stimulation with HEMA for a long period (12-24 hr) induced decreases in mitochondrial membrane potential and the production of superoxide anions in mitochondria (Schweikl et al., 2014). We measured intracellular ROS 4 hr after stimulation with HEMA, and strong cytotoxicities were detected 24 hr after stimulation with HEMA. These results suggested that HEMA-induced ROS production detected in this study was mainly caused by reductions in intracellular GSH levels.
Moreover, NAC inhibited in vivo inflammation induced by HEMA injection. IL-1KO mice showed significantly less ear swelling than WT mice, indicating the IL-1 dependency of HEMA-induced in vivo inflammation. On the other hand, concentrations of IL-1α were significantly lower in HEMA-injected ear pinnae than those in saline-injected ear pinnae. IL-1α is constitutively expressed in various cells and function as a DAMP (Bianchi, 2007). We considered that HEMA-injection induced the release of IL-1α associated with inflammation into the bloodstream; therefore, the concentrations of IL-1α in tissue homogenates decreased. We i.d. injected 1.6 μmol (260 μg) of NAC into mice (40 mM NAC, 20 μL/ear, both pinnae). Considering the body weights of the mice (25 g), the dose of NAC was approximately 10.4 mg/kg. NAC is used as an antidote for acetaminophen with a dose of 150 mg/kg i.v. or 140 mg/kg p.o. (Kanter, 2006). Although differences in administration routes should be carefully considered, the dose of NAC used in this study appeared to be within a reasonable range.
NAC makes adducts with HEMA through its thiol group and inhibits HEMA-induced cytotoxicity (Samuelsen et al., 2011; Nocca et al., 2010). Reactivity of cysteine derivative is useful to predict skin sensitizers including HEMA-related methacrylate (Fujita et al., 2014). We also confirmed that NAC inhibited the polymerization of HEMA and incubation of HEMA and NAC formed [HEMA + NAC] adducts. The induction of IL-1α release and cytotoxicity were inhibited if HEMA and NAC were pre-incubated before adding to cell culture. These results suggested that the reactive double bond of HEMA contributes to IL-1α release and cytotoxicity.
Our results that 40 mM NAC did not inhibit HEMA-induced cytotoxicity are inconsistent with those from previous reports. Paranjpe et al. reported that HEMA induced apoptosis in various cells, such as primary human dental pulp cells and osteoblasts, and its inhibition by 20 mM NAC (Paranjpe et al., 2008). Nocca et al. also reported the inhibition of HEMA-induced cytotoxicity by 10 mM NAC in murine embryonic fibroblasts 3T3 cells (Nocca et al., 2010). These discrepancies were probably caused by the differences in experimental conditions. They used 10-times or lower concentrations of HEMA (< 8 mM) than our experiments.
In conclusion, the present study clearly demonstrated that HEMA induced IL-1α release from keratinocytes and NAC inhibited IL-1α release through decreases in intracellular ROS and adduct formation with HEMA. Because of its volatility, HEMA is considered as an occupational hazard involved in asthma and nasal/respiratory symptoms as well as contact dermatitis in dental health workers (Jaakkola et al., 2007; Hagberg et al., 2005; Singh et al., 2013). IL-1α plays crucial roles in the cytokine cascade leading to allergic sensitization in a murine asthma model (Willart et al., 2012). These observations suggested that NAC may be a promising candidate for therapeutic agents against inflammation and allergy induced by HEMA.
We thank the Biomedical Research Core of Tohoku University Graduate School of Medicine for the flow cytometric analysis and histological analysis, and Dr. Lee S.H. (Department of Bio-analytical Chemistry, Tohoku University Graduate School of Pharmaceutical Science) for the mass spectrometric analysis. This work was supported in part by JSPS KAKENHI Grant Number JP16K11497 (T.K.), JP19K10067 (T.K.).
Conflict of interestThe authors declare that there is no conflict of interest.