Original Article
Lidocaine induces neurotoxicity in spinal cord neurons in Goto-Kakizaki rats via AMPK-mediated mitophagy
2023 年 48 巻 11 号 p. 585-595
詳細
2023 年 48 巻 11 号 p. 585-595
Objective. Lidocaine has been reported to induce neurotoxicity, which is further enhanced by high glucose levels. This study is aimed to explore the underlying mechanisms of lidocaine neurotoxicity in spinal cord neurons of diabetes. Methods. Take thirty specific pathogen-free (SPF) healthy Sprague-Dawley (SD) rats and thirty Goto-Kakizaki (GK) rats, aged 12 weeks, weighing 180-200 g. The spinal cord neurons of rats were isolated and cultured in vitro. Cell Counting Kit-8 was used to detect cell proliferation to determine the appropriate concentration and duration of lidocaine. Mitochondrial function was assessed using ATP content, cellular oxygen consumption rate, mitochondrial membrane potential, ROS production, and mitochondrial ultrastructure. Western blot was applied to detect the expression of autophagy- and mitophagy-related molecules PINK1, p-AMPK, LC-3II/LC3-I ratio and mTORC1. Immunofluorescent staining was used to detect the expression of PINK1 and LC3. Results. Lidocaine decreased cell viability of spinal cord neurons in concentration- and time-dependent manners. And lidocaine treatment aggravated mitochondrial dysfunction in GK rats. Furthermore, mitophagy was activated in diabetes, and lidocaine exposure up-regulated mitophagy. AMPK activator MK8722 aggravated mitochondrial damage, increased the expression of PINK1, p-AMPK, LC-3II/LC3-I ratio, and decreased the expression of mTORC1, while AMPK inhibitor Compound C and autophagy inhibitor Bafilomycin A1 reduced mitochondrial damage and decreased the expression of PINK1, p-AMPK, LC-3II/LC3-I ratio, and increased the expression of mTORC1. Conclusions. Lidocaine induced neurotoxicity of spinal cord neurons in GK rats via AMPK-mediated mitophagy.
Diabetes mellitus (DM) is considered a serious public health problem. Its most common complication, diabetic neuropathy, is mostly manifested by peripheral neuropathy (Dewanjee et al., 2018). With the rapid increase in the number of DM patients, the number of patients requiring surgical treatment rises as well.
Lidocaine is an amide local anesthetic widely used in clinical anesthesia. Numerous studies have indicated that lidocaine induces neurotoxicity, manifested as cauda equina syndrome and transient neurologic syndrome, and is more neurotoxic than other local anesthetics (Zaric and Pace, 2009; Koo et al., 2021). The mechanism underlying lidocaine-induced neurotoxicity, which may involve inflammatory response, autophagy, cellular Ca2+ homeostasis, and mitochondrial dysfunction, is yet to be determined (Kan et al., 2018; Xiong et al., 2017; Blas-Valdivia et al., 2007; Onizuka et al., 2011). There are also studies showing that lidocaine exhibits neurotoxicity by inducing apoptosis (Li et al., 2015; Xue and Wang, 2020). The neurotoxicity of local anesthetics is enhanced in diabetic neuropathy, but the precise mechanism remains undetermined. In diabetic neuropathy, local anesthetics increase nerve sensitivity, and peripheral nerve blocks are prolonged (Ten Hoope et al., 2018). In the previous study, we found that lidocaine induced apoptosis in spinal cord neurons from diabetic rats (Zheng et al., 2017). However, the mechanism of lidocaine-induced diabetic nerve injury is yet to be elucidated.
A growing number of studies have suggested that the occurrence of neurotoxicity of local anesthetics is associated with autophagy (Xiong et al., 2017; Lai et al., 2022). As a highly conserved metabolic process, autophagy recycles substances to allow cells to adapt to poor environments by degrading damaged organelles and proteins in cells (He et al., 2018). Under normal physiologic conditions, autophagy is kept at low levels, but stress or nutrient deficiency can activate autophagy to maintain normal cell function (Chmurska et al., 2021). However, excessive autophagy exacerbates neuronal injury. Zhang et al. proved that lidocaine could promote SH-SY5Y cell apoptosis by activating autophagy (Zhang et al., 2021). Mitophagy is a selective autophagy that specifically targets and removes damaged mitochondria (Gatica et al., 2018). Studies have further found that lidocaine-induced apoptosis is associated with mitochondrial pathways, and lidocaine reduces the mitochondrial membrane potential (Δψm) and induces ROS production in SH-SY5Y cells, thereby promoting apoptosis (Okamoto et al., 2016).
The present study aimed to investigate the role of mitophagy in lidocaine-induced diabetic spinal cord neurons injury by using Goto–Kakizaki (GK) rats (a diabetes model). We demonstrated that lidocaine induced neurotoxicity via AMPK-mediated mitophagy in spinal cord neurons under high glucose condition.
A total of 30 male specific pathogen-free normal rats and 30 GK rats with similar body weights (180–200 g) were purchased from the Laboratory Animal Science Department of Nanchang University. All experiments were performed with the approval of the Institutional Animal Care and Use Committee of the First Affiliated Hospital of Nanchang University, Jiangxi, China (CDYFY-IACUC-202206QR002). All animal experiments complied with the ARRIVE guidelines and were conducted in accordance with the United Kingdom Animals (Scientific Procedures) Act 1986 and the associated guideline and the EU Directive 2010/63/EU for animal experiments.
Culture of spinal cord neuronsTake thirty specific pathogen-free (SPF) healthy Sprague-Dawley (SD) rats and thirty Goto-Kakizaki (GK) rats, aged 12 weeks, weighing 180-200 g. Rats were sacrificed by decapitation under anesthesia with 1% sodium pentobarbital (50 mg/kg). Their spinal cords were isolated and collected. Spinal cord neurons were isolated with mixed collagenase (Beyotime, China) for 20 min in an incubator at 37°C. They were then mixed and cultured in a high-glucose DMEM medium including 10% fetal bovine serum (Lonsera, China) and penicillin–streptomycin (Biosharp, China) in an incubator with 5% CO2 at 37°C.
Assessment of cell viabilityCell viability in rat spinal cord neurons was assessed using the Cell Counting Kit-8 (CCK-8, Beyotime C0037, China) in accordance with the manufacturer instructions. The spinal cord neurons were cultured in 96-well plates with a density of 1 × 10⁴ cells/well. The neurons were treated with lidocaine with different concentrations (0.5, 1, 2, 4, and 8 mM) and then cultured for different lengths of time (24, 48, and 72 hr) in an incubator with 5% CO2 at 37°C. Then, the neurons were cultured with 20 µL kit solution, and incubated for 3 hr. Absorbance was measured at 450 nm wave length. The IC50 of lidocaine was calculated based on CCK-8.
Experimental groupsThe neuronal cells were divided into six groups, each with the same number: the normal rat spinal cord neuron group (control group); the GK rat spinal cord neuron group (GK group); the GK + lidocaine group (GL group); the GK + lidocaine + MK8722 group (GLM group); the GK + lidocaine + Compound C group (GLC group); and the GK + lidocaine + Bafilomycin A1 group (GLB group). Cell viability evaluation indicated that the concentration of the lidocaine added to the neurons was 2 mM, and culture time was 24 hr.
Detection of ATPIntracellular ATP content was assessed using the ATP content assay kit (Solarbio BC0305, China) in accordance with instruction. The neurons were collected in centrifuge tubes, and the extract solution was added, based on cell number (units): extract solution (mL) ratio to 5 × 10⁶: 1. The cells were disrupted using an ultrasonic pulverizer (power, 200 W; working time, 2 sec/time; and interval time, 1 sec) for 1 min, submerged in an ice bath. The cell disruption fluid was then centrifuged at 10000 g and 4°C for 10 min. The supernatant was removed and then mixed with 500 µL of chloroform. The mixture was again centrifuged, and the supernatant was removed for detection. ATP content was detected at 340 nm by a microplate reader (Thermo MK3, China).
Detection of total cellular oxygen consumption rate (OCR)The cell oxygen consumption rate assay kit (Bestbio BB-48211, China) was used to detect the total cellular oxygen consumption rate (OCR). The neuronal cells were washed with PBS. The cells (5 × 10³ cells/ well) were transferred to a 96-well plate with 100 µL fresh medium. Subsequently, 4 µL oxygen fluorescent probe (R01) and 100 µL oxygen blocking buffer were added to each well. The OCR levels were examined every 80 sec until 2 hr with a microplate reader (Molecular Devices SpectraMax®i3, USA). The excited and emitted wavelengths were 468 nm and 603 nm.
Determination of mitochondrial membrane potential (Δψm)Δψm was determined using the JC-1 probe equipped with a mitochondrial membrane potential detection kit (Solarbio M8650, China). Neuronal cells (5 × 10³ cells /well) were removed to add 2 µM JC-1 probe and were incubated at 37°C for 30 min in a dark environment. The cells were then washed with PBS, and the nuclei were labeled with Hoechst 33342 (Beyotime C1022, China). The fluorescence intensity was observed and photographed under an inverted photo microscope (OLYMPUS, IX71, Japan). Δψm was calculated as the red/green fluorescence intensity ratio.
Detection of reactive oxygen species (ROS)Neuronal cells were seeded on 96-well plates for ROS detection. Cell concentration was adjusted to 1 × 10⁶ cells/mL. The neuronal cells were suspended in the ROS dye DCFH-DA (10 µmol/L, Beyotime, S0033S1, China), diluted with a serum-free medium, and incubated in an incubator for 20 min at 37°C The cells were washed with a serum-free cell culture medium and then incubated in the incubator for 10 min after Hoechst 33342 was added to the cells. The cells were washed again and placed in the complete medium. The fluorescence intensity was observed and photographed under an inverted photo microscope. Subsequently, the fluorescence intensity was analyzed using the Image J software.
Examination of the mitochondrial ultrastructureNeuronal cells were fixed with 2.5% glutaraldehyde (Alfa Aesar, China) for 4 hr at 4°C and then centrifuged at 1000 g. The cells were fixed again with glutaraldehyde for 3 hr at 4°C and then with 1% osmium tetroxide for 2 hr at room temperature. Subsequently, the cells underwent ethanol gradient dehydration, acetone: Epon 812 (1:1) permeabilization, Epon 812 embedding, polymerization at 60°C for 48 hr, positioning of semithin sections, and ultrathin sectioning (60–80 nm). The sections were double-stained with 2% uranyl acetate and lead citrate for 15 min each. The mitochondrial ultrastructure was observed by transmission electron microscopy (FEI Tecnai G20 TWIN, USA).
Western blot analysisNeuronal cells were lysed with a prechilled RIPA lysis buffer to which PMSF was added. After the cells were centrifuged at 12000 g for 10 min, the protein concentration was determined using a BCA protein quantification kit (Biosharp BL521A, China). A marker and 25 µg of the protein samples were separated using 10% sodium dodecyl sulfate–polyacrylamide gel and then transferred to PVDF membranes. The membranes were rinsed with 1 × TBST and blocked with BSA for 2 hr at 37°C. They were then blotted with primary antibodies overnight at 4°C: PINK1 (1:1000, Beyotime AF7755, China), p-AMPK (1:1000, Abcam abl133448, China), LC-3II/LC3-I (1:1000, Proteintech 146001-1-AP, China), mTORC1 (1:1000). The membranes were blotted with HRP-labeled secondary antibodies (goat anti-rabbit IgG, 1:5000, Zhongshanjinqiao ZB2301, China) for 1 hr at 37°C. The protein bands were developed by enhanced chemiluminescence. Grayscale analysis of protein bands was performed using Image J software.
Immunofluorescence stainingThe cell slides were washed with PBS and then fixed with 4% paraformaldehyde for 15 min. The cells were permeabilized with 0.1% Triton X-100 for 10 min at room temperature. They were then incubated with 5% FBS for 1 hr at 37°C in a dark environment. Subsequently, the cells were incubated with the primary antibodies PINK1 (1:100, Beyotime AF7755, China) and LC3 (1:100, Santa sc-271625, USA) overnight at 4°C; they were then incubated with goat anti-rabbit Cy3 (Proteintech SA00009-2, USA) and goat anti-mouse FITC (Proteintech SA00003-1, USA) secondary antibodies for 1 hr at 37°C in a dark environment. The cells were incubated with Hoechst33258 (Beyotime C1017, China) for 15 min at room temperature in a dark environment. Fluorescence intensity was observed and photographed under a laser confocal microscope (Leica TCS SP8, Germany) and analyzed using Image J software.
Statistical analysisThe data collected were statistically analyzed using the software Origin 6.1. The measurement data were represented by mean ± SD. A t-test was used to compare in two groups. Comparisons between multiple groups were analyzed by ANOVA. P < 0.05 was considered statistically significant.
We assessed cell viability by using the CCK-8 assay to determine the appropriate concentration of lidocaine. We observed that lidocaine treatment significantly reduced the OD values of spinal cord neurons. Lidocaine decreased cell viability in spinal cord neurons in concentration-dependent manners (Figs. 1(a) and 1(b)). And with the increase of culture time, the inhibitory effect of lidocaine on spinal cord neurons also increased. However, lidocaine caused more severe damage in spinal cord neurons in GK rats than in the normal rats. We calculated the IC50 of lidocaine at 3 time points, as follows: in normal rats, 3.598 mM (24 hr), 3.293 mM (48 hr), and 2.841 mM (72 hr); in GK rats, 3.123 mM (24 hr), 2.722 mM (48 hr), and 2.316 mM (72 hr). In cell viability analysis, lidocaine inhibited neuronal cells by more than 50%, and caused severe cell damage regardless of the time point at concentrations of 4 and 8 mM. Therefore, the two concentrations were not suitable for subsequent experiments. However, the inhibition rate was 30%-40% for the neuronal cells treated with lidocaine at 2 mM at 3 time points. Lidocaine at 2 mM exerted a certain inhibitory effect on neuronal cells but caused no serious damage to cells, as determined by the state of the cells and IC50. Therefore, we chose lidocaine at 2 mM for 24 hr to conduct subsequent experiments by considering the above comprehensively.
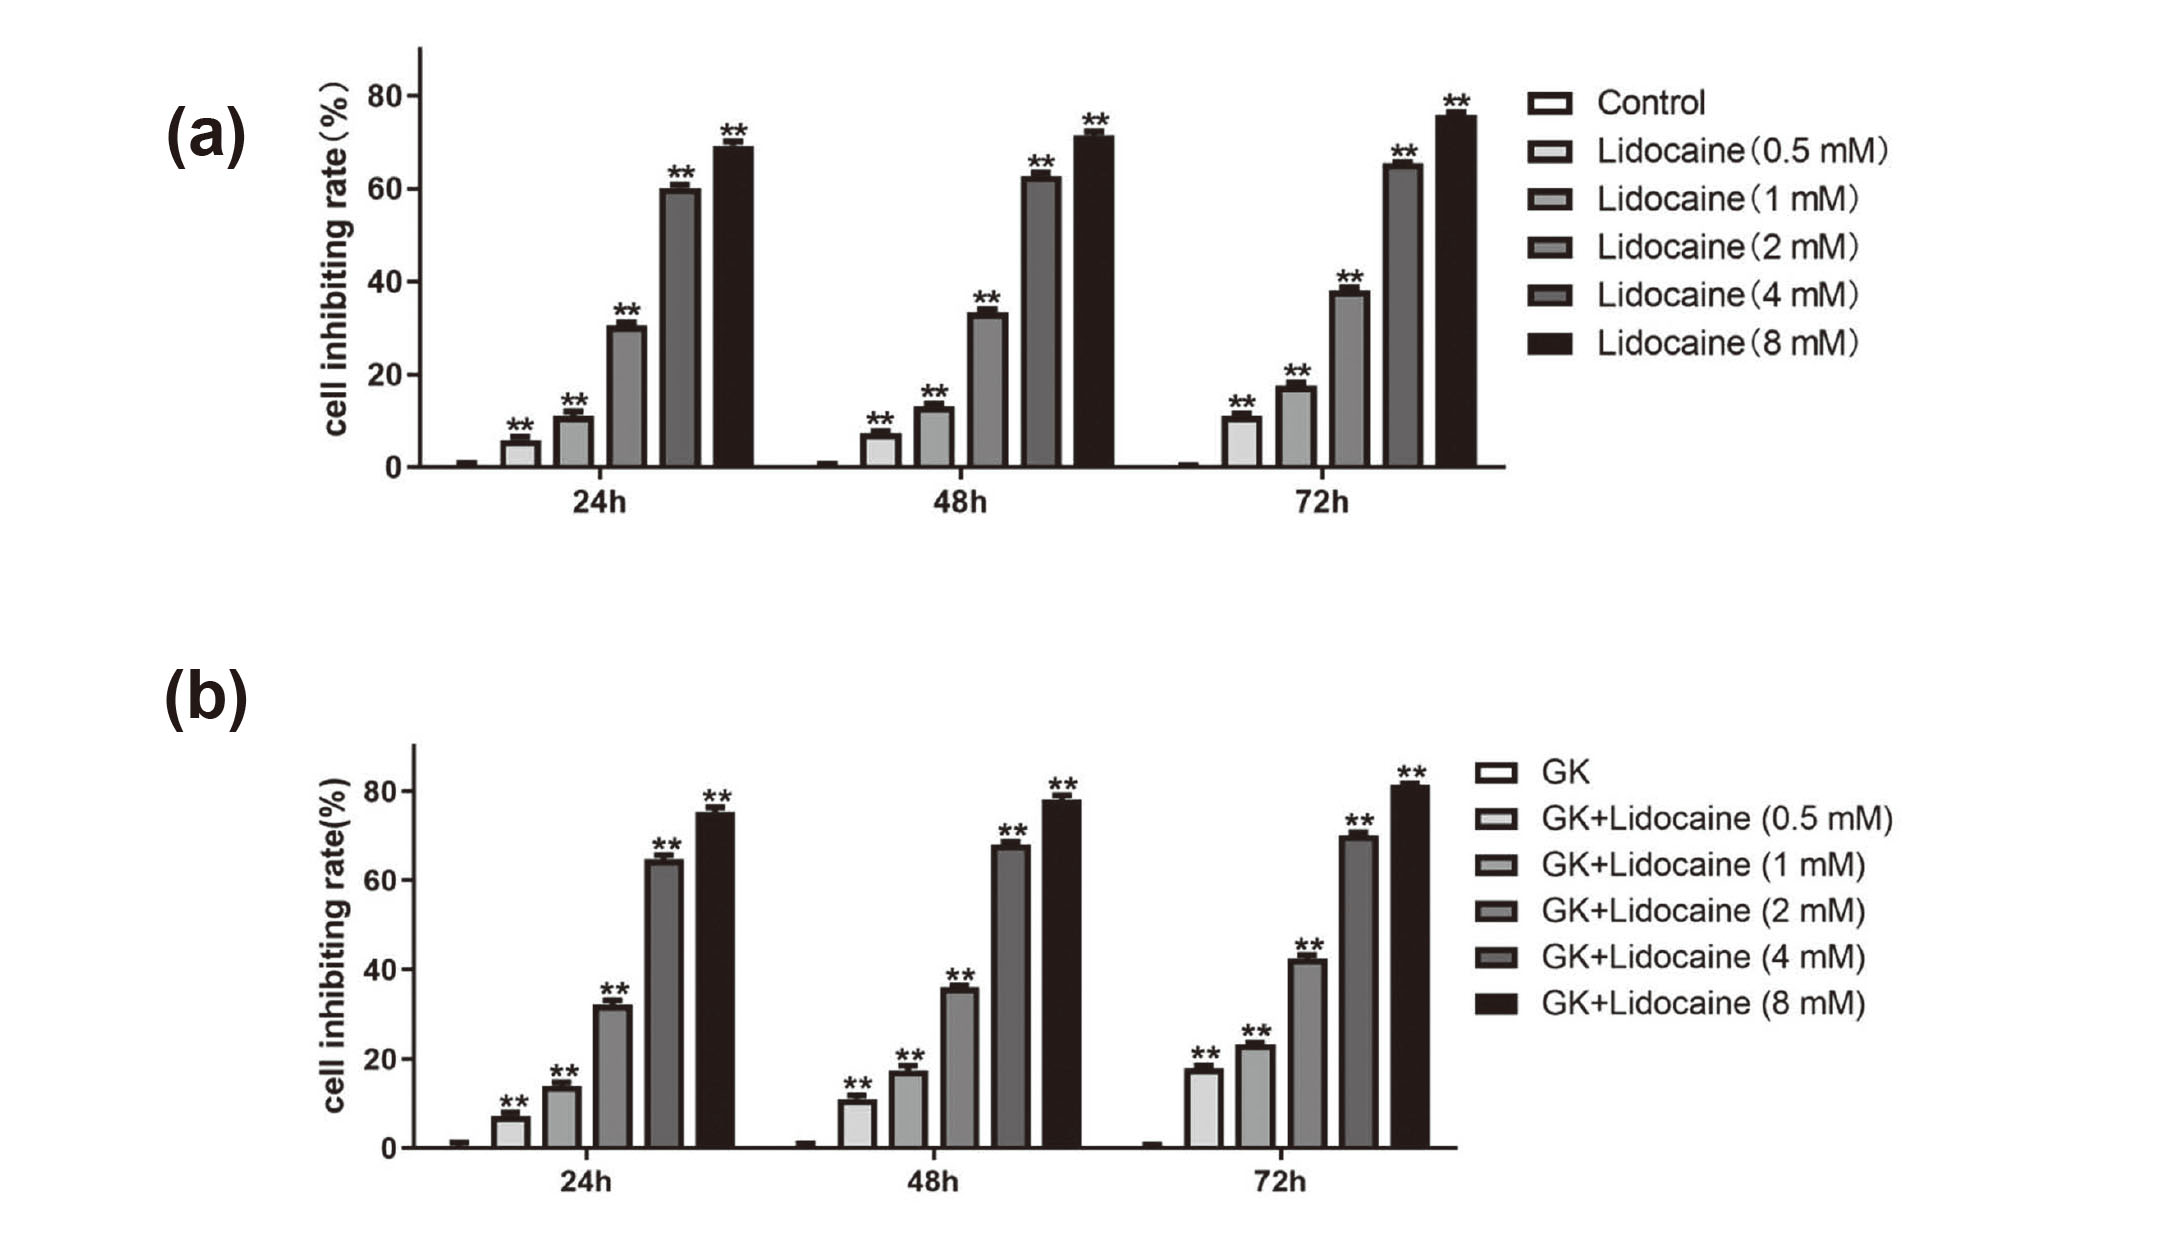
Lidocaine reduced cell viability in rat spinal cord neurons. (a) Cell viability of normal rat spinal cord neurons treated with lidocaine at different concentrations (0.5, 1, 2, 4, and 8 mM) for different lengths of time (24, 48, and 72 hr). (b) GK rat spinal cord neurons treated the same as above. Compared with the control group, **P < 0.01.
ATP content and total cellular oxygen consumption rate were used to evaluate the effects of lidocaine on cellular metabolic function. Relative to those in the control group, ATP content and total cellular oxygen consumption rate in the GK group significantly decreased (Figs. 2(a), 2(b) and 2(c)). ATP content and total cellular oxygen consumption rate in the GL group significantly decreased. Compared with the GL group, the group treated with MK8722 (an AMPK activator) showed lower ATP content and total cellular oxygen consumption rate, whereas the group treated with Compound C (an AMPK inhibitor) and Bafilomycin A1 (a late autophagy inhibitor) showed higher ATP content and total cellular oxygen consumption rate.

Effects of lidocaine on energy metabolism in spinal cord neurons. (a) Determination of ATP content in the control, GK, GL, GLM, GLC, and GLB groups. (b) Fluorescence of the oxygen probe in neurons was monitored for 2 hr. (c) OCR levels were detected. Compared with the control group, **P < 0.01; compared with the GK group, ##P < 0.01; compared with the GL group, $P < 0.05 and $$P < 0.01.
To explore lidocaine-induced neurotoxicity, mitochondrial function was assessed based on Δψm, ROS, and the mitochondrial ultrastructure. Relative to those in the control group, Δψm significantly decreased (Figs. 3(a) and 3(b)) and ROS levels increased in the GK group (Figs. 4(a) and 4(b)), and in addition, lidocaine treatment significantly decreased Δψm and increased ROS levels in the GL group. Treatment with MK8722 decreased Δψm, but treatment with Compound C and Bafilomycin A1 increased Δψm, relative to those in the GL group. Similarly, ROS levels increased with MK8722 treatment but decreased after treatment with Compound C and Bafilomycin A1 relative to that in the GL group. The mitochondrial ultrastructure was observed by a transmission electron microscopy. The mitochondrial structure remained intact, and the cristae were well-ordered in the Control group. Mitochondrial cristae abundance decreased in the GK group. However, spinal cord neurons treated with lidocaine showed lower mitochondrial cristae abundance than the GK group. Compared with that in the GL group, the abundance of mitochondrial cristae in the GLM group was lower, whereas those in the GLC and GLB groups were higher (Fig. 5). These results indicate that mitochondrial activity in neurons from diabetes was impaired, and lidocaine exacerbated mitochondrial damage and dysfunction. Further, the damage induced by lidocaine was aggravated via AMPK activation in the GLM group but was reduced by inhibiting AMPK and autophagy.
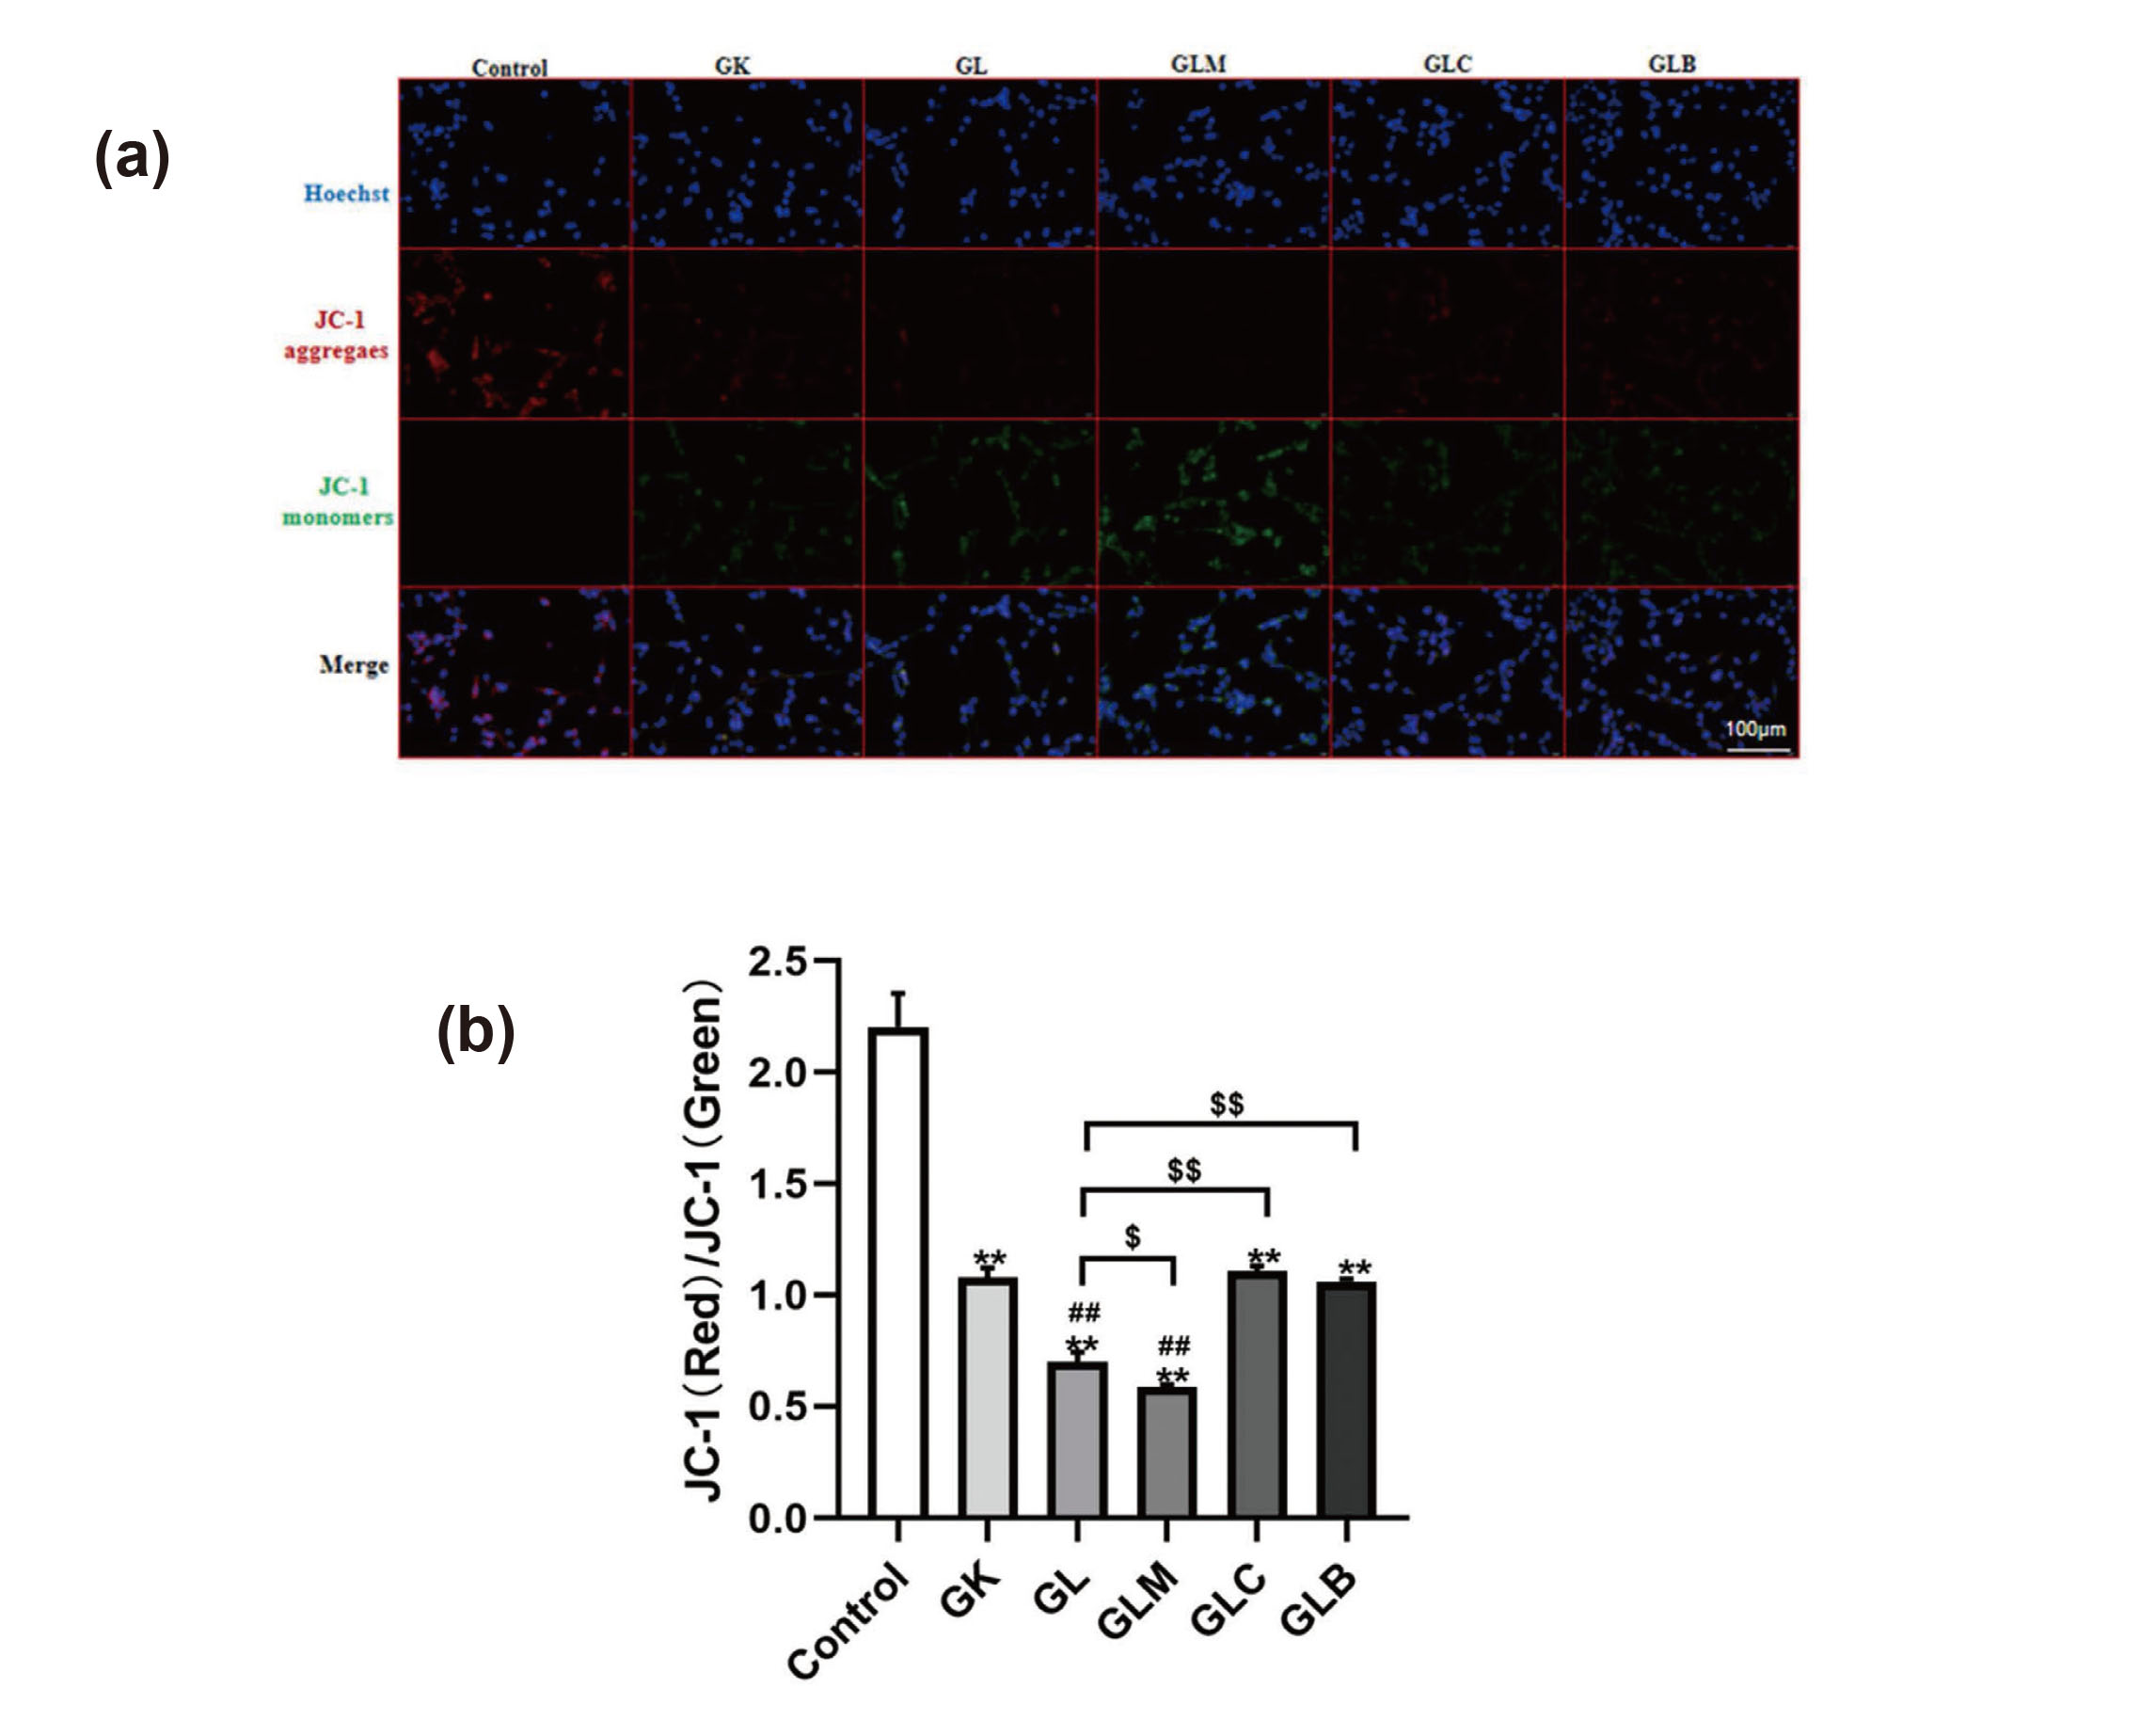
Mitochondrial membrane potential (Δψm) detected using the JC-1 detection kit (400X). (a) Fluorescence intensity of Δψm. (b) Fluorescence intensity of Δψm was analyzed using the Image J software. Compared with the control group, **P < 0.01; compared with the GK group, ##P < 0.01; compared with the GL group, $P < 0.05 and $$P < 0.01.
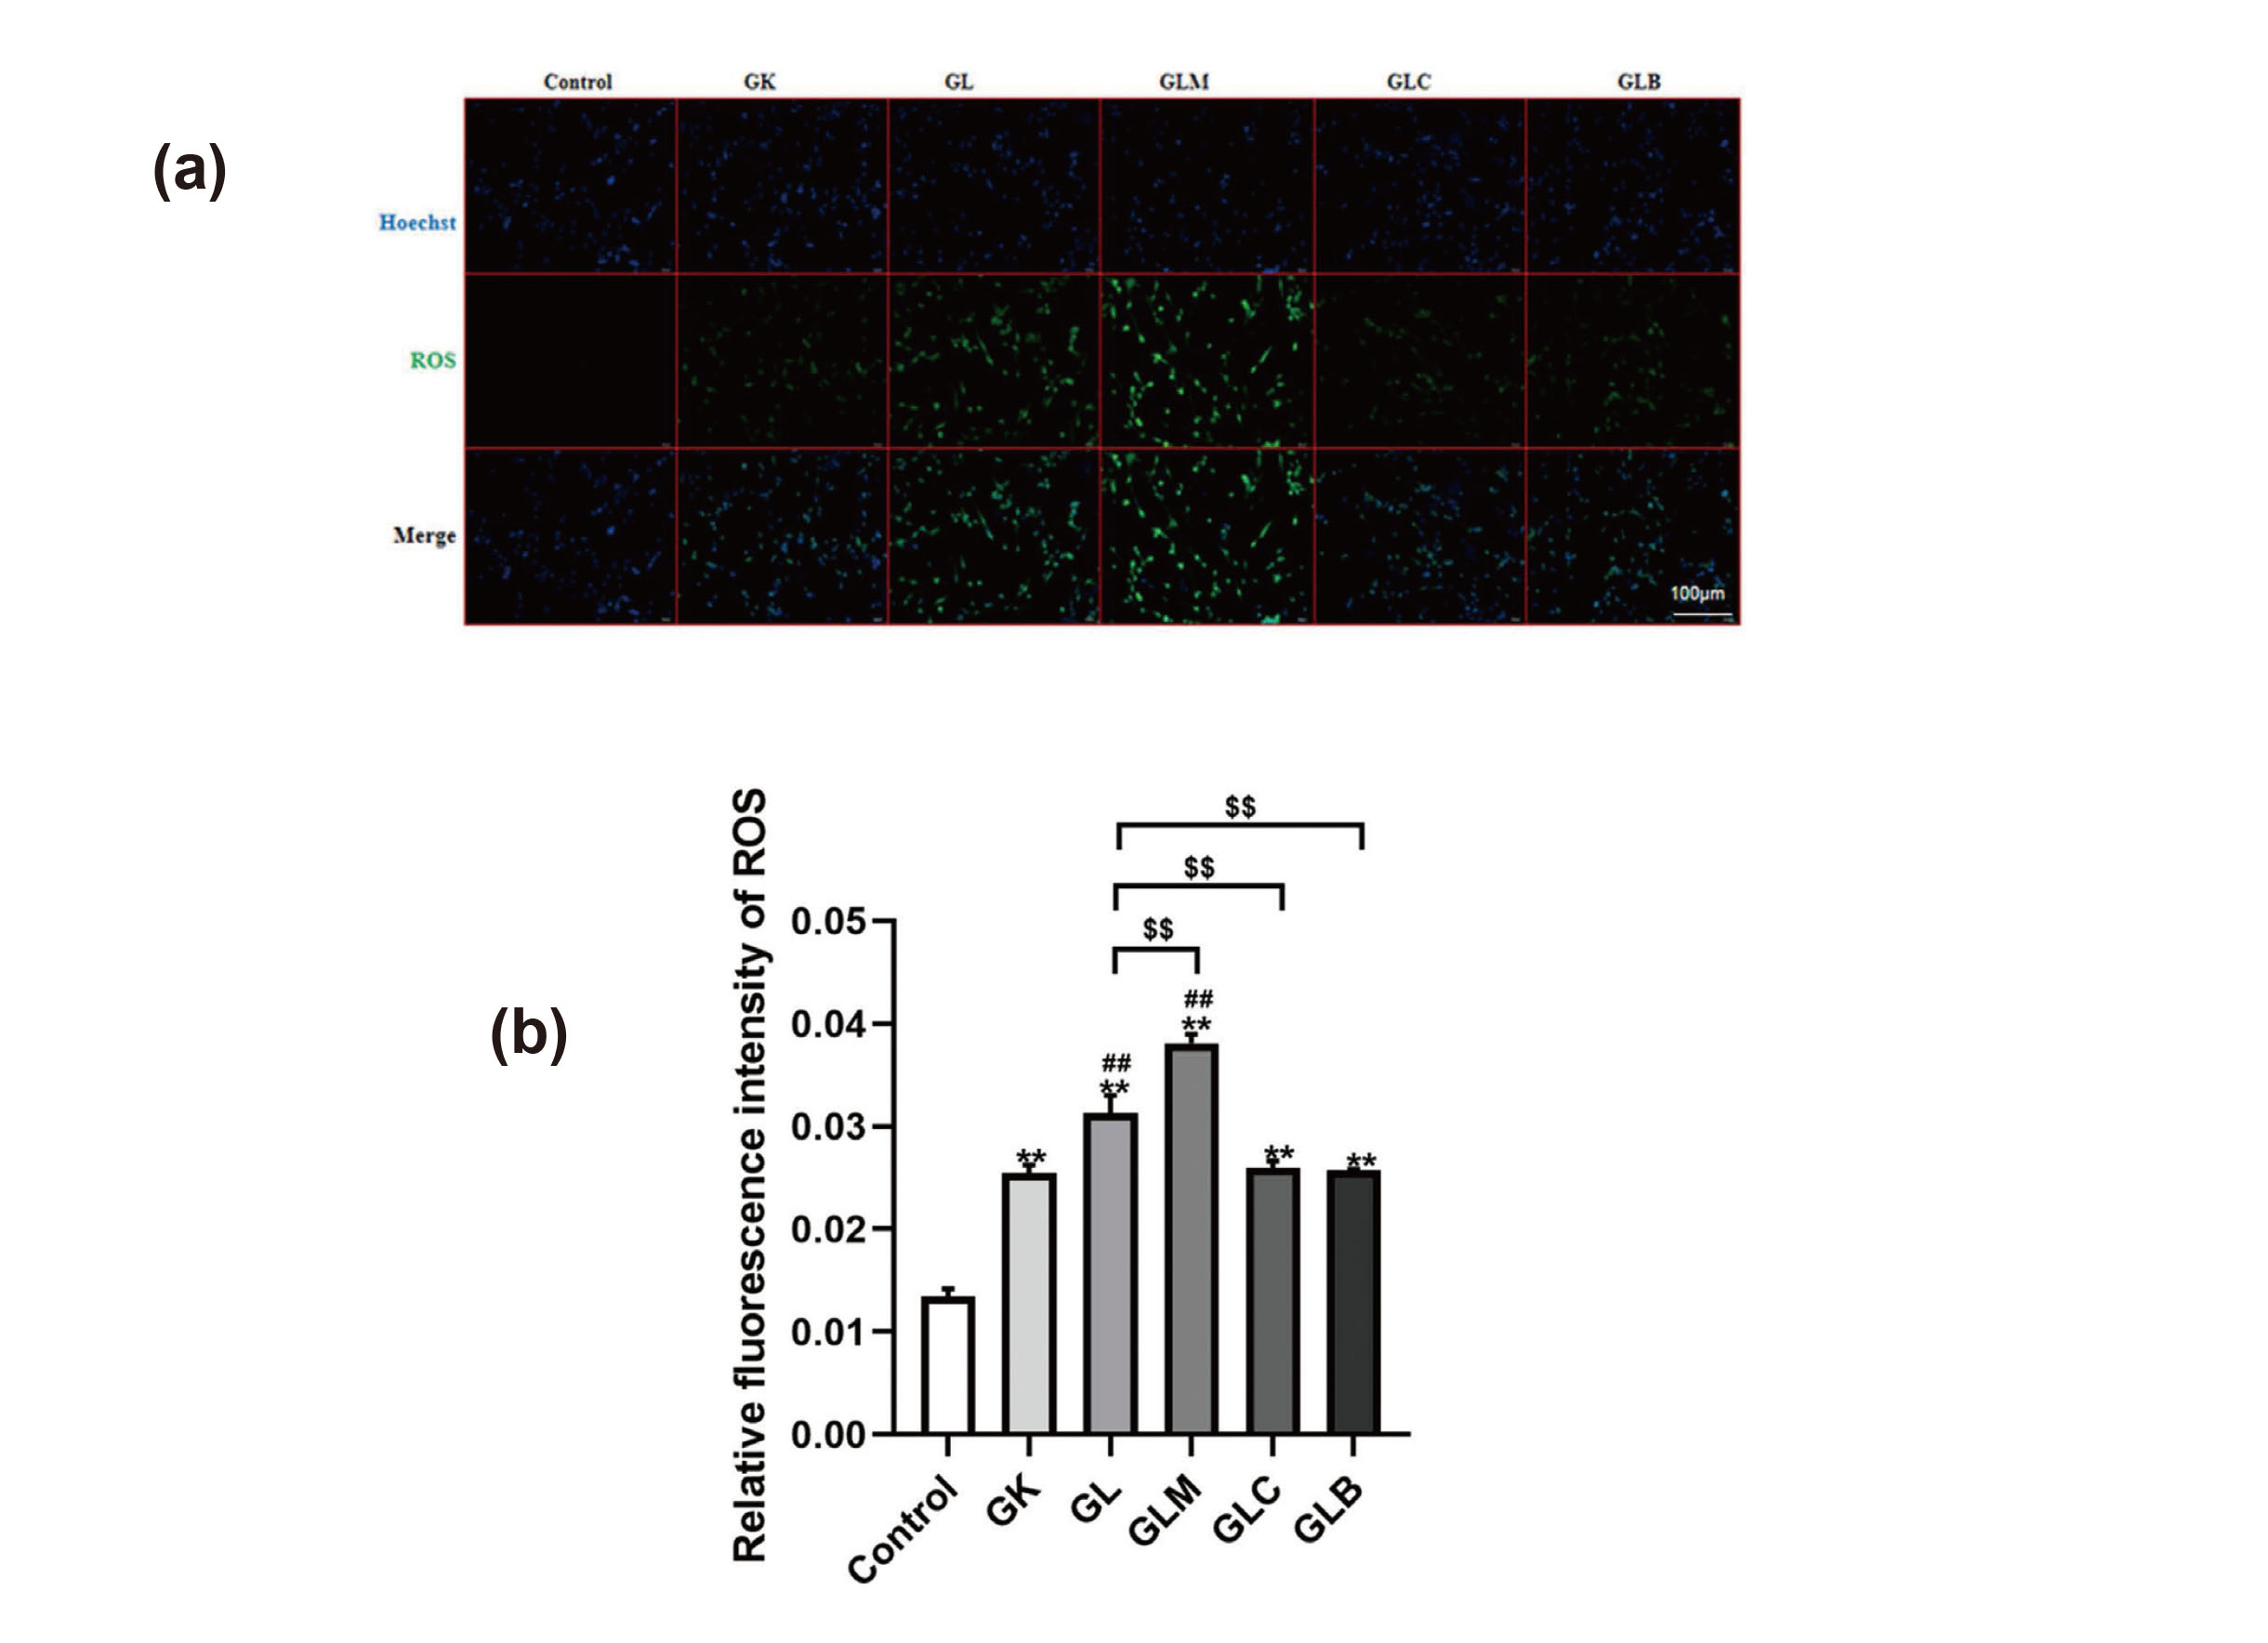
Detection and quantification of ROS levels (200X). (a) Fluorescence intensity of ROS. (b) Fluorescence intensity of ROS was analyzed using the Image J software. Compared with the control group, **P < 0.01; compared with the GK group, ##P < 0.01; compared with the GL group, $$P < 0.01.

Mitochondrial ultrastructure (12K). The arrows point to mitochondria. Mitochondrial cristae were well-ordered in the Control group. The abundance of mitochondrial cristae in the GK group is lower than the Control group. In the GL group, the structure of mitochondrial cristae was disrupted. Compared with the GL group, the abundance of mitochondrial cristae in the GLM group was lower, whereas those in the GLC and GLB groups were higher.
To assess the possible effects of lidocaine on mitophagy, we examined autophagy- and mitophagy-related proteins by Western blot analysis and immunofluorescence staining. The PINK1, p-AMPK, and LC-3II/LC3-I ratio increased, whereas mTORC1 decreased in the GK group relative to the control group (Figs. 6(a), (b), (c) and (d)). Lidocaine elevated the PINK1, p-AMPK, and LC-3II/LC3-I ratio and decreased mTORC1 expression in the GL group relative to the GK group. Treatment with MK8722 increased PINK1 expression, p-AMPK expression, and the LC-3II/LC3-I ratio while decreasing mTORC1 expression, relative to those in the GL group. By contrast, treatment with Compound C and Bafilomycin A1 decreased PINK1 expression, p-AMPK expression, and the LC-3II/LC3-I ratio but increased mTORC1 expression. Immunofluorescence staining further demonstrated that lidocaine treatment increased the expression of autophagy-related protein LC3 and mitophagy protein PINK1 (Figs. 7(a), 7(b) and 7(c)). The results of immunofluorescence staining were consistent with Western blot analysis.
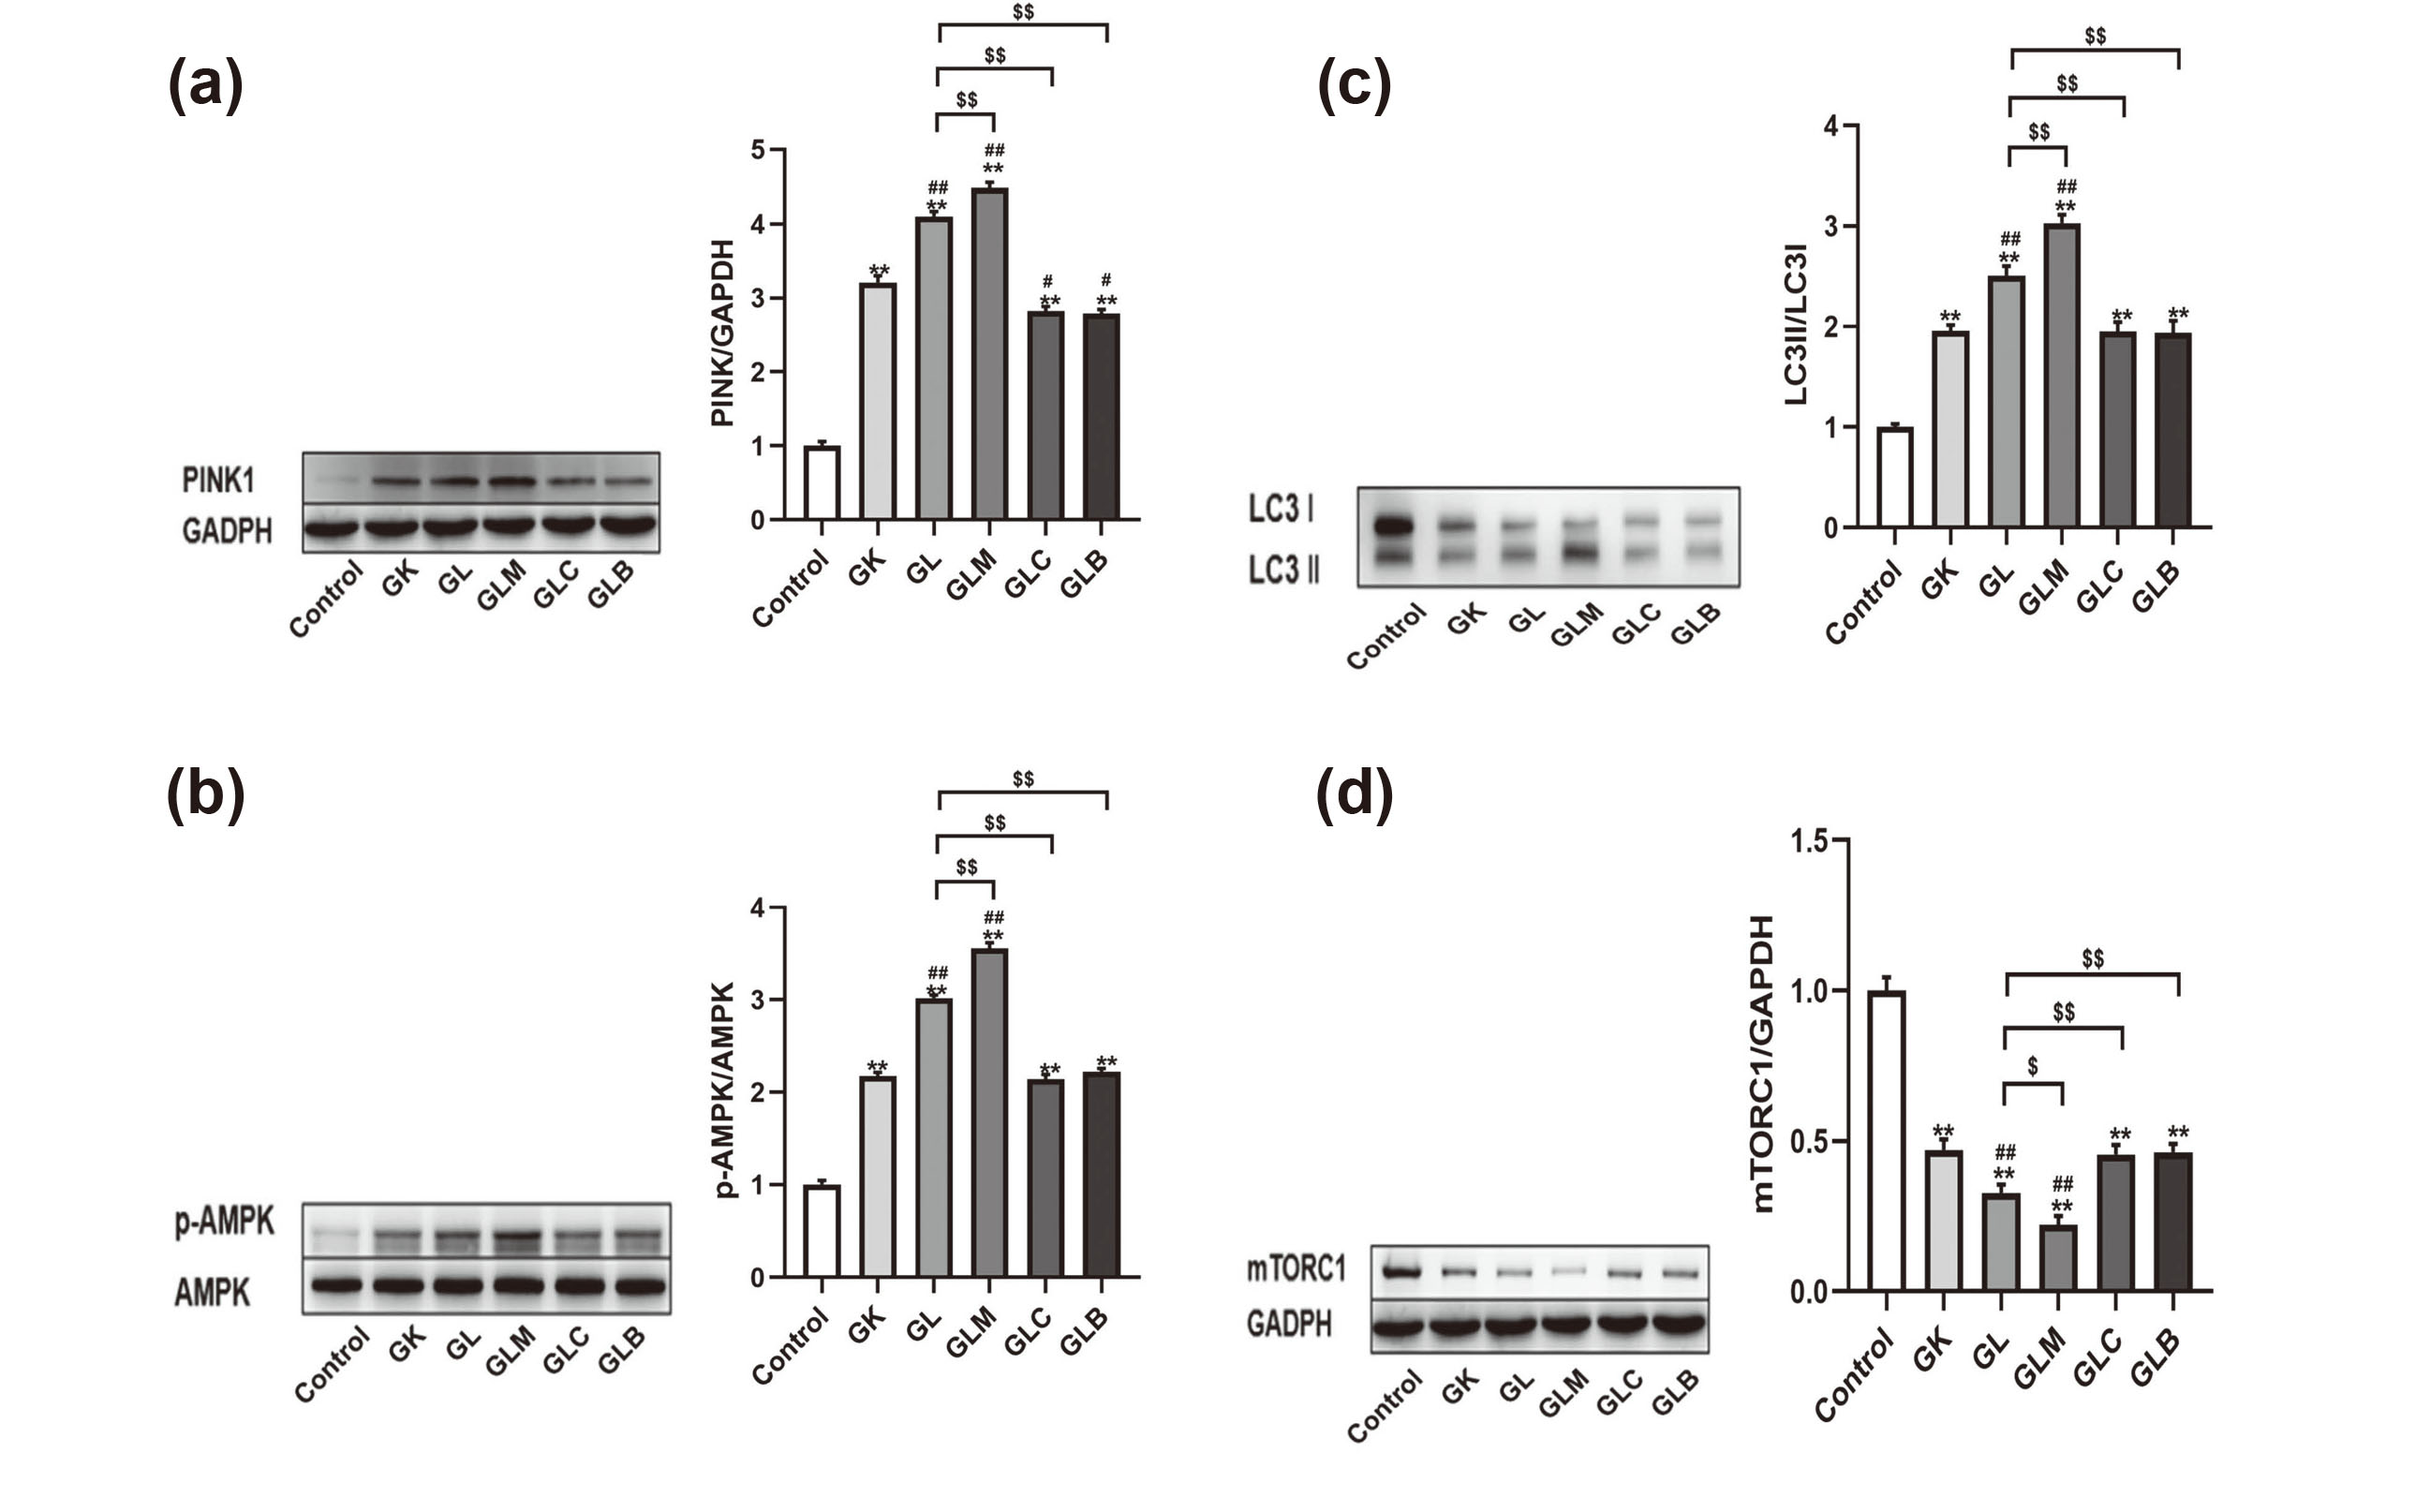
(a-d) Expression of autophagy- and mitophagy-related proteins PINK1, p-AMPK, LC3, and mTORC1, detected by Western blot analysis, and gray value quantification measured using Image J. Compared with the control group, **P < 0.01; compared with the GK group, ##P < 0.01; compared with the GL group, $P < 0.05 and $$P < 0.01.
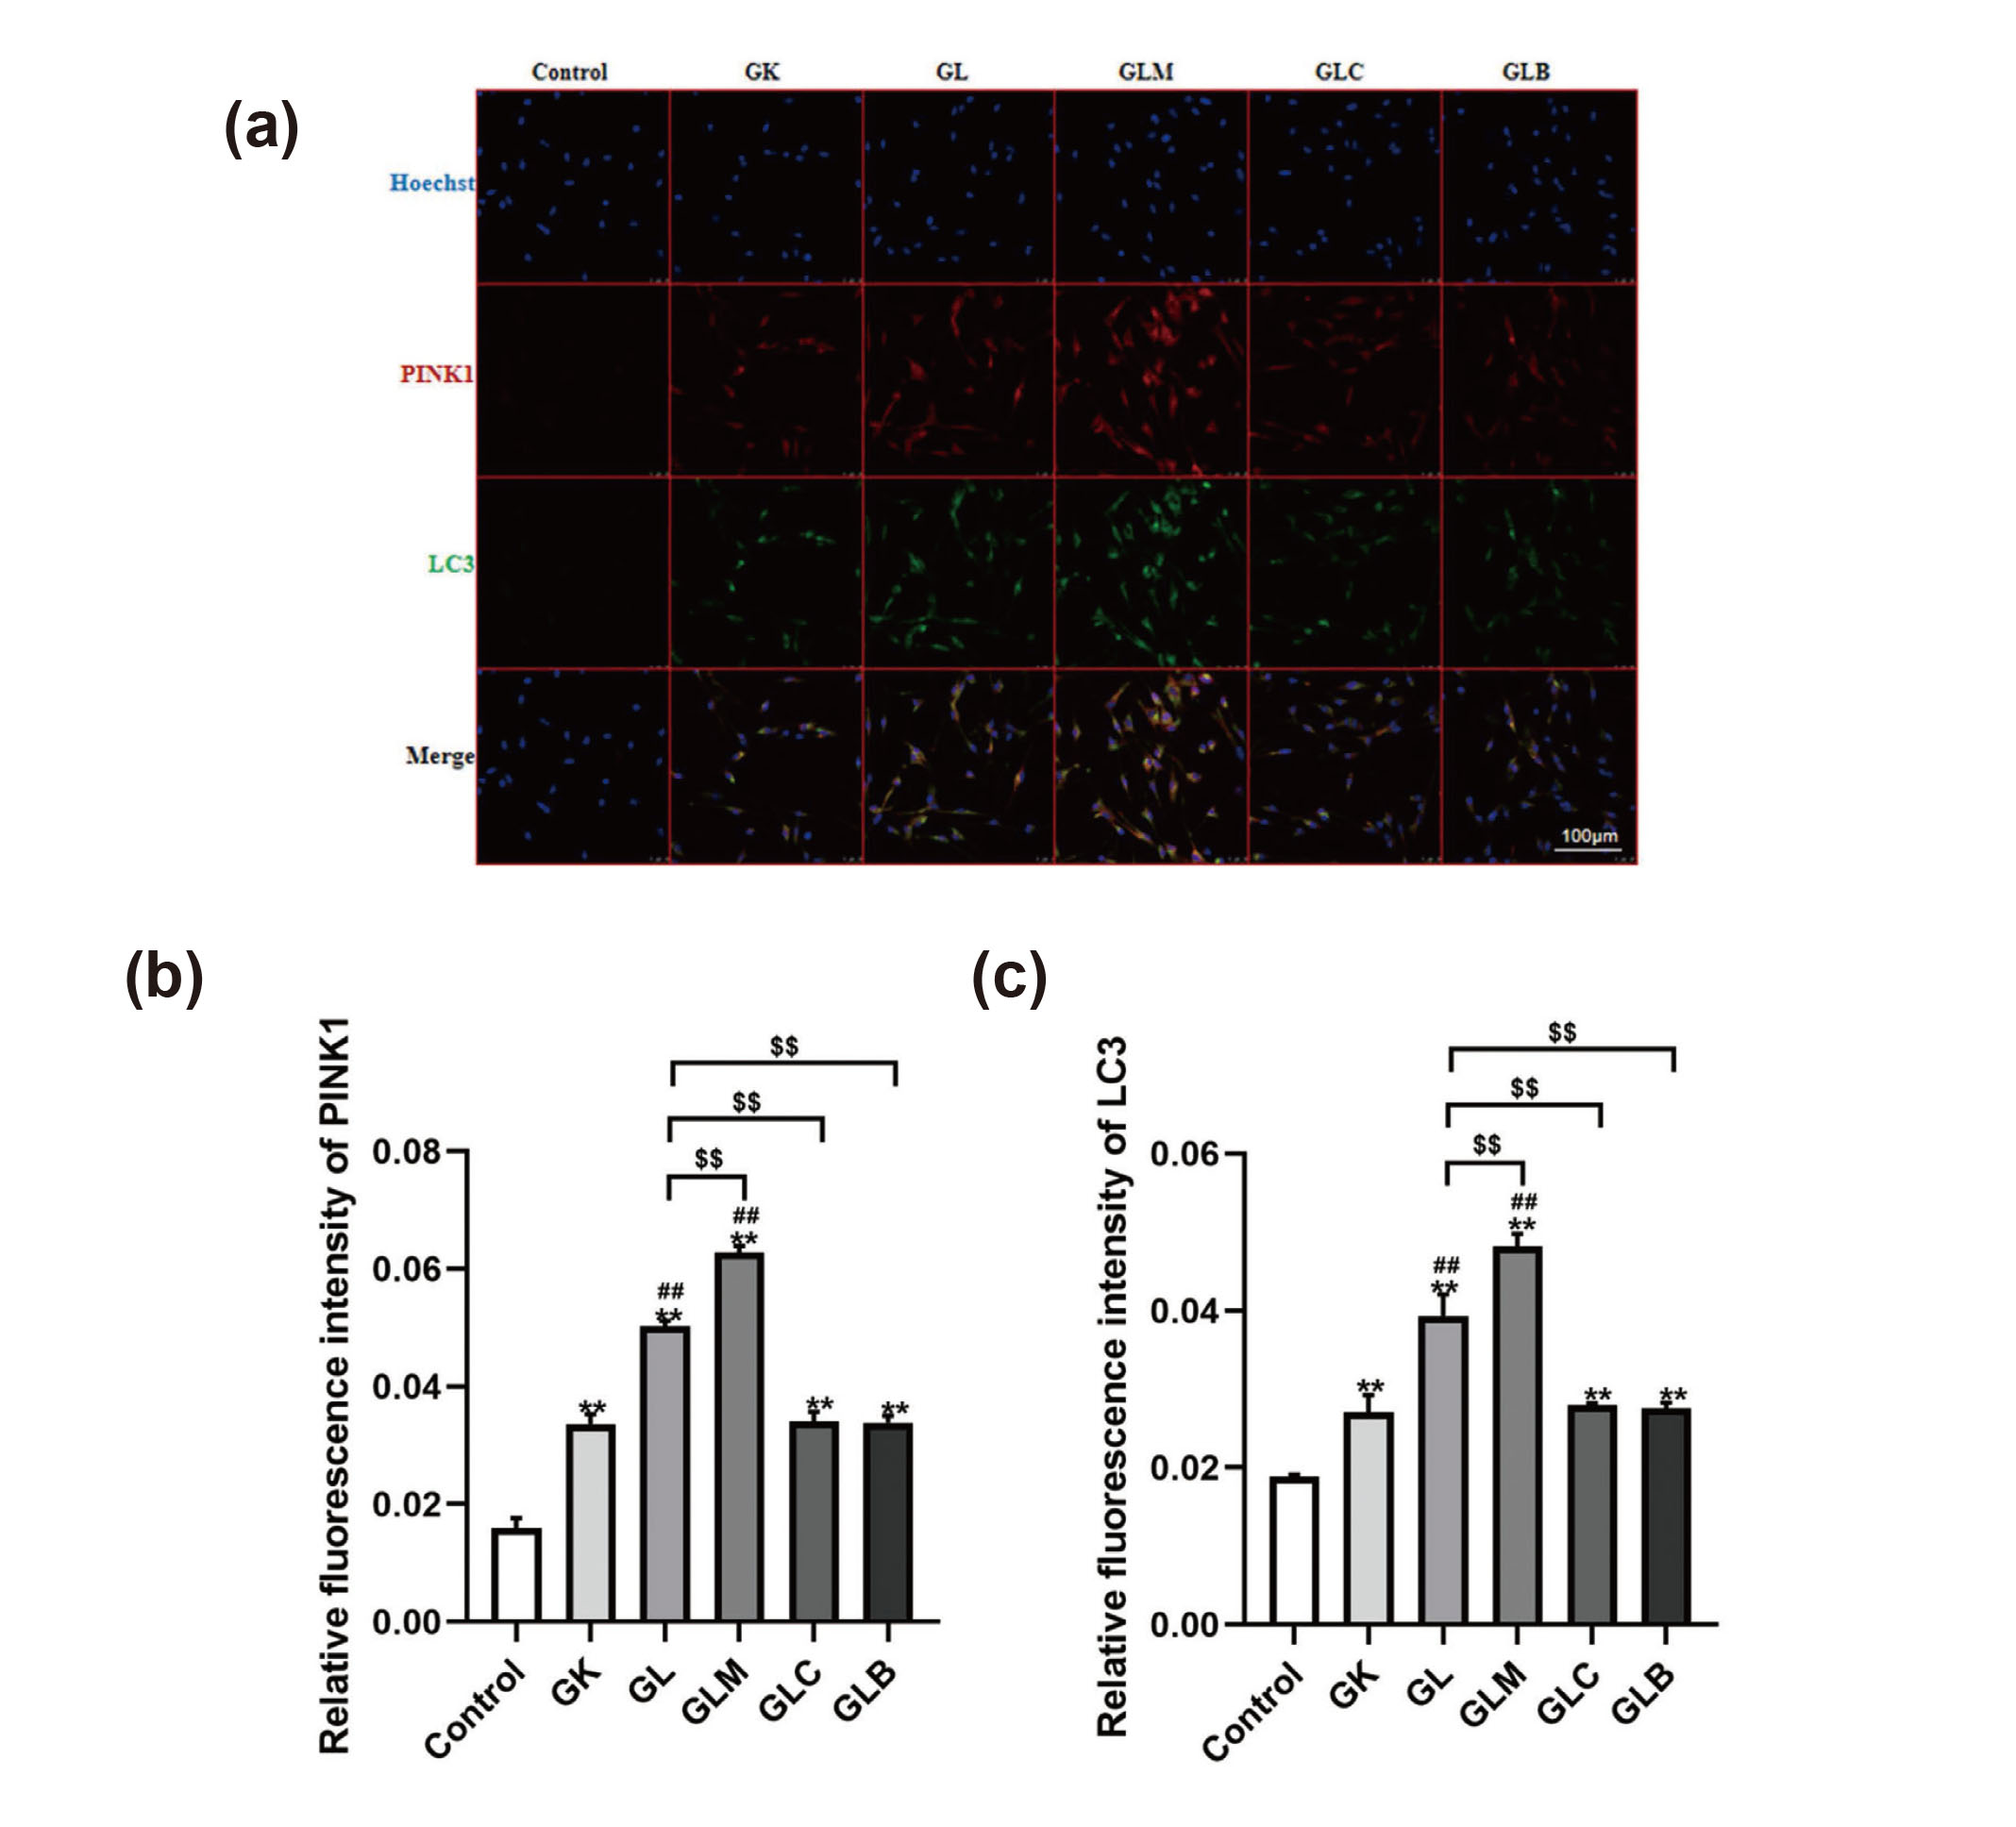
(a) Immunofluorescence staining was used to detect the expression of autophagy- and mitophagy-related proteins LC3 and PINK1 (400X). (b) Fluorescence intensity quantification of PINK1 were measured using Image J. (c) Fluorescence intensity quantification of LC3 were measured using Image J. Compared with the control group, **P < 0.01; compared with the GK group, ##P < 0.01; compared with the GL group, $$P < 0.01.
Lidocaine is one of the most commonly used local anesthetics in clinical anesthesia and has been shown to be highly neurotoxic. The neurotoxicity of local anesthetics has been shown to be enhanced in a hyperglycemic environment (Li et al., 2021). In a previous study, we found that hyperbaric lidocaine via intrathecal injection induced apoptosis in rats with diabetic neuropathic pain (Zheng et al., 2017). To explore the mechanism underlying of lidocaine neurotoxicity in diabetic nerves, we performed experiments using spinal cord neurons from GK rats as a cell model in the present study. Our study revealed that lidocaine induces neurotoxicity in spinal cord neurons of diabetic rats via AMPK-mediated mitophagy.
In the current study, we assessed the effects of lidocaine on spinal cord neurons from normal and GK rats. The results showed that lidocaine decreased cell viability in neurons in concentration-dependent manners. This result proved that lidocaine exhibited neurotoxicity. On the basis of the state of cells in pre-experiments, we observed that cell viability of spinal cord neurons decreased more severely in GK rats than in normal rats. The IC50 of lidocaine in normal rats was greater than that in GK rats at the same time point. This may be that diabetes itself makes spinal cord neurons more sensitive to lidocaine. Spinal cord neurons of diabetes are more vulnerable to lidocaine. Lidocaine aggravated neuronal damage in diabetes. We determined the experimental concentration and duration of lidocaine through the pre-experiment. The result was consistent with the study on lidocaine-treated SH-SY5Y cells by Zhang et al. (2021). Mitochondria are the masters of cellular energy metabolism and play a key role in maintaining normal cell function. They form a dynamic network and regulate the life and death of cells via cell fission and cell fusion (Abate et al., 2020). Mitophagy, as a selective autophagy, plays a critical role in regulating mitochondrial quality control. When mitochondria are dysfunctional and cannot be restored to the normal state, they are selectively removed by mitophagy (Pickles et al., 2018). Considerable loss of mitochondrial function activates excessive mitophagy, which can lead to cell damage and even apoptosis. Mitochondrial dysfunction and oxidative stress participate in the pathogenesis of diabetic neuropathy (Rashedinia et al., 2020; Kalvala et al., 2020). In the current study, we examined mitochondrial function via ATP content, Δψm, OCR, ROS, and mitochondrial ultrastructure. The results showed that mitochondrial function was damaged in spinal cord neurons of GK rats, suggesting that diabetes itself caused mitochondrial damage. In addition, we found that mitochondrial damage was further aggravated after treatment with lidocaine. Our results showed that lidocaine exacerbated mitochondrial damage and dysfunction in spinal cord neurons in GK rats.
During autophagy, LC3 is cleaved by Atg4B to generate LC3-I, which binds to phosphatidylethanolamine to form LC-3II. LC-3II is involved in the formation of autophagosomes and is therefore considered an important marker of autophagosomes (Mizushima and Levine, 2020). However, mTORC1 negatively regulates autophagy (Al-Bari and Xu, 2020). Evidence suggests that neurotoxic substances lead to neuronal death via excessive mitophagy (Yu et al., 2020). Mitophagy has a complex molecular mechanism. The ubiquitin kinase PINK1 phosphorylates ubiquitin to recruit parkin (an E3 ubiquitin ligase) into mitochondria and mediate mitophagy (Lazarou et al., 2015). AMPK is further considered a cellular energy sensor, and the AMPK/ULK1 axis is involved in multiple stages of mitophagy independent of the PINK1/Parkin pathway (Seabright et al., 2020). The study has shown that AMPK/ULK1 pathway mediates an early step in mitophagy through the phosphorylation of Ser108 in the ACT domain of Parkin (Hung et al., 2021). However, mitophagy activation via the AMPKα2 pathway in cardiomyocytes has been demonstrated, and the AMPKα2 pathway interacts with the PINK1-Parkin-SQSTM1 pathway (Wang et al., 2018). In the current study, we demonstrated that the expression of mitophagy-related proteins PINK1, p-AMPK, and the LC-3II/LC3-I ratio increased, whereas the autophagy negative regulator mTORC1 decreased in GK rats. The results suggested that mitophagy were activated in diabetes. Further, we found that lidocaine exposure upregulated the expression of PINK1, p-AMPK, and the LC-3II/LC3-I ratio but downregulated mTORC1 expression. However, MK8722 (AMPK agonist) treatment aggravated lidocaine-induced mitochondrial dysfunction and morphological changes, and the expression of mitophagy-related proteins increased. Completely opposite results were obtained after treatment with Compound C (AMPK inhibitor) and Bafilomycin A1 (autophagy inhibitor). The results of the current study confirmed that lidocaine induced spinal cord neuronal injury in GK rats via AMPK-induced mitophagy.
The AMPK and PINK1 signaling pathways are essential for mitophagy, but whether an interaction occurs between AMPK and PINK1 has yet to be determined (Iorio et al., 2021). In the current study, lidocaine increased AMPK and PINK1 expression. AMPK activation upregulated PINK1 expression, but AMPK inhibition downregulated PINK1 expression. This occurrence suggests that there might be the crosstalk between AMPK and PINK1 in lidocaine-induced neurotoxicity. However, the molecular mechanism requires further study.
Some deficiencies should be pointed out. We investigated whether mitophagy was activated in spinal cord neurons in GK rats but ignored mitophagy activity in normal rats after treatment with lidocaine. And we have not conducted further research on AMPK-related signaling pathways, which will be performed in the future.
In summary, lidocaine induced cytotoxicity via AMPK-mediated mitophagy in spinal cord neurons under high glucose condition. The data from this study suggest that intervention targeting in mitophagy signaling pathway may educe lidocaine-induced neurotoxicity.
This study was supported by the Natural Science Foundation of Jiangxi Province (20192BAB205041).
Conflict of interestThe authors declare that there is no conflict of interest.