Abstract
Diabetic kidney disease (DKD) is the leading cause of end-stage renal disease (ESRD). Although current therapeutic strategies for DKD, including sodium-glucose cotransporter-2 inhibitors and mineralocorticoid receptor antagonists, have shown some degree of efficacy, they have failed to completely halt the progression of DKD to ESRD owing to the complexity of DKD pathogenesis. Elucidating the pathophysiological mechanism of DKD is essential for the development of novel therapeutic strategies. In this study, we investigated the pathophysiological characteristics of uninephrectomized (UNx) KK-Ay mice and examined the effects of salt supplementation on the acceleration of renal injury in these mice. UNx KK-Ay mice exhibited pathophysiological renal abnormalities with glomerular and tubulointerstitial fibrosis. Additionally, salt supplementation exacerbated renal injury, particularly tubular injury. These results suggest that UNx KK-Ay mice are useful models for advanced DKD and that salt exacerbates tubular damage in DKD.
INTRODUCTION
Diabetic kidney disease (DKD) is a microvascular complication of diabetes mellitus and the leading cause of end-stage renal disease (ESRD). DKD develops in approximately 40% of patients with type 2 diabetes (Alicic et al., 2017) and results in high cardiovascular morbidity and mortality (González-Pérez et al., 2021).
DKD is characterized by a rapid decline in glomerular filtration rate, persistent albuminuria, and renal histopathological changes, such as glomerular hypertrophy, glomerulosclerosis, mesangial expansion, tubular epithelial degeneration, and tubulointerstitial fibrosis (DeFronzo et al., 2021).
Conventional treatment methods for DKD are glycemic control with antidiabetic drugs, blood pressure control with antihypertensive drugs, and lifestyle improvements (Alicic and Nicholas, 2022). Recently, two drug classes, sodium-glucose cotransporter-2 inhibitors (SGLT2is) and mineralocorticoid receptor antagonists (MRAs), have been approved for the treatment of patients with DKD; the renal and cardiovascular benefits of these drugs have been demonstrated in large clinical trials. However, the effects of current treatments, including SGLT2is and MRAs, are limited, and preventing the progression of DKD to ESRD is difficult. Therefore, there is an urgent need for the development of new DKD treatments.
The pathogenesis of DKD is complex, and various factors are involved in DKD progression. Elucidating the pathophysiological mechanism of DKD is essential for the development of new treatments.
Animal models are essential to improve our current understanding of this disease and for the development of novel therapeutic strategies. Many rodent models have been established to investigate the pathophysiology of DKD and to test new drugs (Sembach et al., 2021). For example, a db/db mouse carrying a mutation in the leptin receptor gene is the most widely used rodent model of DKD. db/db mice exhibit early features of human DKD, such as increased glomerular filtration rate, mild albuminuria, and renal lesions. In addition to the genetic background, several approaches can be used to accelerate kidney injury, the most common being uninephrectomy, in which the removal of one kidney increases the filtration load on the remaining kidney. Other approaches include dietary interventions (high fat, high protein, or high salt) and hypertension induction by renin overexpression or angiotensin II administration, which result in decreased renal function and renal lesions.
The KK-Ay mouse is a genetic animal model of diabetes mellitus that exhibits hyperglycemia, hyperinsulinemia, hyperlipidemia, and glucosuria (Nishimura, 1969). This mouse model is also used as an animal model of DKD because the pathological changes in the glomeruli of KK-Ay mice are consistent with those found in the early stages of human DKD (Tomino, 2012). In addition, because the KK-Ay mouse is a backcross model of the spontaneously mutated obesity gene Ay into the KK mouse, which spontaneously develops diabetes through the involvement of multiple genes, the KK-Ay mouse, unlike the db/db mouse, is thought to develop the disease through the involvement of multiple factors, similar to human diabetes. To date, only a few studies have been conducted on uninephrectomized (UNx) KK-Ay mice. In this study, we investigated the pathophysiological characteristics of and the effects of salt supplementation on the acceleration of renal injury in UNx KK-Ay mice.
MATERIALS AND METHODS
Animals and experimental design
This experiment was conducted in accordance with the guidelines of the Tokyo University of Agriculture and approved by the Animal Experiment Committee of the university. Male C57BL/6J and male KK-Ay mice with or without uninephrectomization were purchased from CLEA Japan Inc. (Tokyo, Japan). The mice were maintained at 23 ± 3°C under a 12 hr/12 hr light-dark cycle with ad libitum access to a normal diet (CE-2; CLEA Japan) and sterilized tap water until the beginning of the experiment.
At five weeks of age, C57BL/6J mice were randomly divided into the following three experimental groups: normal control, normal UNx alone, and normal UNx with salt. The KK-Ay mice were also randomly divided into the following three experimental groups: KK-Ay control, KK-Ay UNx alone, and KK-Ay UNx with salt.
From six to 19 weeks of age, the normal UNx with salt and KK-Ay UNx with salt groups were administered CE-2 and 0.9% NaCl solution, and the other groups were administered CE-2 and sterilized tap water.
Biological parameters and blood biochemistry
Food consumption, water consumption, body weight, blood biochemical parameters such as plasma glucose, triglyceride (TG), total cholesterol (TC), blood urea nitrogen (BUN), and creatinine (CRE) were evaluated from six to 19 weeks of age. Blood samples were collected from the tail vein in the non-fasted state and glucose, TG, TC, BUN, and CRE levels were measured using either colorimetric test kits (Wako Pure Chemical Industries, Osaka, Japan) or an automated analyzer (DRI‐CHEM; Fujifilm, Tokyo, Japan).
Tissue sampling and histopathological analysis
Necropsy was performed at 19 weeks of age. All animals were sacrificed by exsanguination under isoflurane anesthesia. In the normal control and KK-Ay control groups, the total weight of two kidneys was measured and the kidney weight per one kidney was calculated. After measurement of kidney weights, the kidneys were subjected to histopathological analysis. The kidneys were immediately fixed in 10% neutral buffered formalin, paraffin-embedded, and thin-sectioned (4 μm). The kidney sections were stained with hematoxylin and eosin, Schiff periodate, and Sirius red and examined by light microscopy to visualize pathological changes and evaluate Sirius red-stained fibrotic areas. Immunohistochemistry was performed using rat anti-mouse F4/80 monoclonal antibody (Abcam, Tokyo, Japan, 1:100) or rabbit anti-alpha smooth muscle actin (α-SMA) polyclonal antibody (Abcam, 1:200). All samples were examined histopathologically or immunohisto- chemically in a blind manner under a microscope (Olympus Corporation, Tokyo, Japan) and photographed using the cellSens imaging software (Olympus). The findings were graded from normal (-) to severe (3+) in accordance with the following criteria. Grade ± was used to represent very weakly positive changes, + was used to represent focal or weakly positive sections, 2+ was used to represent half of the section area positive or moderate changes, and 3+ was used to represent more than half of the whole area positive or severe changes in a tissue section.
Total RNA isolation and reverse transcription
Total RNA was isolated from frozen renal cortex samples using Sepasol-RNA I Super G (Nacalai Tesque Inc., Kyoto, Japan) according to the manufacturer’s instructions. The primer sequences for each mRNA detected are listed in Table 1. Total RNA was quantified by spectrophotometry using a Nanodrop 2000c spectrophotometer (Thermo Fischer Scientific, Kanagawa, Japan) at an absorbance of 260 nm, and the obtained value ranged from 1.9 to 2 for all samples. Complementary DNA (cDNA) was prepared from 2 μg of total RNA by reverse transcription using 2 μL of Prime ScriptTM RT Master Mix (Takara Bio Inc., Shiga, Japan). The resulting cDNA was stored at −30°C. Real-time PCR was performed using a Thermal Cycler Dice Real-Time System II (Takara Bio Inc.) and SYBR Premix Ex Taq (Takara Bio Inc.). The fold changes in gene expression relative to the levels obtained in normal control mice, which were set equal to 1, were analyzed and calculated using the 2-ΔΔct method.
Table 1. Primer sequences for real-time PCR.
| Gene |
Primer sequence |
| Tnfa |
F:5’-TCGTAGCAAACCACCAAGTG-3’
R:5’-AGATAGCAAATCGGCTGACG-3’ |
| Ccl2 |
F:5’-CCCACTCACCTGCTGCTACT-3’
R:5’-ATTTGGTTCCGATCCAGGTT-3’ |
| Il1b |
F:5’-TGTGAAATGCCACCTTTTGA-3’
R:5’-GGTCAAAGGTTTGGAAGCAG-3’ |
| Tgfb1 |
F:5’-GCAACATGTGGAACTCTACCAGA-3’
R:5’-GACGTCAAAAGACAGCCACTCA-3’ |
| Col1a1 |
F:5’-GAACTGGACTGTCCCAACCC-3’
R:5’-CTTGGGTCCCTCGACTCCTA-3’ |
| Col4a1 |
F:5’-TCATTAGCAGGTGTGCGGTT-3’
R:5’-GTTAGGGCACTGCGGAATCT-3’ |
| Timp1 |
F:5’-AGGTGGTCTCGTTGATTTCT-3’
R:5’-GTAAGGCCTGTAGCTGTGCC-3’ |
Statistical analysis
Results are expressed as the mean ± standard deviation. SAS System (version 9.4, SAS Institute Inc., Cary, NC, USA) and EXSUS (version 10.0, EPS Corporation, Tokyo, Japan) were used for the statistical analysis. Differences between all six groups were tested by the Tukey test and considered significant at P < 0.05.
RESULTS
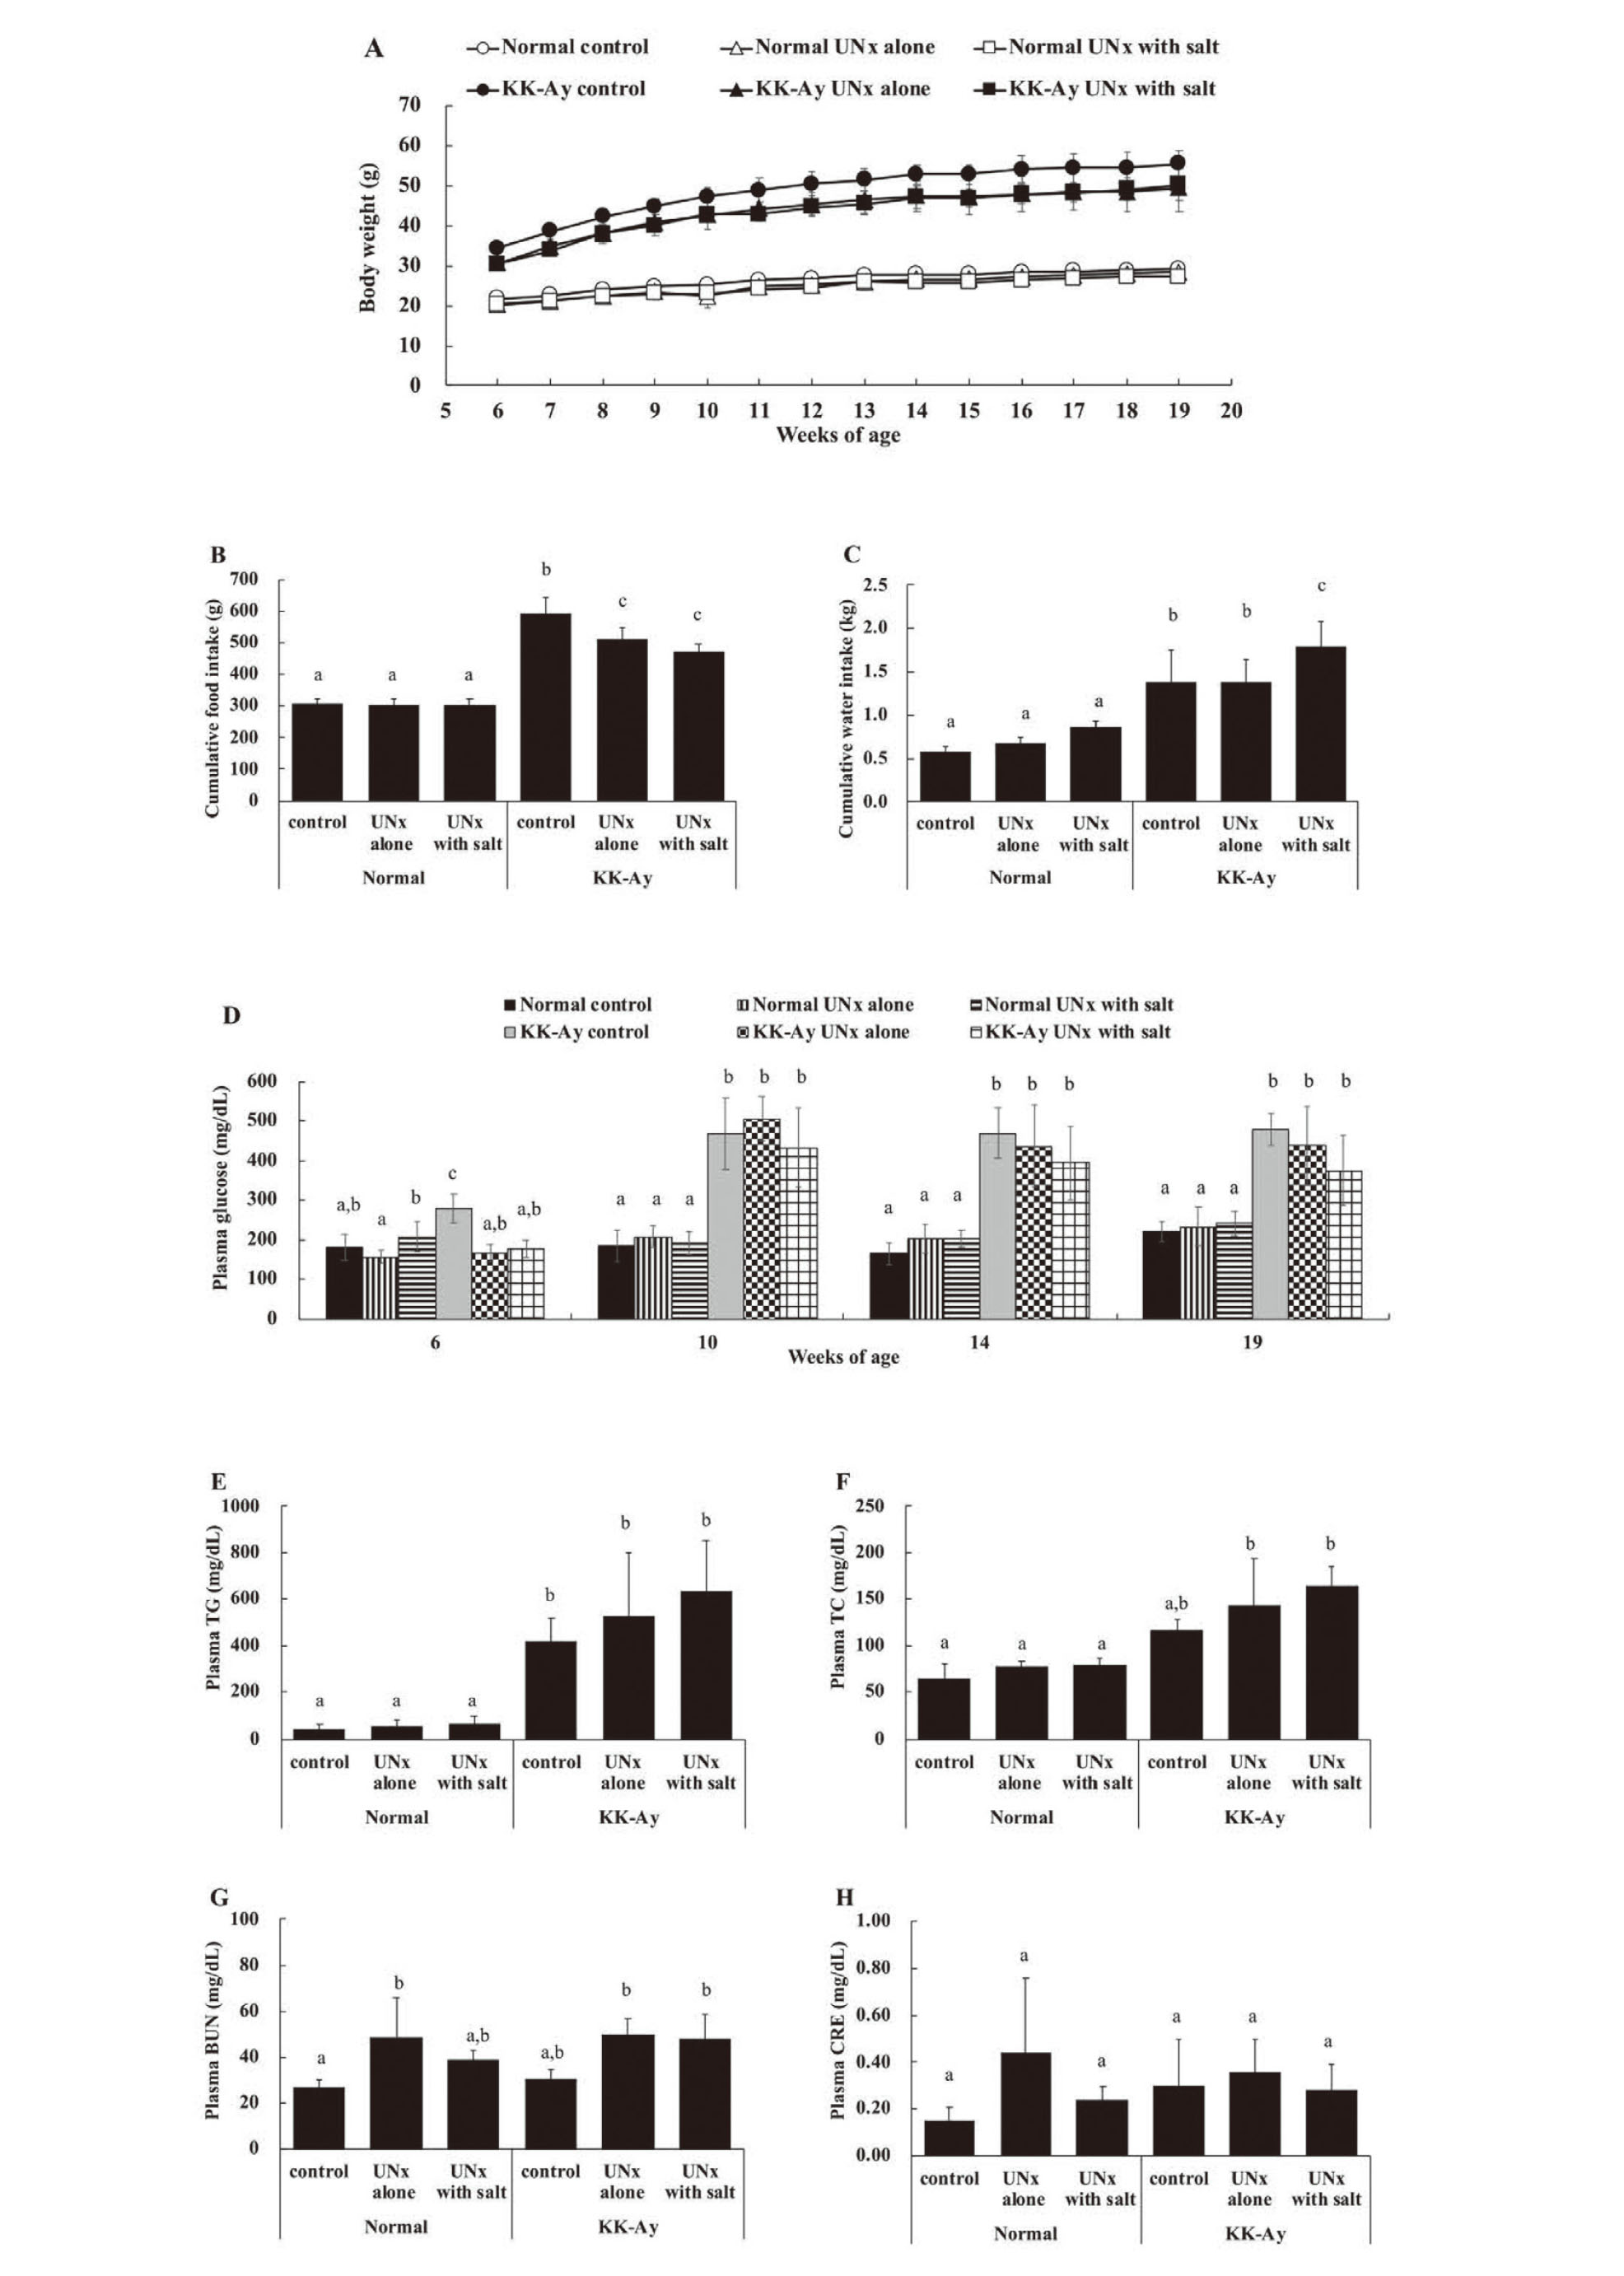
Throughout the study period, there was no apparent deterioration in the general condition of the animals used. Body weight gain was observed in all six groups during the study period (Fig. 1A). The individuals in the KK-Ay group (KK-Ay control, KK-Ay UNx alone, and KK-Ay UNx with salt) were heavier at baseline and gained more body weight than those in the normal group (normal control, normal UNx alone, and normal UNx with salt). The normal group had a similar cumulative food intake during the study periods; however, the KK-Ay group consistently showed hyperphagia compared to the normal group (Fig. 1B), and the KK-Ay control group consumed the largest amount of food among all six groups. In KK-Ay mice, food consumption was significantly lower in the UNx group than in the control group. The difference in food intake tended to increase over time (data not shown), suggesting that the difference in food intake is associated with disease progression. Cumulative water intake was similar within the normal group (Fig. 1C). Cumulative water intake in the KK-Ay group was significantly higher than that in the normal group, and the KK-Ay UNx with salt group consumed the largest amount of water among all six groups. Plasma glucose levels within the normal group were similar and remained largely unchanged during the study periods. However, plasma glucose levels in the KK-Ay group increased from 6 to 10 weeks of age and thereafter remained significantly high compared with those in the normal group (Fig. 1D). Plasma TG levels and plasma TC levels were similar within the normal group. Plasma TG levels in the KK-Ay group were significantly higher than those in the normal group (Fig. 1E), and plasma TC levels in the KK-Ay UNx alone and the UNx with salt groups were significantly higher than those in the normal group (Fig. 1F). BUN levels in the normal UNx alone and UNx with salt groups increased compared to that in the normal control. BUN levels were similar between the normal control and the KK-Ay control groups. BUN levels increased in the KK-Ay UNx alone and KK-Ay UNx with salt groups compared to the KK-Ay control (Fig. 1G). Plasma CRE levels did not change significantly among the six groups (Fig. 1H).
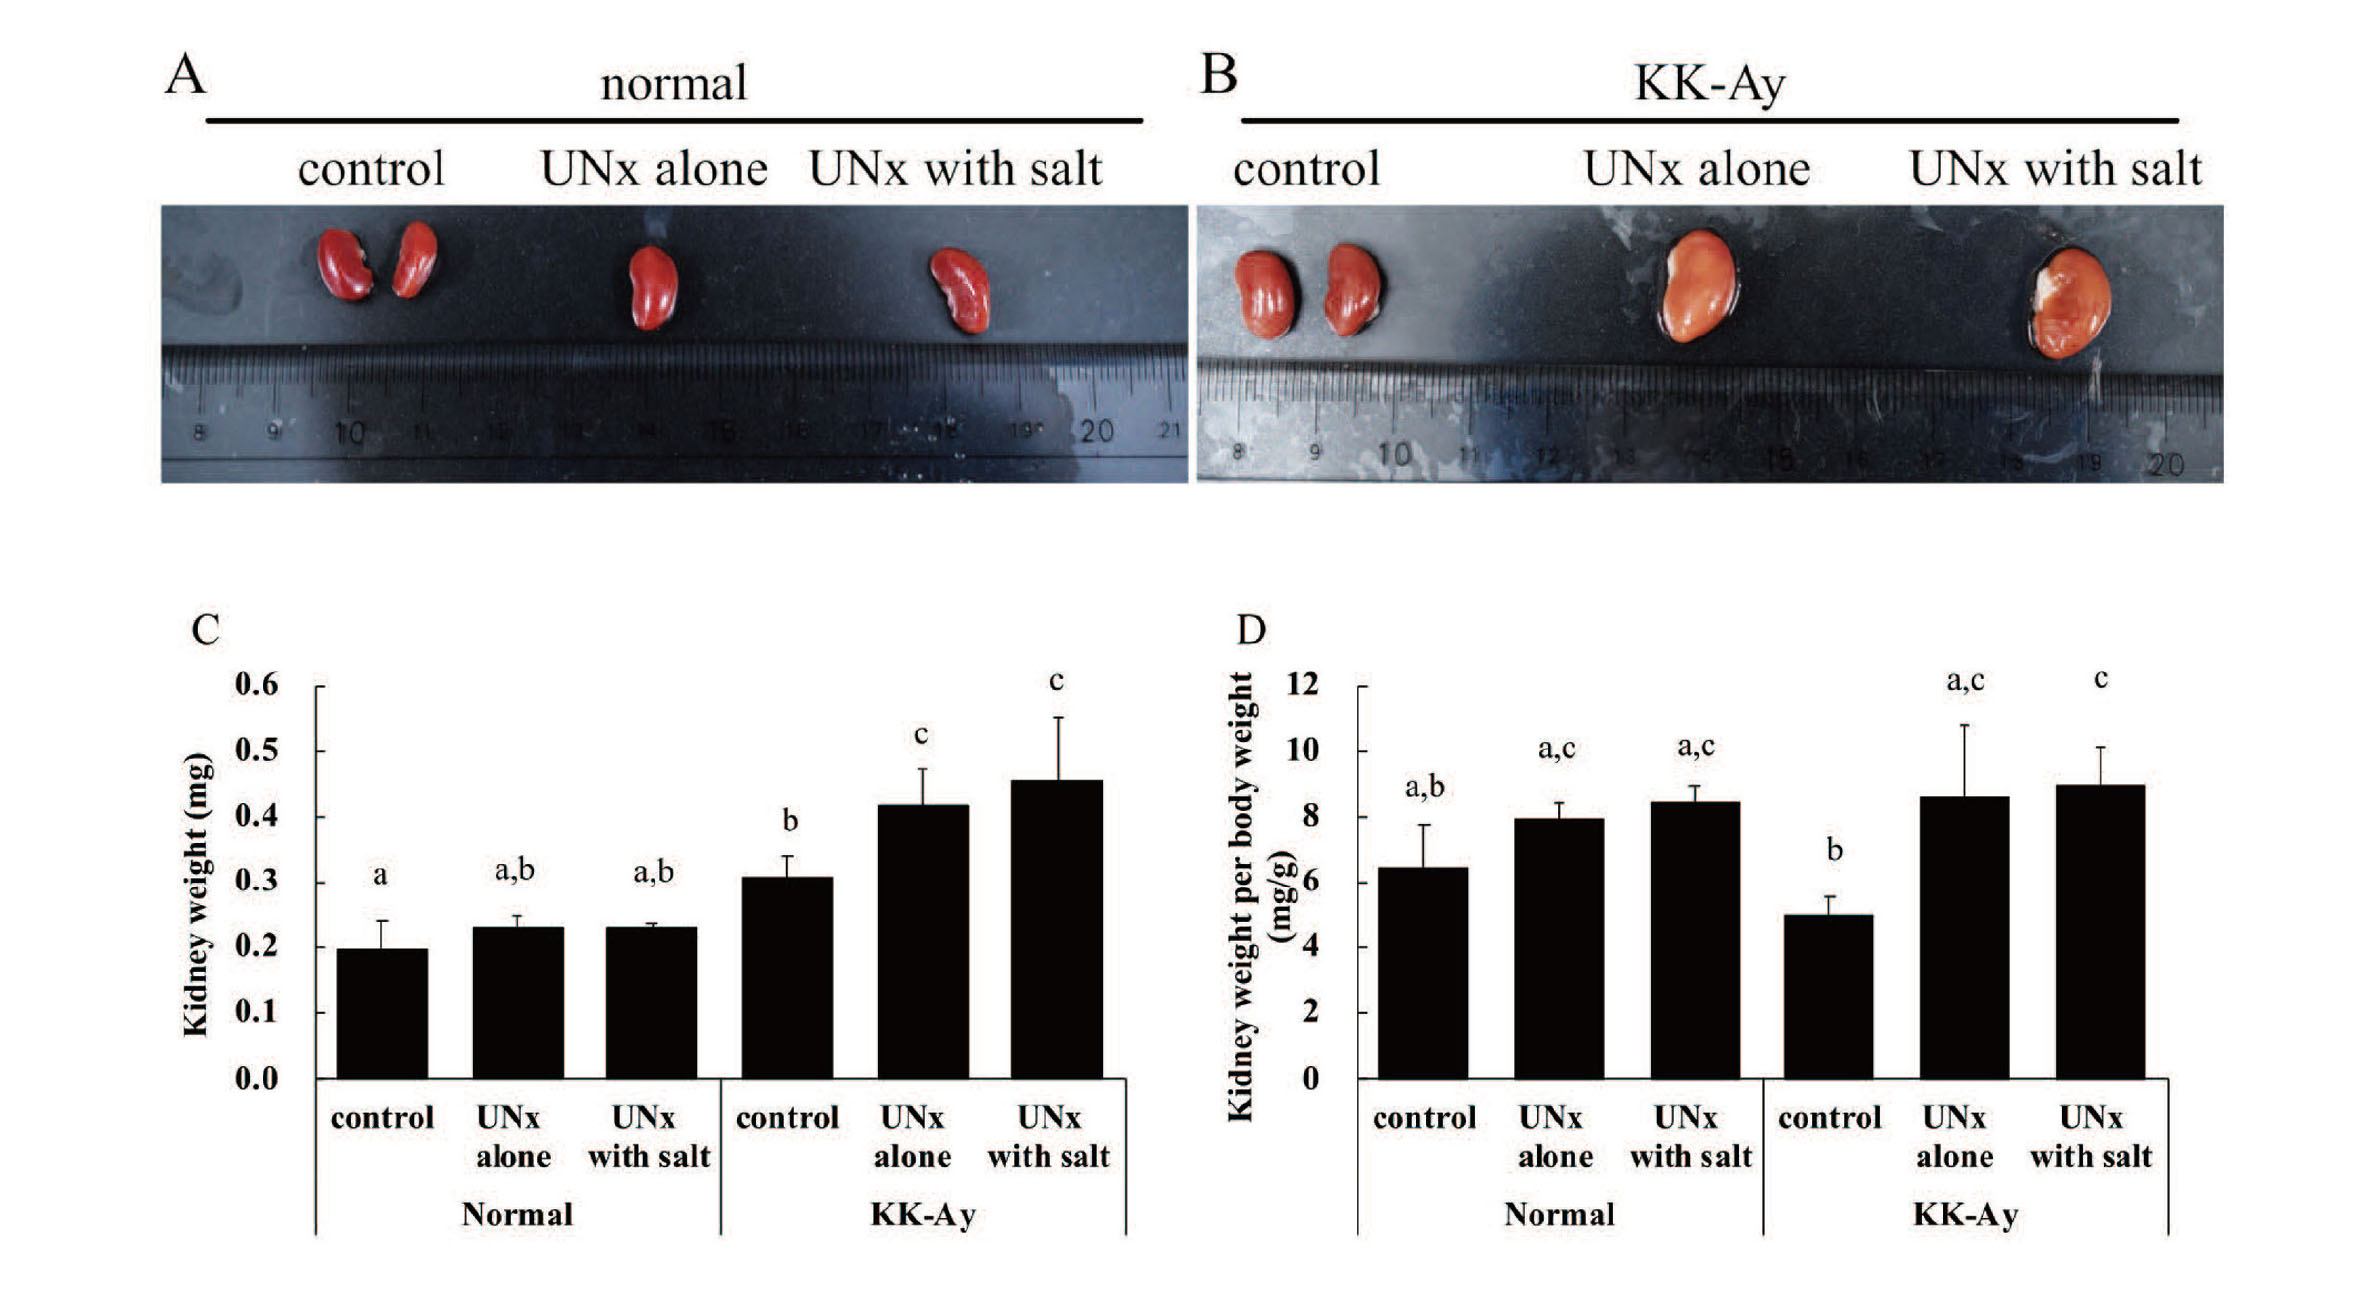
The KK-Ay group exhibited postmortem kidney fading compared to the normal group (Fig. 2A and 2B). Kidney weight and kidney weight per body weight were similar within the normal group (Fig. 2C and 2D). Kidney weights in the KK-Ay control, KK-Ay UNx alone, and KK-Ay UNx with salt groups were significantly higher than those in the normal control, normal UNx alone, and normal UNx with salt groups, respectively. Kidney weight per body weight in the KK-Ay UNx alone and KK-Ay UNx with salt groups was significantly higher than that in the KK-Ay control (Fig. 2C and 2D).
The histopathological findings and immunohistochemistry results of the kidneys of the normal and KK-Ay groups are shown in Table 2, Table 3, Fig. 3, and Fig. 4. The KK-Ay group showed glomerular mesangial matrix expansion and mild glomerular hypertrophy. Atrophic glomeruli were also observed in the KK-Ay control and KK-Ay UNx alone groups. The KK-Ay UNx alone and KK-Ay UNx with salt groups showed glomerular fibrosis, tubular lesions such as tubular dilation, hyaline cast, and Armanni–Ebstein lesions, and tubulointerstitial lesions such as inflammatory cell infiltration and fibrosis.
Table 2. Histopathological findings and immunohistochemistry results of the kidneys from the normal group.
| Findings |
Normal
Animal ID |
control |
|
UNx alone |
|
UNx with salt |
| 1 |
2 |
3 |
4 |
5 |
6 |
7 |
8 |
9 |
10 |
11 |
12 |
13 |
14 |
15 |
16 |
17 |
| Glomeruli |
|
|
|
|
|
|
|
|
|
|
|
|
|
|
|
|
|
|
|
| Atrophy |
± |
± |
+ |
+ |
2+ |
|
+ |
+ |
+ |
+ |
± |
− |
|
± |
+ |
± |
+ |
+ |
± |
| Adhesion |
− |
− |
− |
− |
− |
|
− |
− |
− |
− |
− |
− |
|
− |
− |
− |
− |
− |
− |
| Hypertophy |
− |
− |
− |
− |
− |
|
− |
− |
− |
− |
− |
− |
|
− |
− |
− |
− |
− |
− |
| Increased mesangial matrix |
− |
− |
± |
− |
± |
|
− |
± |
± |
± |
+ |
+ |
|
− |
+ |
+ |
+ |
− |
− |
| Fibrosis |
− |
nd |
± |
± |
− |
|
+ |
− |
− |
± |
− |
− |
|
+ |
2+ |
+ |
− |
± |
+ |
| Renal tubule |
|
|
|
|
|
|
|
|
|
|
|
|
|
|
|
|
|
|
|
| Degeneration |
− |
− |
− |
− |
− |
|
− |
− |
− |
− |
− |
− |
|
− |
− |
− |
− |
− |
− |
| Tubular dilatation |
− |
− |
− |
− |
− |
|
− |
− |
− |
− |
− |
− |
|
− |
− |
− |
− |
− |
− |
| Armanni-Ebstein lesion |
− |
− |
− |
− |
− |
|
− |
− |
− |
− |
− |
− |
|
− |
− |
− |
− |
− |
− |
| Hyaline cast |
− |
− |
− |
± |
− |
|
− |
− |
± |
− |
− |
− |
|
− |
− |
− |
± |
− |
− |
| Tubulointerstition |
|
|
|
|
|
|
|
|
|
|
|
|
|
|
|
|
|
|
|
| Inflammatory cell infiltration |
− |
+ |
± |
± |
± |
|
± |
± |
− |
+ |
+ |
+ |
|
+ |
+ |
+ |
± |
± |
+ |
| Fibrosis |
− |
nd |
+ |
− |
− |
|
± |
− |
− |
− |
− |
± |
|
± |
± |
− |
± |
± |
− |
Grades of severity for findings: negative (−), very slight (±), slight (+), moderate (2+), or severe (3+)
nd: no data
Table 3. Histopathological findings and immunohistochemistry results of the kidneys from the KK-Ay group.
| Findings |
KK-Ay
Animal ID |
control |
|
UNx alone |
|
UNx with salt |
| 1 |
2 |
3 |
4 |
5 |
6 |
7 |
8 |
9 |
10 |
11 |
12 |
13 |
14 |
15 |
16 |
17 |
| Glomeruli |
|
|
|
|
|
|
|
|
|
|
|
|
|
|
|
|
|
|
|
| Atrophy |
+ |
2+ |
2+ |
2+ |
2+ |
|
+ |
2+ |
2+ |
+ |
2+ |
2+ |
|
+ |
+ |
+ |
nd |
+ |
± |
| Adhesion |
− |
− |
− |
− |
− |
|
− |
− |
− |
− |
− |
− |
|
− |
− |
− |
nd |
− |
− |
| Hypertophy |
+ |
− |
+ |
± |
± |
|
− |
± |
± |
± |
+ |
± |
|
± |
− |
± |
nd |
± |
± |
| Increased mesangial matrix |
+ |
2+ |
2+ |
3+ |
2+ |
|
3+ |
3+ |
3+ |
3+ |
3+ |
2+ |
|
3+ |
2+ |
2+ |
nd |
+ |
+ |
| Fibrosis |
+ |
± |
− |
± |
± |
|
2+ |
nd |
2+ |
+ |
+ |
2+ |
|
2+ |
+ |
+ |
nd |
2+ |
+ |
| Renal tubule |
|
|
|
|
|
|
|
|
|
|
|
|
|
|
|
|
|
|
|
| Degeneration |
± |
+ |
± |
+ |
± |
|
+ |
± |
± |
+ |
+ |
2+ |
|
2+ |
2+ |
2+ |
nd |
2+ |
2+ |
| Tubular dilatation |
± |
− |
± |
− |
± |
|
3+ |
2+ |
+ |
2+ |
2+ |
+ |
|
2+ |
2+ |
2+ |
nd |
2+ |
3+ |
| Armanni-Ebstein lesion |
− |
− |
− |
− |
− |
|
− |
+ |
± |
± |
± |
± |
|
+ |
2+ |
2+ |
nd |
+ |
3+ |
| Hyaline cast |
± |
± |
± |
+ |
+ |
|
+ |
+ |
+ |
2+ |
2+ |
+ |
|
2+ |
3+ |
3+ |
nd |
2+ |
3+ |
| Tubulointerstition |
|
|
|
|
|
|
|
|
|
|
|
|
|
|
|
|
|
|
|
| Inflammatory cell infiltration |
+ |
± |
± |
± |
± |
|
2+ |
2+ |
3+ |
2+ |
3+ |
3+ |
|
3+ |
3+ |
2+ |
nd |
+ |
3+ |
| Fibrosis |
− |
± |
+ |
2+ |
+ |
|
3+ |
nd |
3+ |
3+ |
3+ |
3+ |
|
3+ |
2+ |
+ |
nd |
3+ |
3+ |
Grades of severity for findings: negative (−), very slight (±), slight (+), moderate (2+), or severe (3+)
nd: no data
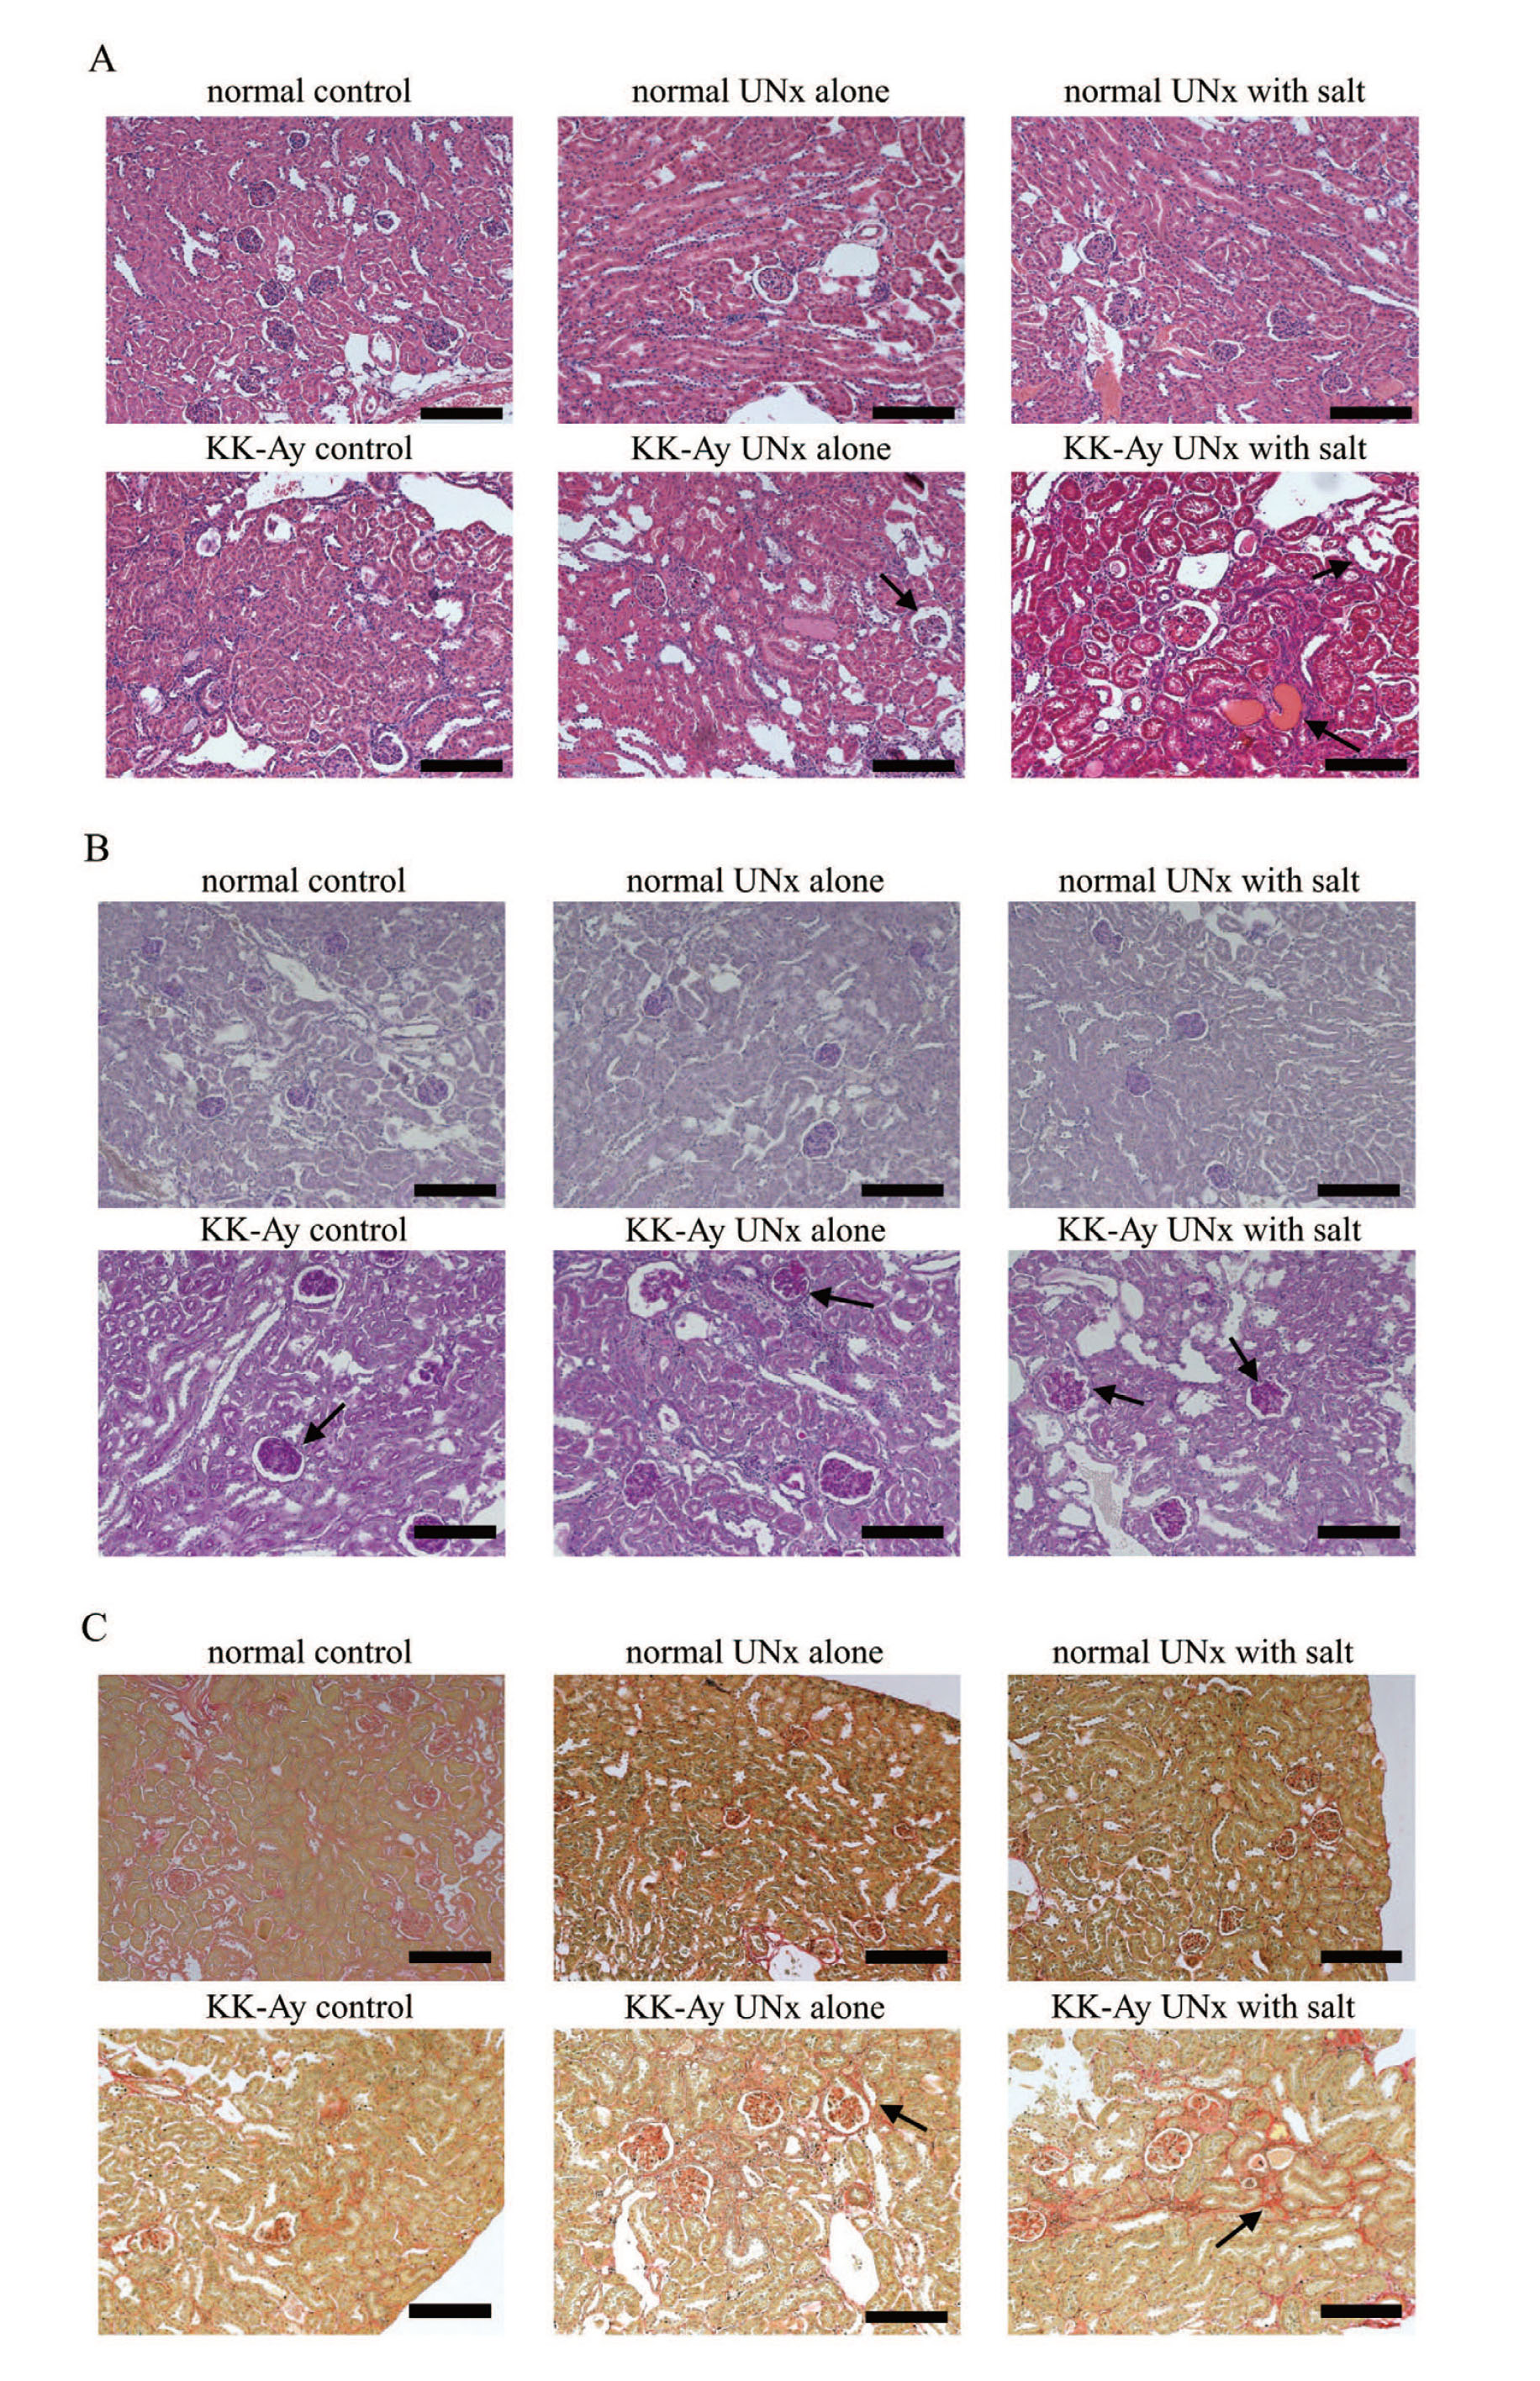
In immunohistochemical analysis, F4/80-positive and α-SMA-positive cells were localized to the interstitial compartment in the KK-Ay UNx alone and KK-Ay UNx with salt groups.
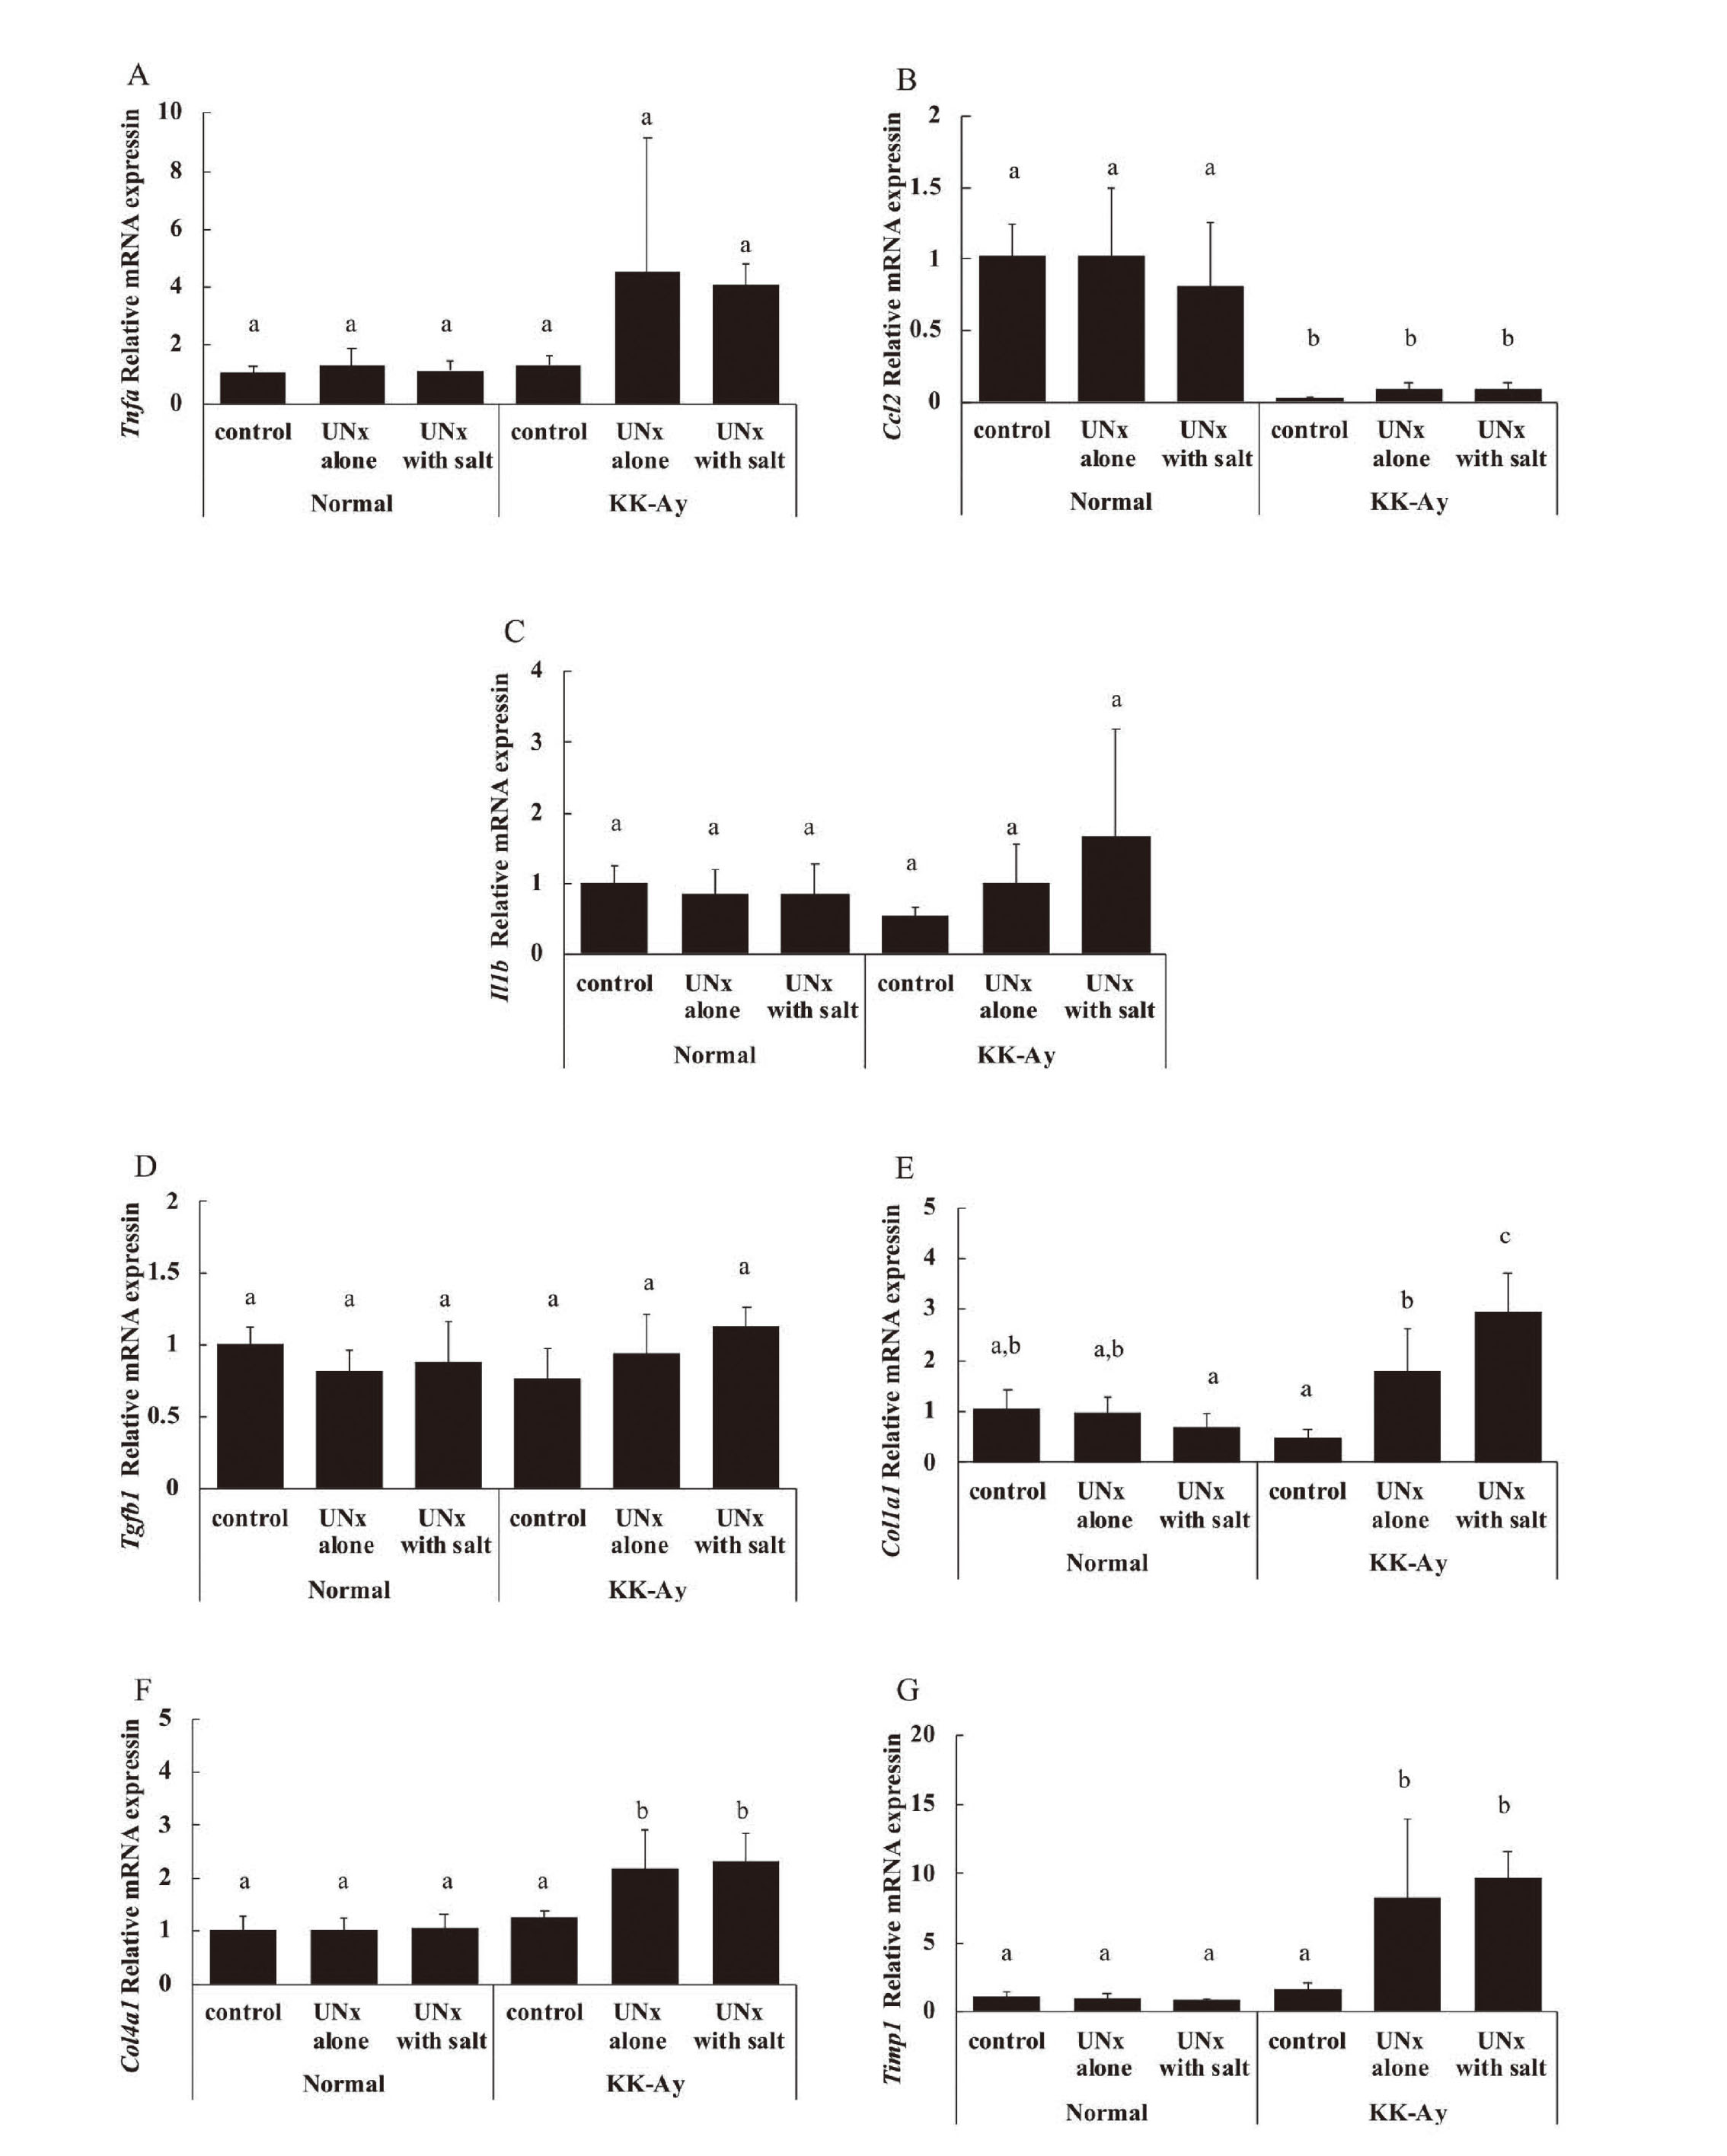
The expression levels of mRNAs related to inflammation (Tnfa, Ccl2, and Il1b) and fibrosis (Tgfb1, Col1a1, Col4a1, and Timp1) are shown in Fig. 5. The expression levels of these mRNAs were similar within the normal group. In the KK-Ay UNx alone and KK-Ay UNx with salt groups, the mRNA expression levels of Tnfa tended to be higher, and those of Col1a1, Col4a1, and Timp1 were significantly higher than those in the KK-Ay control group. In contrast, the mRNA expression levels of Ccl2 were significantly lower in the KK-Ay group than in the normal group.
DISCUSSION
DKD is a microvascular complication of diabetes mellitus and is the leading cause of ESRD. Although current treatments, including SGLT2is and MRAs, are effective, progression to ESRD cannot be completely suppressed owing to the complexity of DKD pathogenesis. Therefore, elucidating the pathophysiological mechanism of DKD is crucial for the development of novel treatments.
Many rodent models, including db/db mice, KK-Ay mice, Zucker diabetic fatty rats, and Spontaneously Diabetic Torii (SDT) fatty rats, are available for investigating DKD pathophysiology and testing novel therapeutic strategies. However, most of these models only exhibit the early features of human DKD; therefore, a model of more severe DKD is necessary. In this study, we investigated the pathophysiological characteristics of and the effects of salt supplementation on the acceleration of kidney injury in UNx KK-Ay mice.
In this study, no major differences were observed in any parameter between intact normal, UNx normal, and salt-loaded UNx normal mice. Moreover, intact KK-Ay mice showed mild tubular lesions and glomerular lesions such as atrophy, hypertrophy, and mesangial matrix expansion. These findings are consistent with a previous report (Ito et al., 2006) and suggest that the KK-Ay mouse is a good model for early stage DKD.
Uninephrectomy is a commonly used technique for accelerating diabetic kidney injury. Tahara and Takasu (2018) reported that UNx KK-Ay mice showed features of more severe DKD, such as increased urinary albumin excretion, decreased creatinine clearance, and tubulointerstitial fibrosis. In the present study, tubular and tubulointerstitial lesions in UNx KK-Ay mice were more severe than those in intact KK-Ay mice. Glomerular and tubulointerstitial fibrosis were also more pronounced in UNx KK-Ay mice than in intact KK-Ay mice. Tubulointerstitial fibrosis is an essential advantage of UNx KK-Ay mice because other UNx rodent models do not exhibit apparent tubulointerstitial fibrosis (Ninichuk et al., 2007; Katsuda et al., 2014).
Although sodium is an essential mineral for maintaining body fluid balance, excessive sodium intake is a risk factor for hypertension, which promotes DKD progression (Nerbass et al., 2015). In the present study, salt-loaded UNx KK-Ay mice showed glomerular and tubulointerstitial injury similar to that of untreated UNx KK-Ay mice. However, the degree of tubular lesions in salt-loaded UNx KK-Ay mice was more severe than that in untreated UNx KK-Ay mice. Teoh et al. (2021) reported that salt-loaded male SDT fatty rats, which are an obese type 2 diabetic model, experienced severe tubular injury compared to untreated male SDT fatty rats. The kidney is a highly metabolically active organ with large numbers of mitochondria. The majority of renal energy expenditure is used for sodium transport by Na+/K+-ATPase. The renal tubular Na+/K+-ATPase enzyme is known to play a role in the active transport of Na+ across the cell membrane. Excessive salt increases the expression levels of Na+/K+-ATPase in the renal tubules of diabetic mice and causes renal tubular metabolism disorders, resulting in severe damage to tubular cells (Zou et al., 2021). Therefore, excess salt may cause more severe renal tubule damage.
This study has some limitations that need to be recognized. Blood pressure, urinary parameters, and renal function were not measured because we focused on pathological analysis. BUN levels in the UNx alone and UNx with salt groups of both normal and KK-Ay mice increased compared to each control in this study, suggesting decreased renal function. However, creatinine clearance was not calculated because urinary creatinine was not measured in this study, making it difficult to clarify the extent of the decline in renal function. Investigation of these parameters would provide better insight into DKD pathogenesis in UNx KK-Ay mice with or without salt supplementation. Further investigation is needed to clarify the more detailed characteristics of these models.
In conclusion, UNx KK-Ay mice exhibited pathophysiological renal abnormalities with glomerular and tubulointerstitial fibrosis, which are features typical of patients with advanced DKD. Additionally, salt supplementation exacerbated renal injury, particularly tubular damage. These results suggest that UNx KK-Ay mice are useful models for advanced DKD and that salt exacerbates tubular damage in DKD.
Conflict of interest
The authors declare that there is no conflict of interest.
REFERENCES
- Alicic, R. and Nicholas, S.B. (2022): Diabetic kidney disease back in focus: management field guide for health care professionals in the 21st century. Mayo Clin. Proc., 97, 1904-1919.
- Alicic, R.Z., Rooney, M.T. and Tuttle, K.R. (2017): Diabetic kidney disease: challenges, progress, and possibilities. Clin. J. Am. Soc. Nephrol., 12, 2032-2045.
- DeFronzo, R.A., Reeves, W.B. and Awad, A.S. (2021): Pathophysiology of diabetic kidney disease: impact of SGLT2 inhibitors. Nat. Rev. Nephrol., 17, 319-334.
- González-Pérez, A., Saez, M., Vizcaya, D., Lind, M. and Garcia Rodriguez, L. (2021): Incidence and risk factors for mortality and end-stage renal disease in people with type 2 diabetes and diabetic kidney disease: a population-based cohort study in the UK. BMJ Open Diabetes Res. Care, 9.
- Ito, T., Tanimoto, M., Yamada, K., Kaneko, S., Matsumoto, M., Obayashi, K., Hagiwara, S., Murakoshi, M., Aoki, T., Wakabayashi, M., Gohda, T., Funabiki, K., Maeda, K., Horikoshi, S. and Tomino, Y. (2006): Glomerular changes in the KK-Ay/Ta mouse: a possible model for human type 2 diabetic nephropathy. Nephrology (Carlton), 11, 29-35.
- Katsuda, Y., Kemmochi, Y., Maki, M., Sano, R., Toriniwa, Y., Ishii, Y., Miyajima, K., Kakimoto, K. and Ohta, T. (2014): Effects of unilateral nephrectomy on renal function in male Spontaneously Diabetic Torii fatty rats: a novel obese type 2 diabetic model. J. Diabetes Res., 2014, 363126.
- Nerbass, F.B., Pecoits-Filho, R., McIntyre, N.J., McIntyre, C.W. and Taal, M.W. (2015): High sodium intake is associated with important risk factors in a large cohort of chronic kidney disease patients. Eur. J. Clin. Nutr., 69, 786-790.
- Ninichuk, V., Khandoga, A.G., Segerer, S., Loetscher, P., Schlapbach, A., Revesz, L., Feifel, R., Khandoga, A., Krombach, F., Nelson, P.J., Schlöndorff, D. and Anders, H.J. (2007): The role of interstitial macrophages in nephropathy of type 2 diabetic db/db mice. Am. J. Pathol., 170, 1267-1276.
- Nishimura, M. (1969): Breeding of mice strains for diabetes mellitus. Exp. Anim., 18, 147-157.
- Sembach, F.E., Østergaard, M.V., Vrang, N., Feldt-Rasmussen, B., Fosgerau, K., Jelsing, J. and Fink, L.N. (2021): Rodent models of diabetic kidney disease: human translatability and preclinical validity. Drug Discov. Today, 26, 200-217.
- Tahara, A. and Takasu, T. (2018): Prevention of progression of diabetic nephropathy by the SGLT2 inhibitor ipragliflozin in uninephrectomized type 2 diabetic mice. Eur. J. Pharmacol., 830, 68-75.
- Teoh, S.H., Miyajima, K., Shinozaki, Y., Shinohara, M., Ohata, K., Briand, F., Morimoto, R., Nakamura, Y., Uno, K., Kemuriyama, N., Nakae, D., Ohta, T. and Maekawa, T. (2021): Effects of excessive sodium chloride loading in the spontaneously diabetic torii (SDT) fatty rats, a preclinical model of type 2 diabetes mellitus. J. Toxicol. Sci., 46, 589-599.
- Tomino, Y. (2012): Lessons from the KK-Ay mouse, a spontaneous animal model for the treatment of human type 2 diabetic nephropathy. Nephrourol. Mon., 4, 524-529.
- Zou, M., Chen, Y., Zheng, Z., Sheng, S., Jia, Y., Wang, X., Ren, S., Yang, Y., Li, X., Dong, W., Guan, M., Zhang, Q. and Xue, Y. (2021): High-salt attenuates the efficacy of dapagliflozin in tubular protection by impairing fatty acid metabolism in diabetic kidney disease. Front. Pharmacol., 12, 741087.