Abstract
Although toxicities of multiwalled carbon nanotube (MWCNT) have been found to be related with activities of macrophages phagocytosing the fibers, the exact relationship between macrophage population and pathogenesis of fibrosis and mesotheliomas induced by MWCNTs is largely unknown. CCL2-CCR2 axis, a major monocyte/macrophage infiltration route, is thought to be involved in not only acute inflammation but also the formation of tumor microenvironment. We therefore described a time-course of alteration of macrophage population in an attempt to clarify the contribution of the Ccr2 gene to mesotheliomagenesis. Wild-type (WT) C57BL/6 mice and Ccr2-knockout (KO) mice were intraperitoneally administered with MWNT-7 and were sequentially necropsied at 1, 7, 28, 90, and 245 day(s) after the injection. Peritoneal fibrosis was prominent in all MWCNT-treated mice, with a lower severity in the KO mice. No differences were observed in the incidences of neoplastic lesions of mesothelia between WT and KO mice. A flow cytometric analysis revealed that after gross disappearance of macrophages after MWCNT exposure, small peritoneal macrophages (SPMs) were exclusively refurbished by the CCR2-dependent route at day 1 (as Ly-6C+MHC class II− cells), followed by additional CCR2-independent routes (as Ly-6C−MHC class II− cells); i.e., the only route in KO mice; with a delay of 1–7 days. The SPMs derived from both routes appeared to differentiate into maturated cells as Ly-6C−MHC class II+, whose ratio increased in a time-dependent manner among the total SPM population. Additionally, most macrophages expressed M1-like features, but a small fraction of macrophages exhibited an M1/M2 mixed status in MWCNT-treated animals. Our findings demonstrate a long-persistent activation of the CCL2-CCR2 axis after MWCNT exposure and enable a better understanding of the participation and potential roles of SPMs in fibrous material-induced chronic toxicities.
INTRODUCTION
Carbon nanotubes (CNT) are widely used nanomaterials in the fields of energy, electronics, and materials due to their advantageous features such as thermal stability, electrical conductivity, and mechanical durability. Increasing industrial applications have enhanced the demand for CNT production, but there are several concerns about their adverse effects on human health. Acute and chronic pulmonary toxicities and carcinogenic potentials of CNTs have been demonstrated over the past decade. MWNT-7, a multiwalled carbon nanotube (MWCNT), has been observed to induce peritoneal mesotheliomas in p53 heterozygous mice or F344 rats, when intraperitoneally injected (Takagi et al., 2008; Sakamoto et al., 2009), and lung carcinomas in rats following 2-year inhalation carcinogenicity test (Kasai et al., 2016). Furthermore, the potential carcinogenicity of various CNTs has been demonstrated in 2-year tests using i.p. injections as well as intratracheal instillation in rats (Nagai et al., 2011; Rittinghausen et al., 2014; Sakamoto et al., 2018; Saleh et al., 2022; Hojo et al., 2022).
Several studies have documented the involvement of persistent inflammation and reactive oxygen species (ROS) in fiber-induced carcinogenesis (Murphy et al., 2012; Kuempel et al., 2017). Exposures to CNTs have elicited inflammatory responses such as release of chemokines or infiltration of leukocytes in the lungs, pleural cavity, or peritoneal cavity in rodents, and these effects have been observed for several months after a single administration of the dose of the CNT (Kobayashi et al., 2010; Hojo et al., 2021). Levels of proinflammatory and oxidative stress-related cellular responses are proportional to the surface area or the length of CNT fibers (Nakanishi et al., 2015; Rushton et al., 2010; Oberdörster and Kuhlbusch, 2018). Long and rigid fibers which cannot be easily phagocytosed and removed by macrophages can cause the “frustrated phagocytosis” status, in which the fibers repeatedly induce inflammatory responses for a long time (Palomäki et al., 2011; Murphy et al., 2012; Donaldson et al., 2010; Hamilton et al., 2013).
However, it is becoming increasingly evident that chronic toxicities induced by nanomaterials including CNTs are not necessarily associated with inflammation (Huaux, 2018). Some animal studies involving lung-fibrosis or lung-cancer models suggest that inflammatory stimuli resulting from particle exposures are not directly linked to the exacerbation of pathological conditions (Rabolli et al., 2011; Barbarin et al., 2005). Rather, anti-inflammatory and immunosuppressive roles of the particulate and fibrous materials seem to be more relevant in chronic pathological changes such as fibrosis and cancer (Mitchell et al., 2009; Shvedova et al., 2013). Huaux et al. have recently proposed that monocyte-derived immunosuppressive cells may be the contributing factors in peritoneal mesotheliomas induced by MWCNT in the i.p. injection model in rats (Huaux et al., 2016). A carcinogenic dose of MWNT-7 evoked a quick infiltration of proinflammatory macrophages along with a subsequent influx of monocytic myeloid-derived suppressive cells (MDSCs) around 15 days after the injection. Further, a repopulation of the macrophage niche after a “macrophage disappearance reaction (MDR)” caused by MWNT-7 was predominated by small peritoneal macrophages (SPMs) (Orsi et al., 2021), which are inflammatory and reactive macrophages, instead of large peritoneal macrophages (LPMs), considered to be homeostatic macrophages (Ghosn et al., 2010). The authors further postulated that the MDSCs and/or SPMs may be instrumental in the malignant transformation of mesothelial cells by bringing about an alteration in the microenvironment of the peritoneum. However, it is not clear whether these immunosuppressive cells, which had emerged in the relatively early phase (only 15 to 30 days after the administrations), were sustained in the inflamed and regenerative tissue for a prolonged period, and indeed contributed to mesothelioma development. Additional longer-term and mechanistic studies are needed.
Recruitment of monocytes/macrophages is mediated mainly by the chemokine ligand 2-chemokine receptor 2 (CCL2-CCR2) axis after tissue injuries, as evident from models with administration of thioglycolate (Boring et al., 1997; Takahashi et al., 2009) and lipopolysaccharide (LPS) (Ghosn et al., 2010). CCL2 (also known as monocyte chemoattractant protein-1 (MCP-1)) is a chemoattractant produced by macrophages, fibroblasts, endothelial cells, etc., and induces the migration of CCR2 expressing macrophages from blood vessel to the target inflaming tissues. Tumor-associated macrophages (TAMs) or monocytic MDSCs were also found to be recruited by the CCL2-CCR2 axis. It is expected that agents blocking the CCL2-CCR2 axis should improve the cancerous condition and thus the prognosis of cancer patients (Li et al., 2017; Grossman et al., 2018). Regarding the pathology of mesothelioma, serum CCL2 levels were found to be significantly elevated in patients with malignant pleural mesothelioma (MPM) (Kishimoto et al., 2019), and the level of M2 macrophage infiltration into the mesothelioma tissue was directly related to CCL2 concentration in the pleural effusion in the MPM (Chéné et al., 2016). Studies evaluating chronic effects of MWCNTs on rodent mesothelial tissues or mesothelioma development have often reported about the elevation of CCL2 in the tissues or biofluids (Poland et al., 2008; Yamaguchi et al., 2012; Hojo et al., 2021).
The purpose of this study is to deduce the behavior of peritoneal macrophages, with an emphasis on the CCL2-CCR2 axis during the MWCNT-induced toxicological events with a long-term observation period, which will enable us to observe the phase of mesothelioma development. Although the induction of pleural and peritoneal mesotheliomas in wild-type (WT) mice by CNTs has not yet been demonstrated in the literature, we have recently discovered that a single i.p. injection of MWNT-7 caused peritoneal mesotheliomas in WT C57BL/6 mice with a substantial tumor incidence in a 2-year test (manuscript in preparation). Here employing the same experimental conditions as were observed in the study, we performed a time-course analysis of WT C57BL/6 and Ccr2-knockout (KO) mice for eight months after single i.p. injection of MWCNT. Our results indicate that a macrophage infiltration to the injured peritoneum constantly occurred even long after the subsidence of acute inflammation and the recruitment was achieved by both CCR2-dependent and -independent routes.
MATERIALS AND METHODS
Preparation of the test material
A bulk sample of MWNT-7 (also known as Mitsui-7, XNRI-7, and MWCNT-7; lot, 060125-01k), gratefully obtained from Mitsui & Co. (Tokyo, Japan), was pretreated with a filtration method known as the “Taquann” method, to obtain a well-dispersed sample. The Taquann method enables the removal of agglomerates and aggregations of fibers in the sample without altering the size distribution and characteristics of the fibers by employing a fine filtration method (a 25-µm mesh) followed by a critical point drying technique (Taquahashi et al., 2013). The Taquann-treated MWCNT was suspended in 0.9% saline solution containing 0.1% Tween 80 at a concentration of 0.02 mg/mL, and then sonicated for 30 min using an ultrasonic bath (100W) (US-702, SND, Nagano, Japan). MWNT-7 has been fully characterized including length and diameter distributions and impurity contents in our previous reports (Taquahashi et al., 2013; Sakamoto et al., 2018).
Animals and treatments
Two pairs of C57BL/6 homozygous Ccr2-KO mice (Boring et al., 1997) were purchased from the Jackson Laboratory (Bar Harbor, ME, USA) and then bred to generate the mice used in the experiments. The deficiency of Ccr2 gene was genetically and functionally confirmed (Fig. S1). As for WT mice groups, 56 specific pathogen-free C57BL/6 male mice were purchased from the Jackson Laboratory. The mice were kept in a controlled atmosphere with temperature of 22.9 ± 0.1oC and relative humidity of 53.2 ± 5.5%, and a 12-hr light-dark photophase cycle was maintained. Animals were given a standard diet, namely CE-2 (CLEA Japan, Tokyo, Japan), and sterile tap water ad libitum. They were housed individually in sterile plastic cages with paper bedding (Alpha-Dri, Shepherd Specialty Papers, Watertown, TN, USA).
Male mice from both WT and KO populations, were randomly divided into two groups, vehicle control and MWCNT treatment groups (consisting of 24 and 32 animals, respectively) (Table 1). At nine weeks of age, when their body weights were 24.9 ± 1.1 g and 23.8 ± 1.1 g (WT and KO, respectively), the mice from the treatment group were dosed with a single i.p. injection of 10 µg of MWNT-7 (approximately 0.4 mg/kg body weight) at a volume of 0.5 mL/mouse (corresponding to approximately 20 mL/kg body weight). The mice were then necropsied sequentially at 1, 7, 28, 90, and 245 day(s) after injection (5, 5, 5, 8, and 9 animals, respectively). The vehicle controls in both WT and KO mice groups were similarly treated with saline containing 0.1% Tween 80 (4, 4, 4, 5, and 7 animals, respectively) (Table 1). All these animals were included in each analysis unless otherwise noted.
Table 1. The disposition of the animals in this study.
|
Group |
Starting animal number |
day 1 |
day 7 |
day 28 |
day 90 |
day 245 |
| WT |
control |
24 |
4 |
4 |
4 |
5 |
7 |
| MWCNT |
32 |
5 |
5 |
5 |
8 |
9a) |
| KO |
control |
24 |
4 |
4 |
4b) |
5 |
7c) |
| MWCNT |
32 |
5 |
5 |
5 |
8 |
9 |
a) One mouse died from a severe peritoneal mesothelioma (at day 224)
b) A PEC sample was missing; effective number: 3
c) One mouse died from unknown cause (at day 12); effective number: 6
This study was conducted according to the Animal Research Reporting of In Vivo Experiments (ARRIVE) guideline. The experimental protocol was approved by the Animal Experiment Committee of the Tokyo Metropolitan Institute of Public Health. The facilities are accredited by Japan Pharmaceutical Information Center.
Autopsy and sample collection
At each scheduled sacrifice mice were euthanized by exsanguination through the heart after anesthetizing with 3% isoflurane (Pfizer, New York, NY, USA). Peritoneal lavage fluids (PLFs) were collected from all but two animals. Two mice died before the scheduled autopsies (Table 1). Peritoneal cavities were lavaged through an incision in the rectus abdominis muscle (30 mm), twice with total 2.5 mL of phosphate-buffered saline (PBS) (pH 7.2) using a disposable pipette. Two mL of the wash-out solution was collected and centrifuged at 400 g at 4oC for 10 min. Aliquots of the supernatant solution of the lavage fluid were collected and stored at −80oC for biochemical analyses, while the pellets (peritoneal exudated cells (PECs)) were further divided to prepare samples for 3 analyses: one was immediately resuspended in PBS containing 2% bovine serum albumin (BSA) for cytological analysis; another was used for flow cytometric analysis; and the other fraction of PECs was snap frozen in presence of liquid nitrogen and stored at −80oC for molecular biological analysis.
For histopathological examination, organs and tissues with peritoneum, including diaphragm, liver, pancreas, spleen, stomach, small intestine, large intestine, kidneys, and left and right abdominal walls, were harvested.
Histopathology
All dissected organs, tissues, and tumor masses were fixed in 10% neutrally buffered formalin and were processed routinely to prepare paraffin-embedded sections and were stained with hematoxylin and eosin (H&E). For observation of MWCNT fibers in the tissues, H&E sections were observed with a pair of polarized lenses (U-ANT/U-POT, Olympus, Tokyo, Japan).
For immunostaining, antigen retrieval was performed in 10 mM citrate buffer (pH 6.0; RM 102-C, LSI Medience, Tokyo, Japan) or Tris-EDTA buffer (pH 9.0; 415211, Nichirei, Tokyo, Japan) using a microwave for 15 min followed by the inactivation of endogenous peroxidase by immersion in H2O2 for 10 min. After blocking, the sections were treated with primary antibodies; CCR2 (ab273050; abcam, Cambridge, UK) and cytokeratin 5 (ab53121; abcam). Horseradish peroxidase-secondary antibody conjugate (ab214880; abcam) was used for the detection of diaminobenzidine signals, as per the manufacturer’s instructions. Sirius red staining was performed in accordance with the standard protocol. The average thickness of the liver capsule was calculated by measuring the distance from the outer surface of the liver to the mesothelium at intervals of 500 μm for entire circumference of the section (using 4 animals; 2–4 sections of each animal (Fig. S2A). For the quantification of collagen fiber area, total thickened area was measured manually, and the areas of red colored pixels (representing collagen fibers) were quantified using ImageJ software (National Institutes of Health). “Fibrosis ratio” was calculated by dividing the red area (collagen fiber area) by the total thickened area (Fig. S2B). For each group, 20–40 images containing thickened areas were randomly selected (using 4–5 animals; 2 sections of each animal) and analyzed. Details of measuring the thickness and fibrosis ratio are shown in Fig. S2.
Cytology
PECs recovered after centrifugation of the PLF, were stained with Turk’s solution, and the number of leukocytes was determined using a hemocytometer slide. For differential leukocyte counts, cytoslides were prepared by using Cytospin, CF-120 (Sakura Finetek Japan, Tokyo, Japan), stained with May–Grunwald–Giemsa solution, and the slides were examined under a microscope. Each result was represented as “cell number per mL” with a body weight that was normalized to 25 g for appropriate comparisons in different groups and time points (usually 2 mL of PLF was retrieved from an animal). Percentages of foreign body giant cells (FBGCs), defined as macrophages with 3 or more nuclei per cell, were calculated by counting 500 macrophages for each slide.
Flow cytometry
PECs were treated with an ammonium chloride-based lysing reagent (Lysing Buffer, 555899, BD, Franklin Lakes, NJ, USA), and then incubated in PBS containing 0.2% BSA with anti-CD16/32 monoclonal antibody (mAB) (101302; BioLegend, San Diego, CA, USA) to prevent nonspecific binding. The number of total leucocytes was counted as positive cells of APC-Cy7-anti-CD45 mAB (561037; BD) (Fig. S3A). PECs were further divided into two aliquots, one for Ly-6C/MHCII analysis and the other for M1/M2 analysis. For the aliquot of Ly-6C/MHCII, cells were treated with PE anti-F4/80 (565410; BD), BV421 anti-CD11b (562605; BD), APC anti-Ly-6G (127613; BioLegend), PE-CF594 anti-Siglec-F (562757; BD), FITC anti- Ly-6C (128005; BioLegend), and PE-Cy7 anti-I-A/I-E (MHC class II (MHCII)) (107629; BioLegend) mABs (Fig. S3A). From the aliquot of M1/M2, cells were stained with PE anti-F4/80, BV421 anti-CD11b, APC anti-CD80 mAB (560016; BD), and then BV 605 anti-CD206 mAB (141721; BioLegend) (Fig. S3B) after fixing with formaldehyde followed by permeabilization with a Transcription Factor Buffer containing formalin and saponin (562725, BD). Flow cytometric analysis was performed using CytoFLEX S (Beckman-Coulter, Brea, CA, USA). All surface markers which these mABs bind to are listed with the target cells in Fig. S3C.
Quantitative real-time polymerase chain reaction (qRT-PCR)
The frozen PECs (N = 4 per group per time point) were treated with a homogenizing buffer (RLT Buffer, Qiagen, Venlo, Netherlands). Total RNA from the homogenates was extracted using RNeasy Mini kit (Qiagen) following the manufacturer’s instructions. First-strand cDNA was obtained by using SuperScript III First-Strand Synthesis Super Mix (Thermo Fisher Scientific, Waltham, MA, USA). qRT-PCR assays were performed by using an SYBR Green Master Mix (Thermo Fisher Scientific) using gene specific primer sets (Table S1) and standard curve series from 102 copies to 108 copies of plasmids, containing full length cDNAs. A 7500 Fast Real-time PCR System (Thermo Fisher Scientific) was used for the experiments. The expression level of the target gene was normalized to that of H2az.
Enzyme-linked immunosorbent assay (ELISA)
Levels of mesothelin/N-ERC (27783; IBL, Gunma, WJapan), High-mobility group protein-B1 (HMGB-1) (ARG81310; Arigo Biolaboratories, Taiwan R.O.C.), CCL2 (ELM-MCP-1, Ray Biotech, Peachtree Corners, GA, USA), C-X-C motif chemokine ligand 1 (CXCL1) (ELM-KC, Ray Biotech), and transforming growth factor β1 (TGF-β1) (MB100B, R&D systems, Minneapolis, MN, USA) in the PLF supernatant solutions were measured using ELISA kits as per the manufacturer's procedures. Each result was represented as “ng or pg per mL” with a normalization of each body weight to 25 g for appropriate comparisons in different groups and time points (usually 2 mL of PLF was retrieved from an animal).
Statistical analysis
Differences of values between the 2 groups; i.e., MWCNT-treated group and control group; or WT group and KO group for each time point; were analyzed by Mann-Whitney U test in histological, cytological, molecular biological (qRT-PCR) and flow cytometric analyses, or by Student’s t-test in biochemical analyses (ELISA). Two-tailed tests were used for all statistical analyses. Differences in values were deemed significant when p-values were less than 0.05. StatLight software (Yukms, Kanagawa, Japan) was used for the statistical analyses. For all analyses, significant differences between the MWCNT-treated group and time-matched control group are shown by asterisks (*), while significant differences between the WT group and KO group (regardless of treatments) are shown by hash marks (#).
RESULTS
Pathological findings of the peritoneum
Our long-term analysis demonstrated that a strong acute inflammatory response and the associated fibrogenic and neoplastic changes were induced by a single administration of MWNT-7, and that there were subtle differences in these findings between the WT and KO groups (Figs. 1 and 2). At day 1, marked infiltration of neutrophils, eosinophils and aggregation of macrophages engulfing MWCNTs were observed on the surfaces of the peritoneal organs such as liver (Fig. 1) and pancreas (Fig. 2). A large part of administered MWCNT fibers had already been encapsulated within granulomatous foci that included aggregated macrophages (Figs. 1A–1C), many of which were immunohistochemically positive for CCR2 in WT mice (Figs. 1C1 and S4). It was observed that the granulomas consisting of fractured macrophages or acellular debris were found more commonly in the KO mice (Figs. 1I and 1J) compared to WT mice. Lesions with aggregated macrophages engulfing MWCNT were also found in KO mice (Fig. 1K), but as expected, these cells were not immunohistochemically positive for CCR2 antibody (Figs. 1K1 and S4). At the end of day 7, a growth of fibroblasts was prominently evident following the subsidence of the initial inflammatory response, and at day 28, a substantial number of fibrotic components were seen to have deposited beneath the regenerated mesothelial layers in both WT and KO mice (Figs. 1D, 1E, 1L, and 1M). Formations of MWCNT-associated granulomas were prominent, and these large granulomas were composed of fibrotic components, multinucleated macrophages (or FBGCs), and bundles of MWCNT fibers (Figs. 1F, 1F1, 1N, and 1N1). After day 90, thick collagenous sheets were observed on the surfaces of abdominal organs, such as the liver (Figs. 1G, 1H, 1O, and 1P), spleen, and stomach. Of note, severe fibrotic lesions with hyaline rich bundles of collagen were observed in WT mice at day 245 (Fig. 1H). On the contrary, the fibrotic lesions in the KO mice contained a relatively small amount of collagenous components, instead, large number of inflammatory cells and/or immature fibrotic cells, even if the thickness of the peritoneum (mesothelial cells and underlying connective tissues) was similar to that in WT mice (Figs. 1G1, 1H1, 1O1, and 1P1). For a more quantitative comparison of fibrotic change between WT and KO mice, the thicknesses of the peritoneum and levels of collagen deposition (“fibrosis ratio”) on the surface of the liver were evaluated from day 7 to day 245 (Figs. 1Q and 1R). Values of the thickness of the peritoneum on day 7 were comparable to those at days 28 and 90 due to the infiltration of inflammatory cells and growth of fibroblasts (Fig. 1Q). There were no significant differences in the thicknesses of the lesions between WT and KO mice, except for the fact that a significantly higher value was observed in KO mice at day 7. Meanwhile, the collagen deposition demonstrated a time-dependent increase in both MWCNT-treated groups (Fig. 1R). While the fibrosis was observed to have progressed at days 90 and 245, the fibrosis ratio was significantly lower in the KO mice than in WT mice.
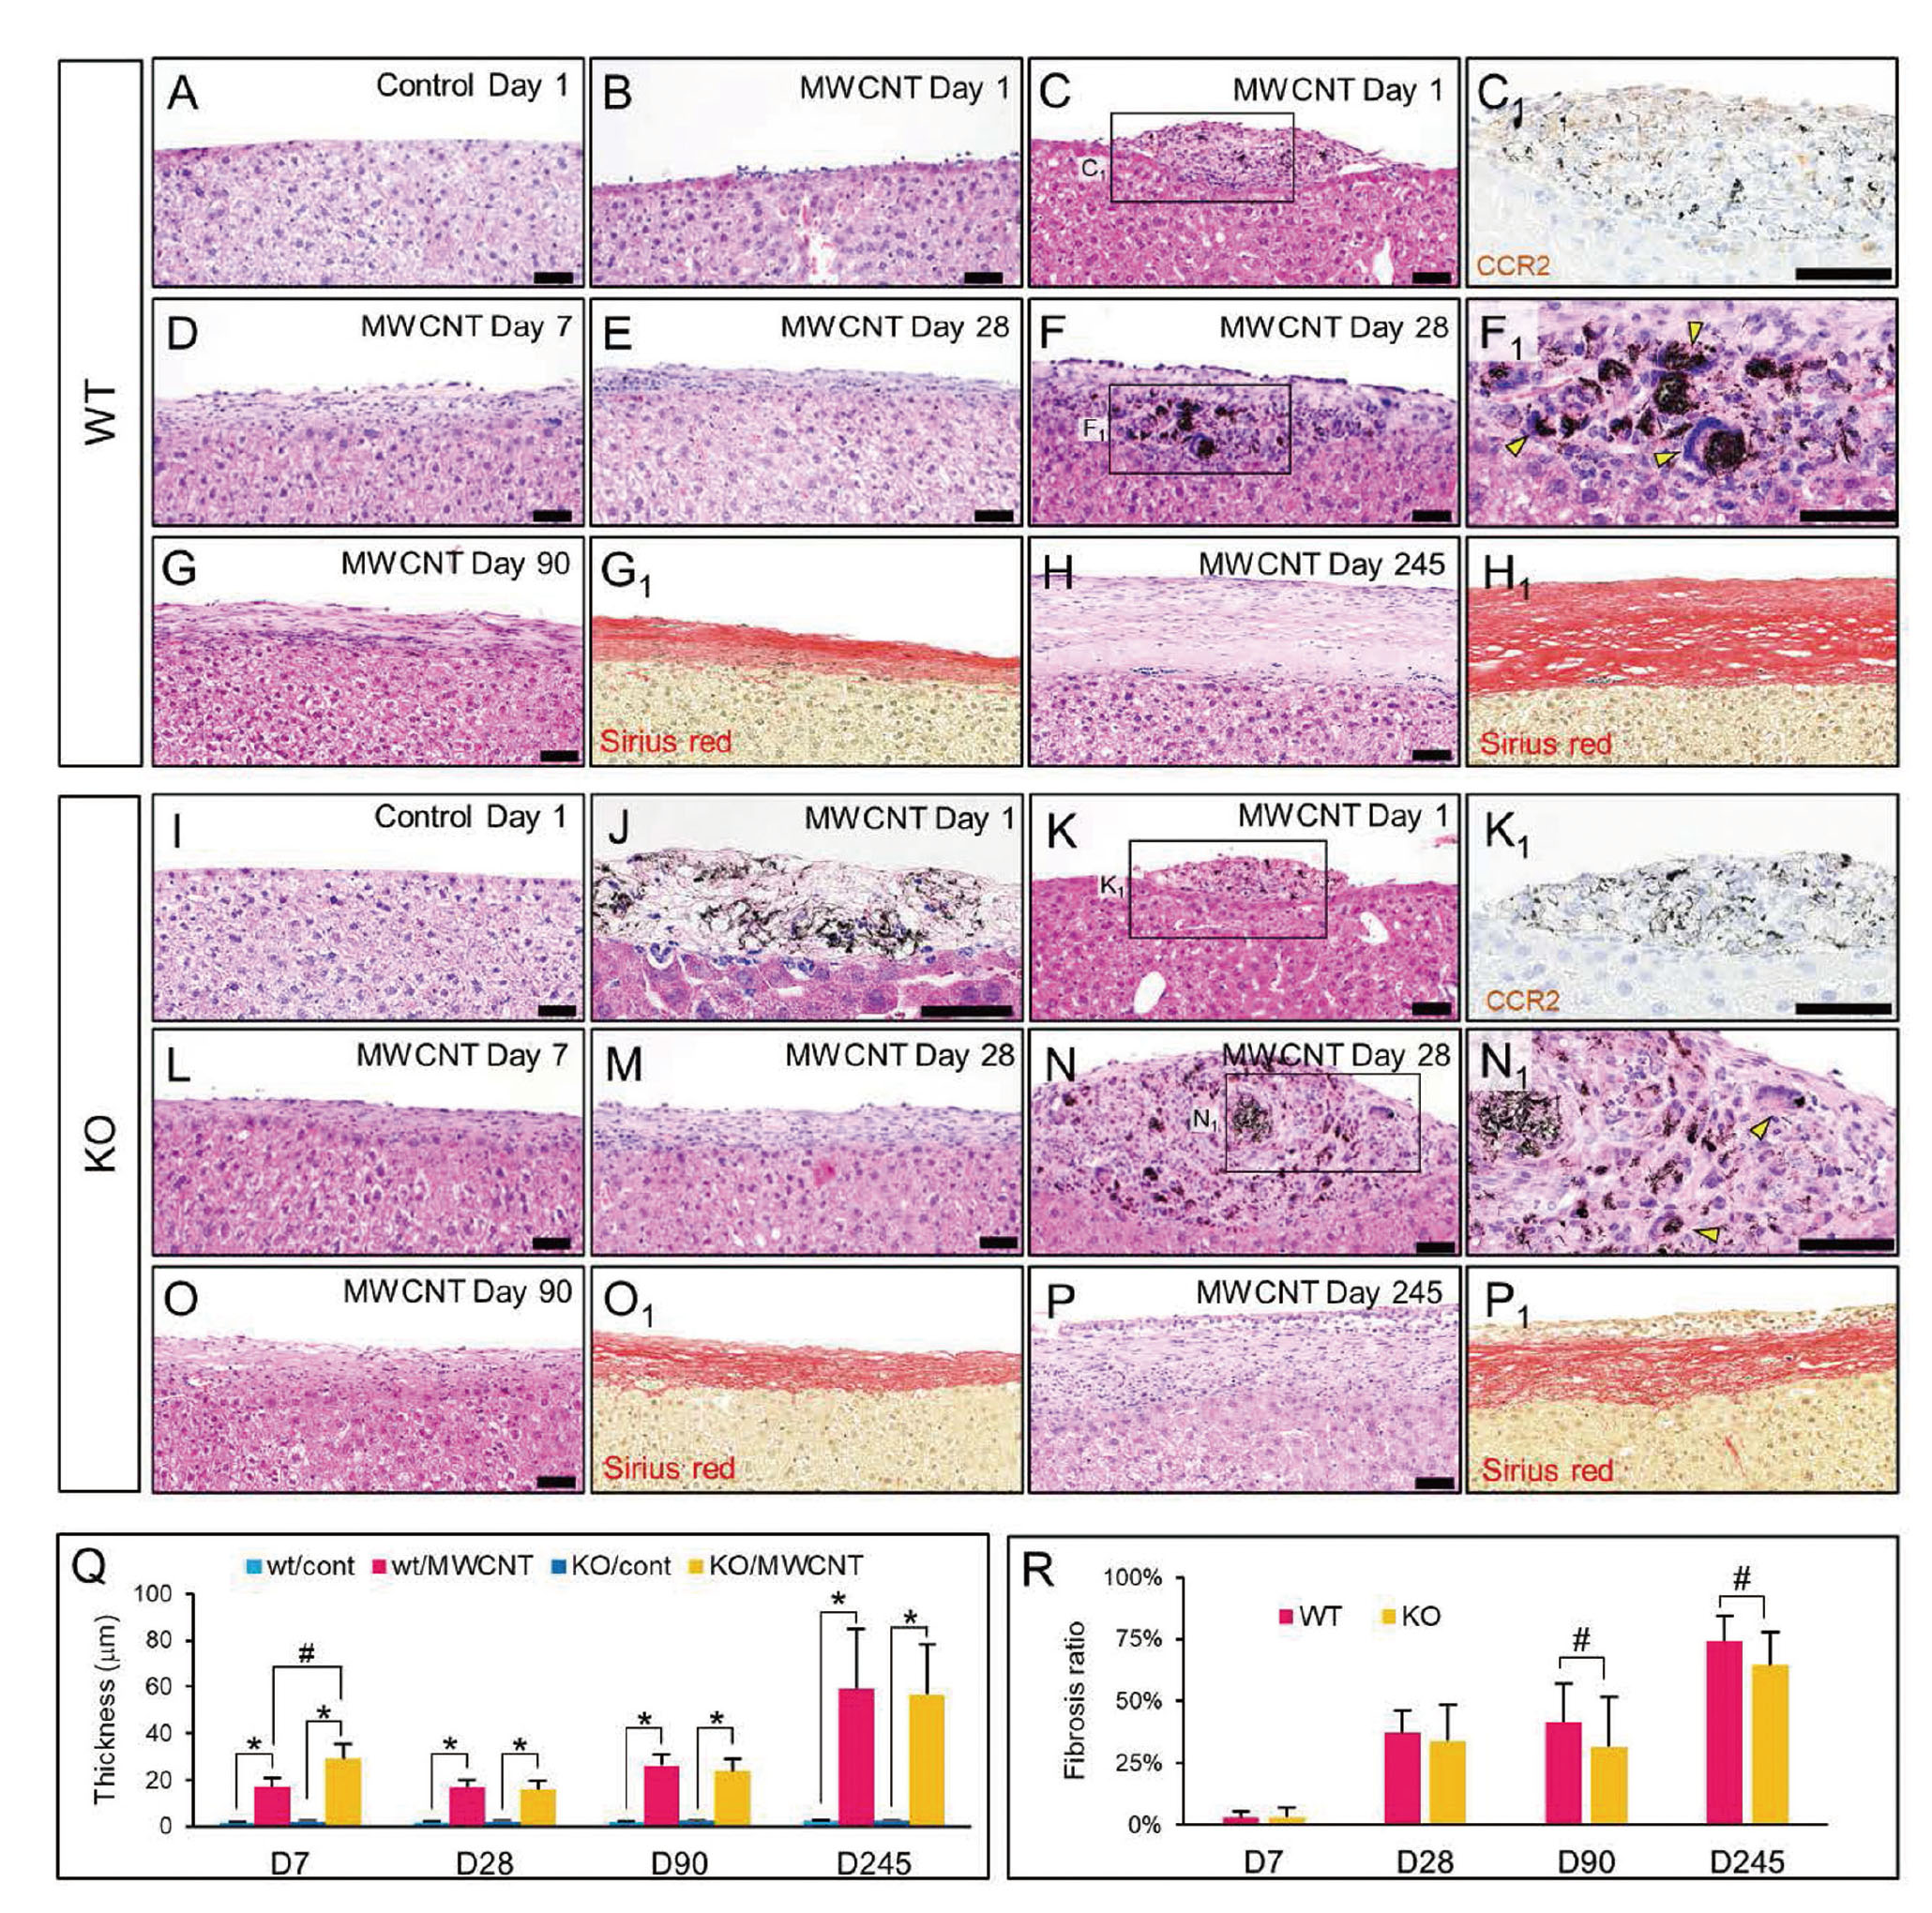

MWCNT-associated immune responses and proliferative changes in mesothelial cells were obvious at the serosal membrane attached to the pancreas and fat-associated lymphoid clusters (FALCs) surrounding it (Fig. 2A). Edematous thickenings of the peritoneum, containing free MWCNT fibers or MWCNT fibers engulfed by macrophages, and many neutrophils were present in MWCNT-treated groups similar to those observed on the liver surface at day 1. An accumulation of the fiber laden macrophages and neutrophils was noticed in FALCs at day 1 (Figs. 2B and 2B1). After day 28, accumulations of plasma cells and fibrotic changes were noted (Figs. 2C, 2C1, and 2G). Singular MWCNT fibers or bundles of MWCNT fibers were still frequently observed in macrophages, and FBGCs appeared within the inflamed mesothelial tissue (Figs. S5A and S5B). In association with these inflammatory lesions, mesothelial cells often appeared enlarged and hyperplastic after day 28 (Fig. 2C). Nine mice from the MWCNT-treated group were prepared to be necropsied at day 245 after injection (Table 1). Among the nine mice, three had atypical mesothelial hyperplasia (AMH) (30.0%) and one mouse from the WT group had developed malignant peritoneal mesothelioma (dead at day 224) (11.1%). Meanwhile, in the KO group, three mice had AMH (30.0%) and one mouse exhibited a very early stage of mesothelioma (11.1%). The AMH cells were characterized by a cuboidal or elliptical shape with large nuclei and prominent nucleoli (Figs. 2D and 2H). Occasionally the cells were binucleate. Cytologically atypical mesothelial cells expanded as a single layer on the serosal surface, and they also irregularly protruded as single cells showing a “hobnail appearance” (Takagi et al., 2012) (Figs. 2D and 2H). Sub-mesothelial tissues beneath the AMH lesions were thickened accompanied with fibroblasts and immune cells including macrophages engulfing MWCNTs (Figs. 2D, 2D1, and 2D2). The peritoneal mesothelioma found in the dead animal from the WT group demonstrated aggressive invasion to the liver and diaphragm (Figs. 2E and S5C). The tumor was diagnosed as a biphasic type mesothelioma, and a large portion of the sarcomatoid lesions exhibited rhabdoid features. As shown in high-powered views of mesotheliomas (Figs. 2F and S5D), tumor cells were discohesive, and exhibited a diverse pleomorphic shape, abundant eosinophilic cytoplasm, and a huge pleomorphic nucleus or an eccentric nucleus with prominent nucleolus. Mesotheliomas with rhabdoid morphology is a rare subtype of the human MPM and are associated with a poor prognosis (Ordóñez, 2006; Nicholson et al., 2020). Peritoneal mesotheliomas with rhabdoid subtype histology were also detected in p53 heterozygous mice (Takagi et al., 2012) or F344 rats i.p. injected with MWNT-7 (Hojo et al., 2021). The mesothelioma found in a KO mouse, diagnosed as epithelioid type mesothelioma showed papillary or mushroom-like histological patterns, and these protrusions were multifocally observed in the serosa attached to the pancreas (Figs. 2I, S5E, and S5F). Tumor cells were immunohistochemically positive for cytokeratin 5 (one of the mesothelioma markers, Fig. 2I, inset).
For obtaining more information and a quantitative assessment of the growth of mesothelial cells, we analyzed two biomarkers, mesothelin/N-ERC and HMGB-1, in the supernatant solutions of the PLFs at days 90 and 245. Levels of mesothelin/N-ERC, one of the most sensitive mesothelioma markers (Sakamoto et al., 2010; Hojo et al., 2021), was found to be significantly elevated, 90 and 245 days after MWCNT administration in both WT and KO mice (Fig. 2J). HMGB-1 is a nuclear protein released extracellularly following the death of macrophages and mesothelial cells. It causes activation of inflammasomes, and it is also involved in mesothelioma development (Hiraku et al., 2016; Saleh et al., 2022). Concentrations of HMGB-1 were significantly enhanced in both WT and KO mice 90 days and 245 days after MWCNT injection (Fig. 2K). There were no significant differences in the levels of both markers between WT and KO mice.
General responses of immune cells in the peritoneal cavity after the MDR
Cytological analysis revealed a dynamic alteration in immune cells responses after single dosing of the mice with MWCNT (Fig. 3A). A massive influx of neutrophils was a common and major response in both WT and KO mice at day 1. The presence of a small fraction of macrophages was observed in WT mice, while almost all macrophages disappeared in KO mice (Fig. 3A). Macrophages and lymphocytes formed a major portion of the PECs in vehicle controls, although a slight infiltration of neutrophils was also observed at day 1. The macrophage fractions gradually increased in MWCNT-treated WT and KO mice after day 7 and granulocytic inflammation persisted even at later time points. Of note, although the macrophage fraction in the PECs was restored in KO mice after day 7, the population size of macrophage was still significantly smaller than in WT mice throughout the experimental period (Fig. 3A, Table S2), suggesting a persistent contribution of the Ccr2 gene in macrophage recruitment. From day 28, the total numbers of PECs in the treated groups decreased gradually, and a marked decline was observed at day 245 (Fig. 3A). The relatively lower numbers of cells in the MWCNT-treated groups were probably because of the expansion of the fibrotic tissues over the surface of organs and serosa, covered the lymphatic micro ducts and FALCs ordinary buried under the single-layered mesothelium. A significant increase in cell numbers of the vehicle controls at day 245 compared to day 90 seemed to be related to aging (Murciano et al., 2008).

Representative microscopic images of PECs on May–Grunwald–Giemsa slides are shown in Fig. 3B. Many neutrophils were detected in the MWCNT-treated WT and KO groups, and the decline in macrophage number was obvious in the KO samples at day 1. The appearance of the macrophages varied from small, monocytic cells (SPM-like) to large ones with foamy cytosols (LPM-like) (Fig. 3C), although distinguishing between SPMs and LPMs on the basis of observations under the microscope was difficult. In addition, FBGCs were observed in both WT and KO mice from 7 days to 245 days after the MWCNT injection (Fig. 3D). While the percentage of the FBGC in the total macrophage population was highest at day 7 and declined after day 28 in WT mice, it peaked at day 28 and day 90 in KO mice (Fig. 3E).
To understand the molecular basis of the behavior of the immune cells and mesothelial tissue after the injury caused by MWCNT, we analyzed some humoral factors and/or their receptors by ELISA (Figs. 4A–4C) or qRT-PCR (Figs. 4D–4F). The concentration of CCL2 in the PLF was significantly elevated in MWCNT-exposed WT mice, while it remained almost undetectable in vehicle-injected mice at days 1 and 7 (Fig. 4A). The concentration of CCL2 in the MWCNT-treated group was similar in the control group at the later time points in WT mice. However, mRNA expression levels of Ccl2 and Ccr2 in the PECs of WT mice were significantly higher in the MWCNT-treated group than in the vehicle controls at all examined time points (Figs. 4D and 4E). Interestingly, the levels of CCL2 were observed to be significantly high in MWCNT-exposed KO mice than in WT mice, with an extremely high level of production in KO mice at day 1 (Fig. 4A). Transcripts of Ccr2 were expectedly never detected in samples of KO mice (Fig. 4E). These data suggested CCL2-CCR2 axis was highly active in the early phase after the insult of peritoneum by MWCNT, and slowed down after one month, but the axis was persistently active for eight months. The repopulation of macrophages after day 7 in KO mice, as evident from the cytological analysis (Fig. 3A) suggests a contribution of CCR2-independent macrophage recruitment routes. Hence, the alternative macrophage migration route, CX3CL1 (fractalkine)-CX3CR1 axis, was examined. A transcript of Cx3cr1 was significantly upregulated in the MWCNT-treated groups in both WT and KO mice, and interestingly, the mean expression levels of Cx3cr1 in KO mice were slightly but significantly higher than those in the WT treated mice at days 1, 28, and 245 (Fig. 4F). In addition, concentrations of the main chemokine for neutrophils, CXCL1, were significantly elevated in the MWCNT-treated groups at all the time points (Fig. 4B). The levels were significantly higher in KO mice than in WT mice at day 1, and thereafter, the levels were similar in both groups. The pattern of CXCL1 concentrations at days 1 and 7 was consistent with the findings of the infiltration of neutrophils in cytological and flow cytometric analyses. Regarding anti-inflammatory signaling, levels of TGF-β1 in the PLFs were evaluated by ELISA. Concentrations of TGF-β1 were constantly higher in the MWCNT-treated groups at all time points and no marked differences were found between WT and KO mice (Fig. 4C).

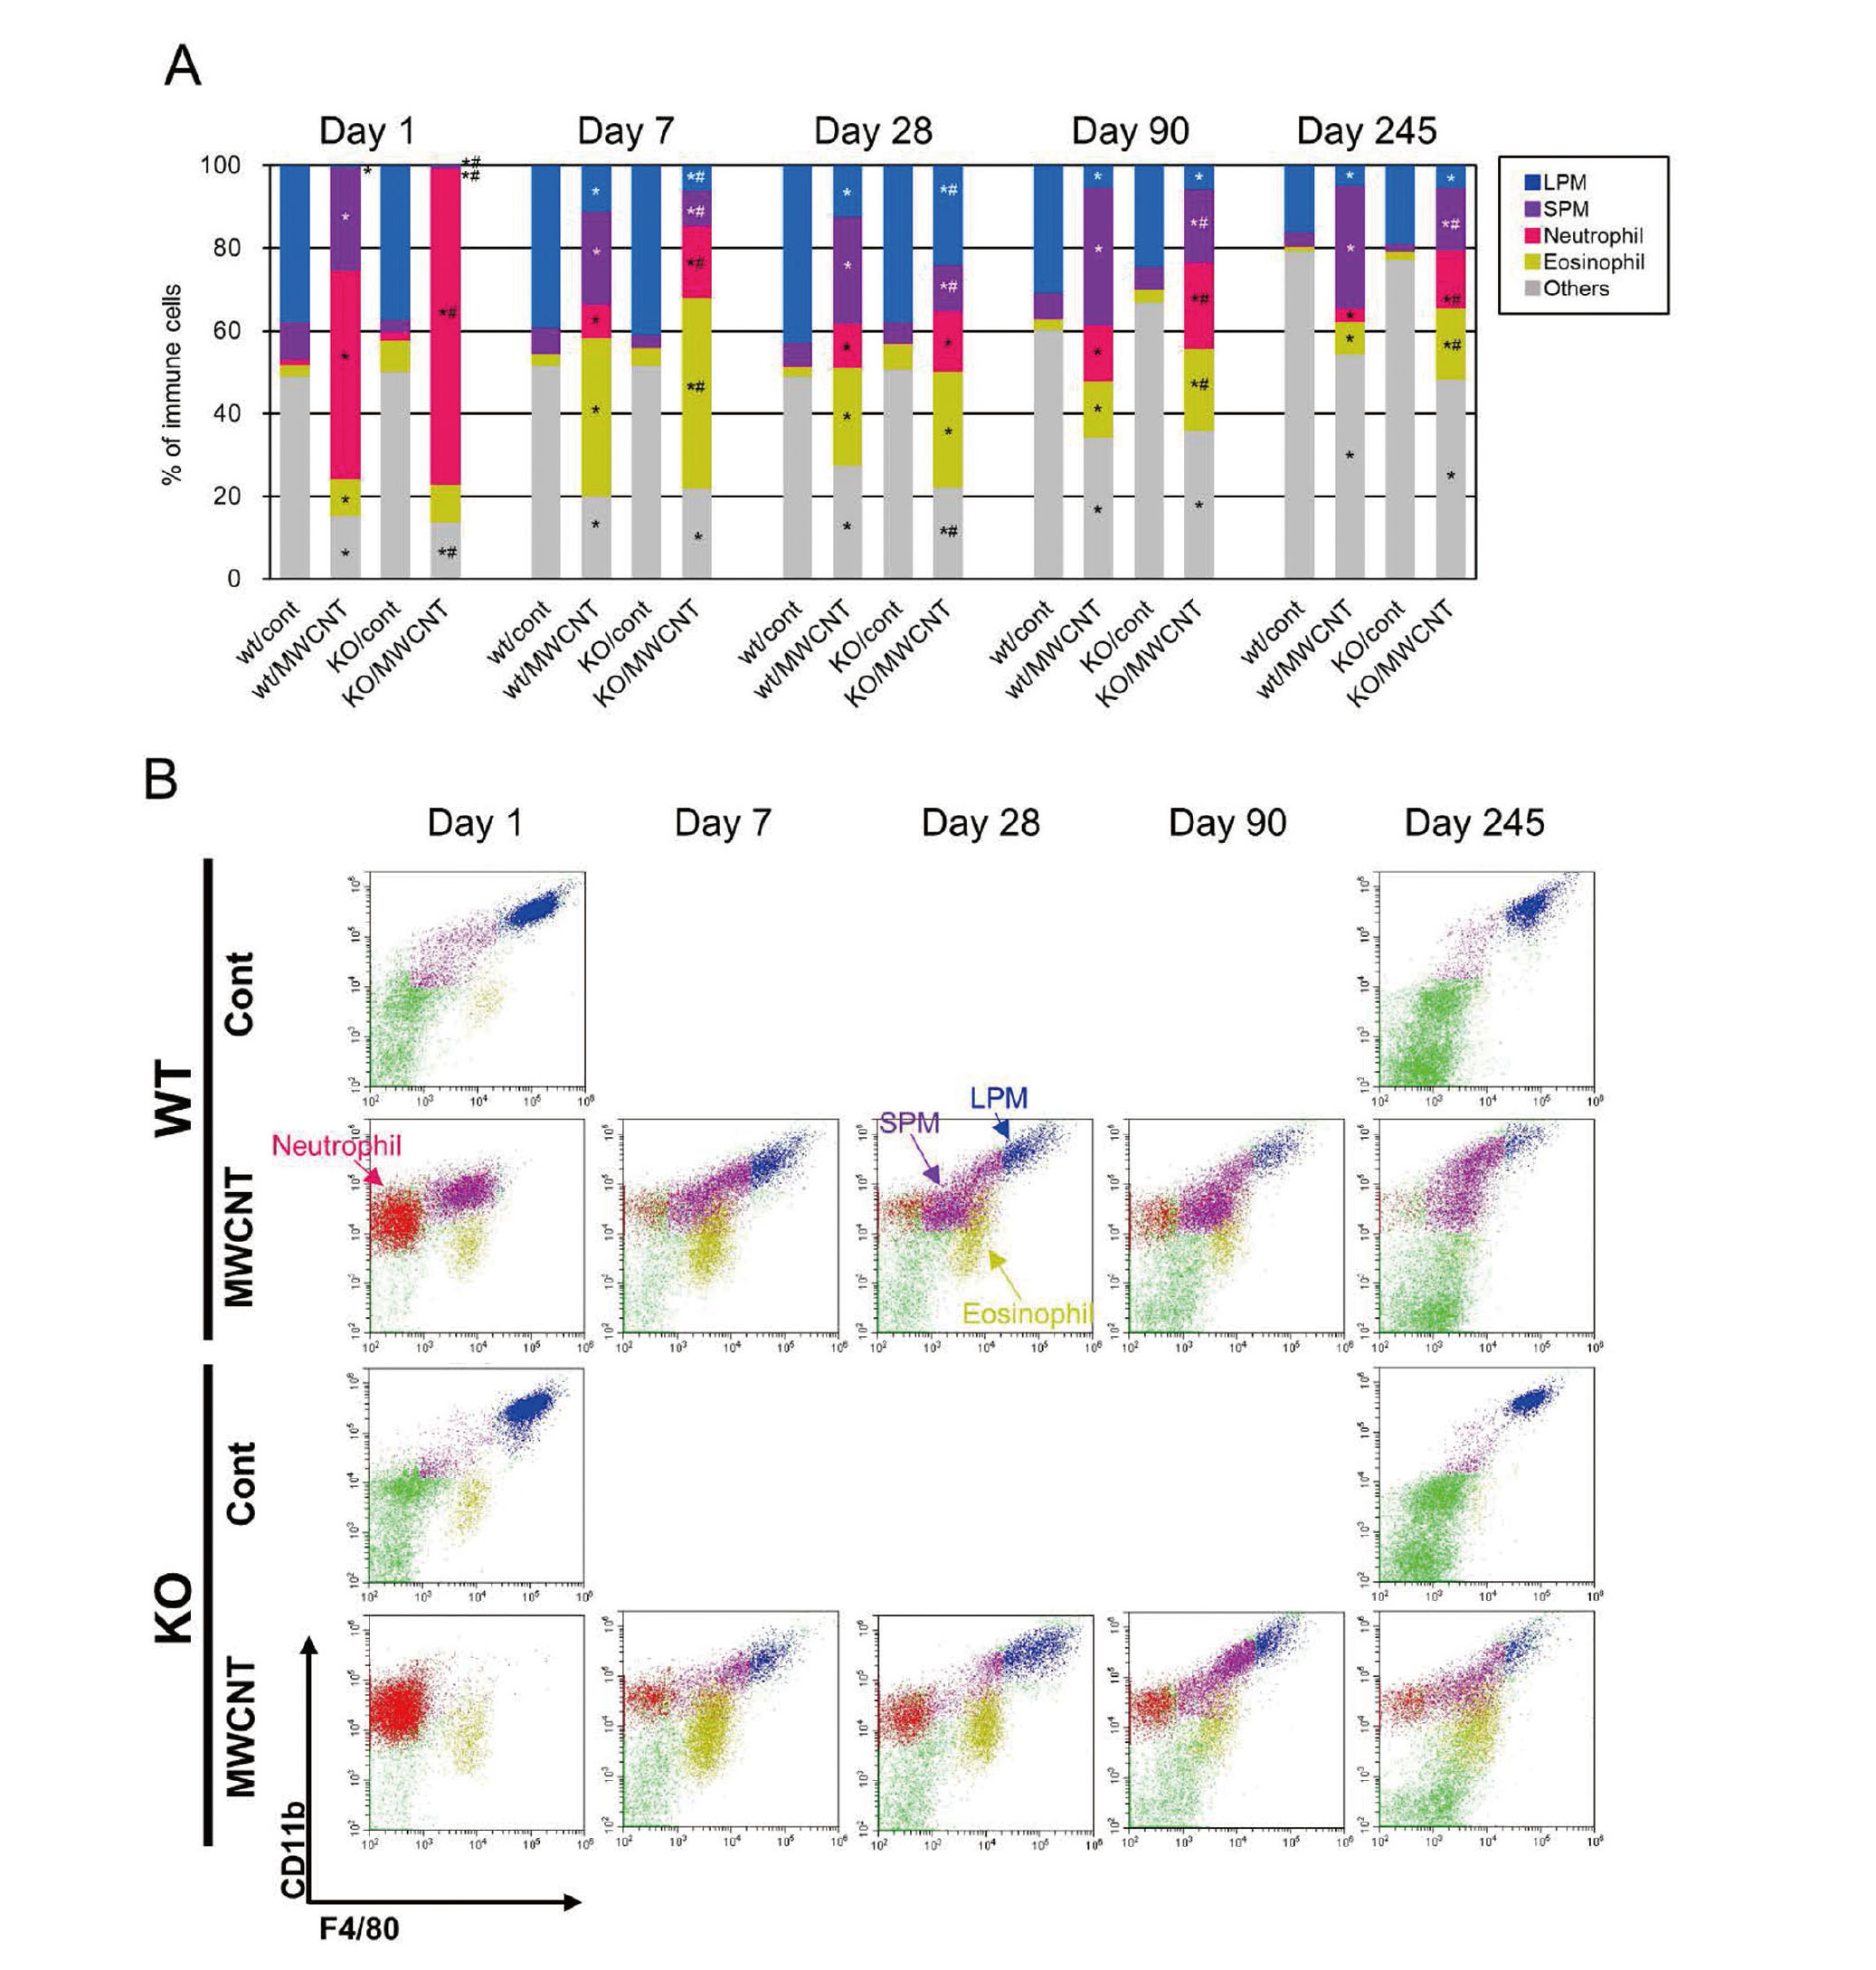
In steady-state, peritoneal macrophages consist of two different subsets, LPM and SPM. Majority (90%) of the resident (homeostatic) macrophages are LPMs, while SPMs account for 10% of the steady-state population, which are observed to predominate following disappearance of macrophages after inflammatory stimulations by lipopolysaccharide (LPS) or thioglycolate (Ghosn et al., 2010; Cassado et al., 2015). Using a gating strategy shown in Fig. S3A, percentages of the two subsets of macrophages, neutrophils, and eosinophils were analyzed (Fig. 5A and Table S3). Each set of observations pertaining to macrophages and granulocytes was roughly comparable to the results of cytological examination obtained by May–Grunwald–Giemsa staining (Fig. 3A, Table S2). Time-course variations in these immune cells are demonstrated in a panel of representative dot graphs with CD11b and F4/80 (Fig. 5B). The PECs of vehicle controls of WT and KO mice mainly consisted of LPMs (CD11bhigh F4/80high), SPMs (CD11bint F4/80int), and a few eosinophils (CD11blow F4/80int). One day after the MWCNT treatment, LPMs disappeared completely from WT mice, but SPMs sustained, while both LPMs and SPMs mostly failed to appear in KO mice. Until day 7, the LPMs had repopulated, but the SPMs still predominated in the macrophage fraction of MWCNT-treated mice of both WT and KO, which persisted until day 245. Interestingly, the fractions of SPM remained diminished in KO mice (approximately 50% lower than in WT) even after the repopulation of macrophages. (Fig. 5A).
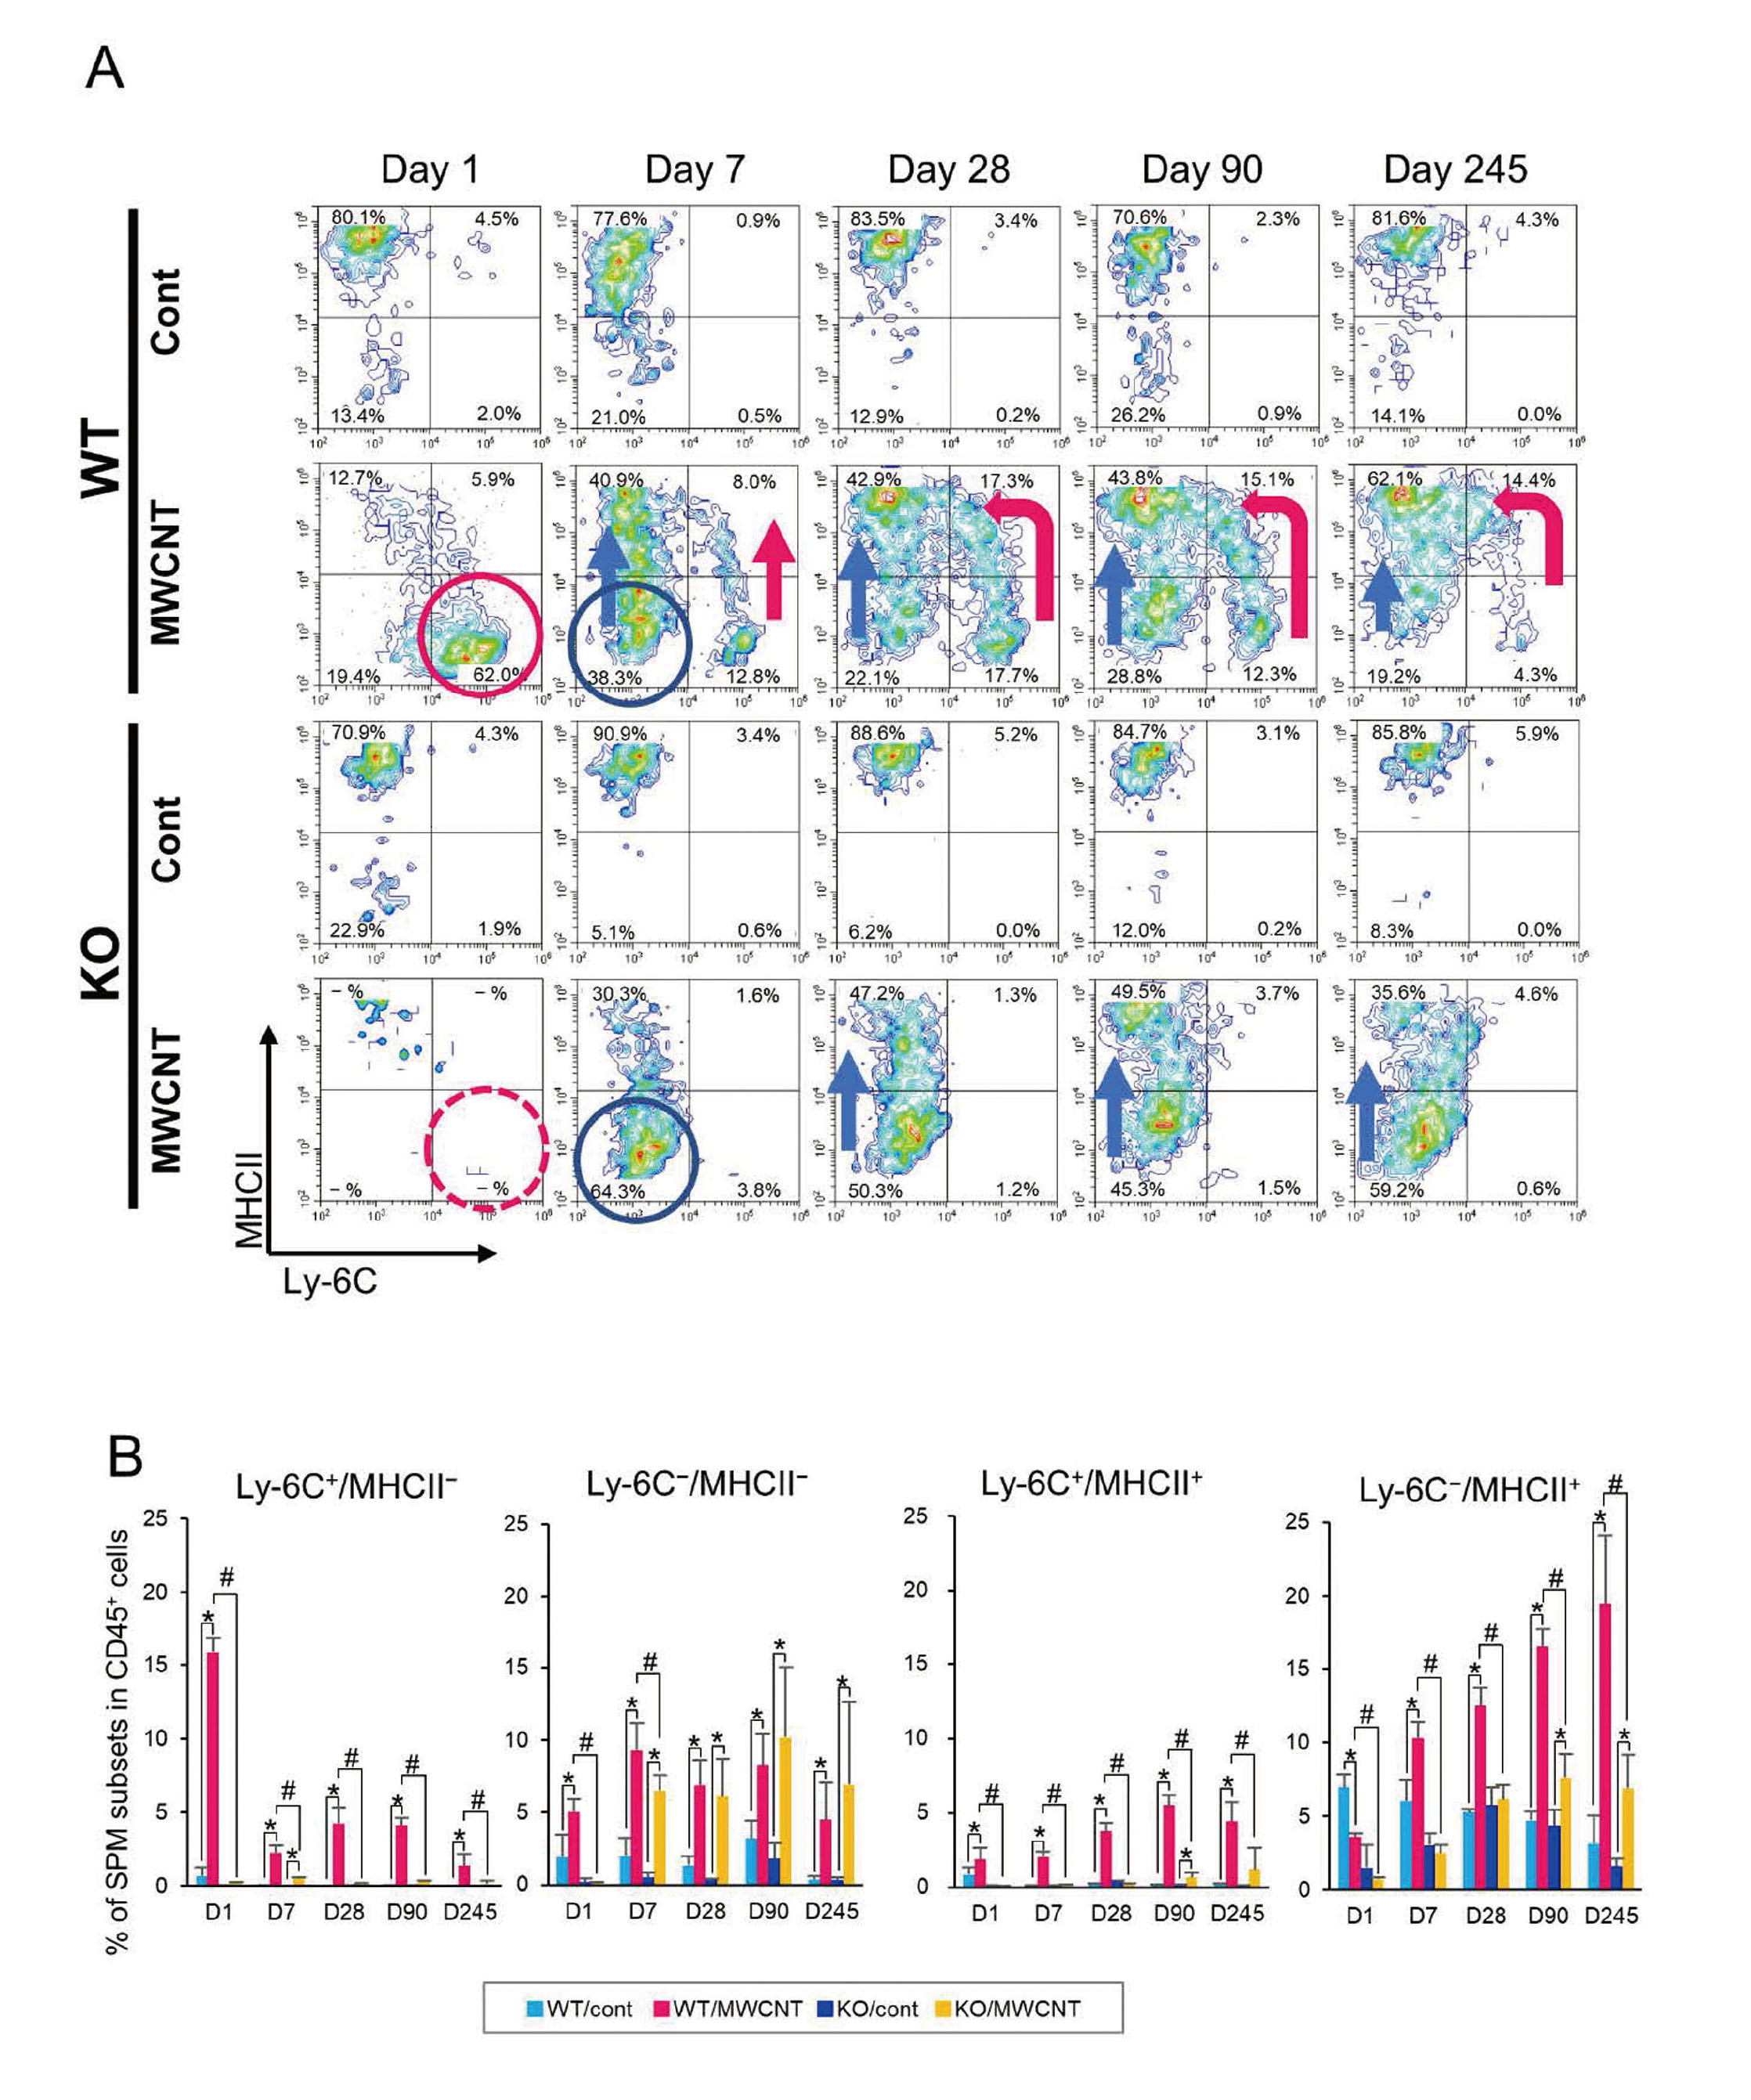
To further explore the pattern of migration and differentiation of macrophages, we investigated the SPM population using two surface markers, Ly-6C and MHCII (Fig. S3A). Generally, monocytes in the blood and macrophages reaching the peritoneal cavity via CCL2 route show a molecular signature, Ly-6C+MHCII− (Geissmann et al., 2003), and the macrophages begin expressing MHCII after losing Ly-6C in the abdominal cavity (Ghosn et al., 2010).
In vehicle controls of both WT and KO mice, most SPMs were Ly-6C−MHCII+ cells (Figs. 6A and 6B). One day after the MWCNT treatment, most Ly-6C−MHCII+ cells disappeared from WT mice, and instead, a large number of migratory macrophages Ly-6C+MHCII− were detected (Fig. 6A, red circle). From day 7, another population, Ly-6C−MHCII− cells were detected (Fig. 6A, blue circle). Thereafter, the percentage of Ly-6C−MHCII+ cells gradually increased in a time-dependent manner (Figs. 6A and 6B), and this population appeared to be shifting away from the Ly-6C+MHCII− (Fig. 6A, red arrow; with an intermediate state, Ly-6C+MHCII+) and from the Ly-6C−MHCII− population (Fig. 6A, blue arrow). In MWCNT-treated KO mice, the Ly-6C+MHCII− cells were never detected throughout the experimental period, but instead the Ly-6C−MHCII− population was observed from day 7 and these cells seemed to constantly transition to the cells expressing MHCII+ (Figs. 6A and 6B).
M1 and M2 status of the peritoneal macrophages
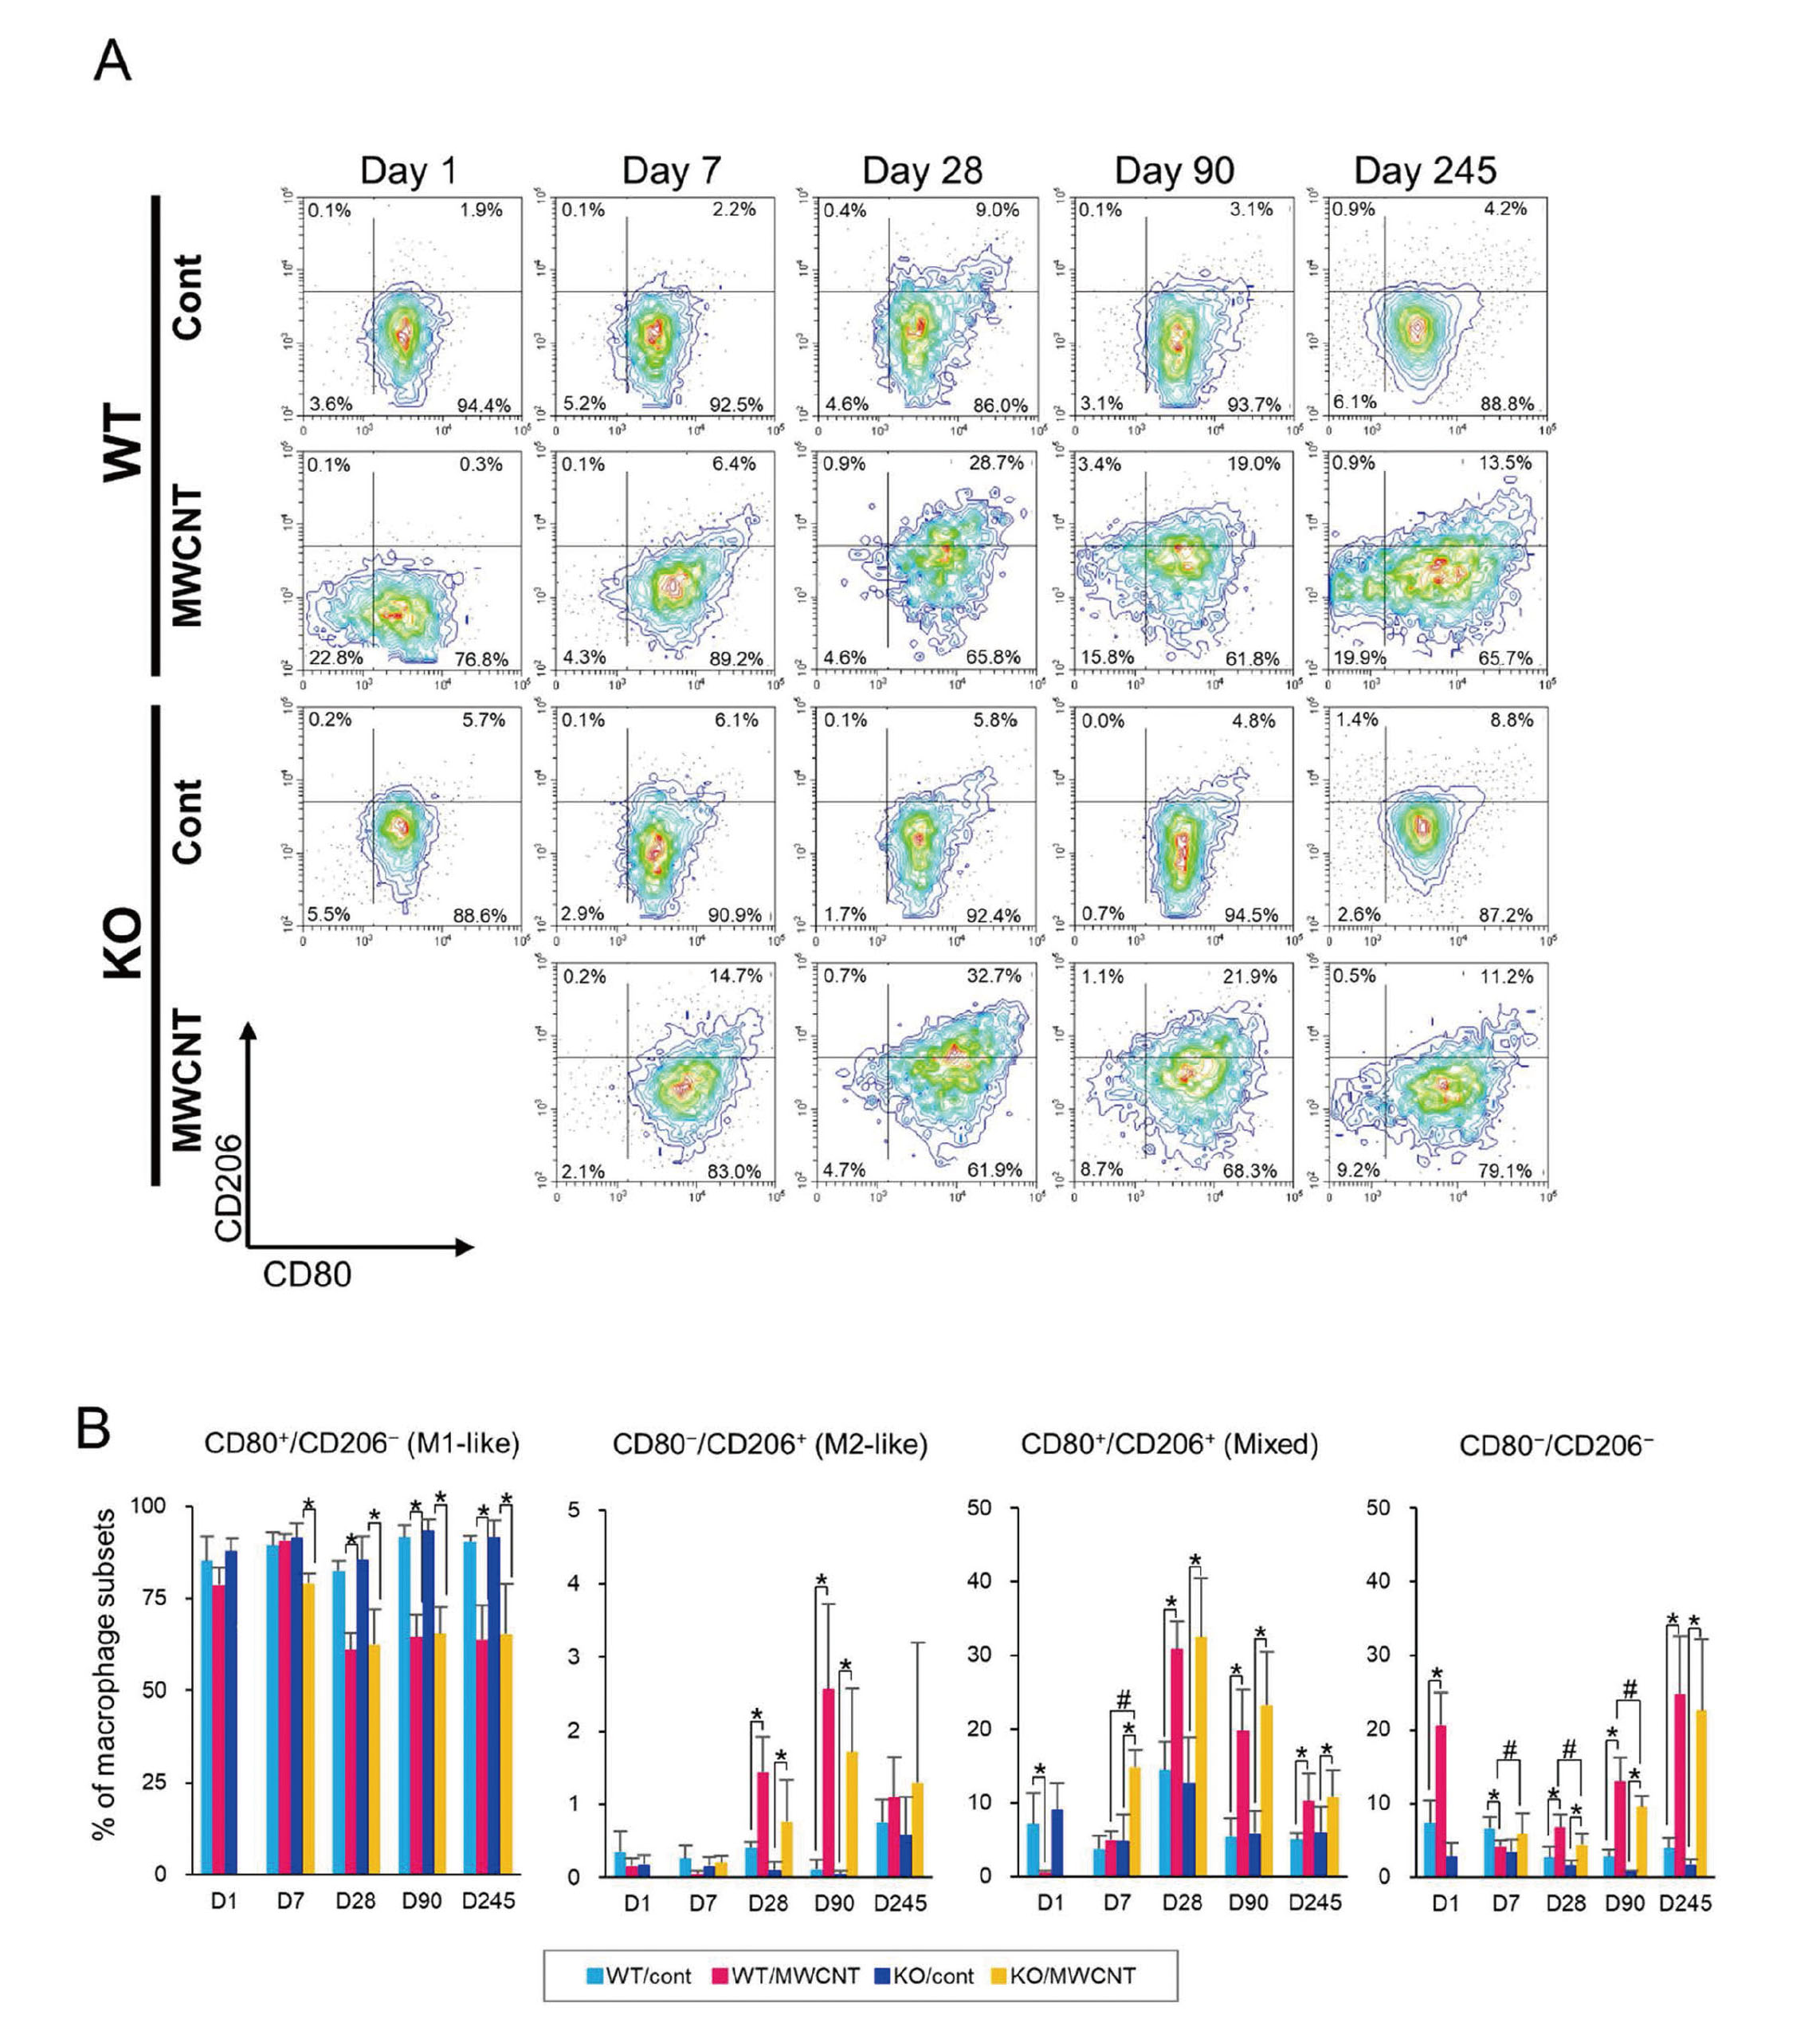
Finally, the peritoneal macrophages were characterized by another general classification (Fig. S3B), M1 or M2. Both the SPMs and LPMs were concomitantly gated and evaluated using CD80 and CD206 antibodies for M1 and M2 macrophage markers, respectively (Sica and Mantovani, 2012; Orecchioni et al., 2019) (Fig. 7A). The macrophages in vehicle controls were mainly exhibited CD80+CD206− (M1-like) cells in both WT and KO mice. In the MWCNT-treated group of WT mice, the intensity of CD80 signal gradually increased from day 1 to day 28. At day 90 and day 245, the macrophages elicited by MWCNT showed a wider spectrum of the expression level of CD80, compared with vehicle controls (Fig. 7A). The polarization of macrophages in the MWCNT-treated KO mice was apparently M1-like, which was similar to WT mice, although their population size was observed to be quite low at day 1 (Fig. 3A). In both the WT and KO mice, the expression of CD206 could be detected from day 28, but the CD80−CD206+ (M2-like) population was hardly observed (Figs. 7A and 7B), rather, a double positive population of CD80+CD206+ cells (both M1- and M2-like), was the major source of the CD206 signal (Fig. 7B).
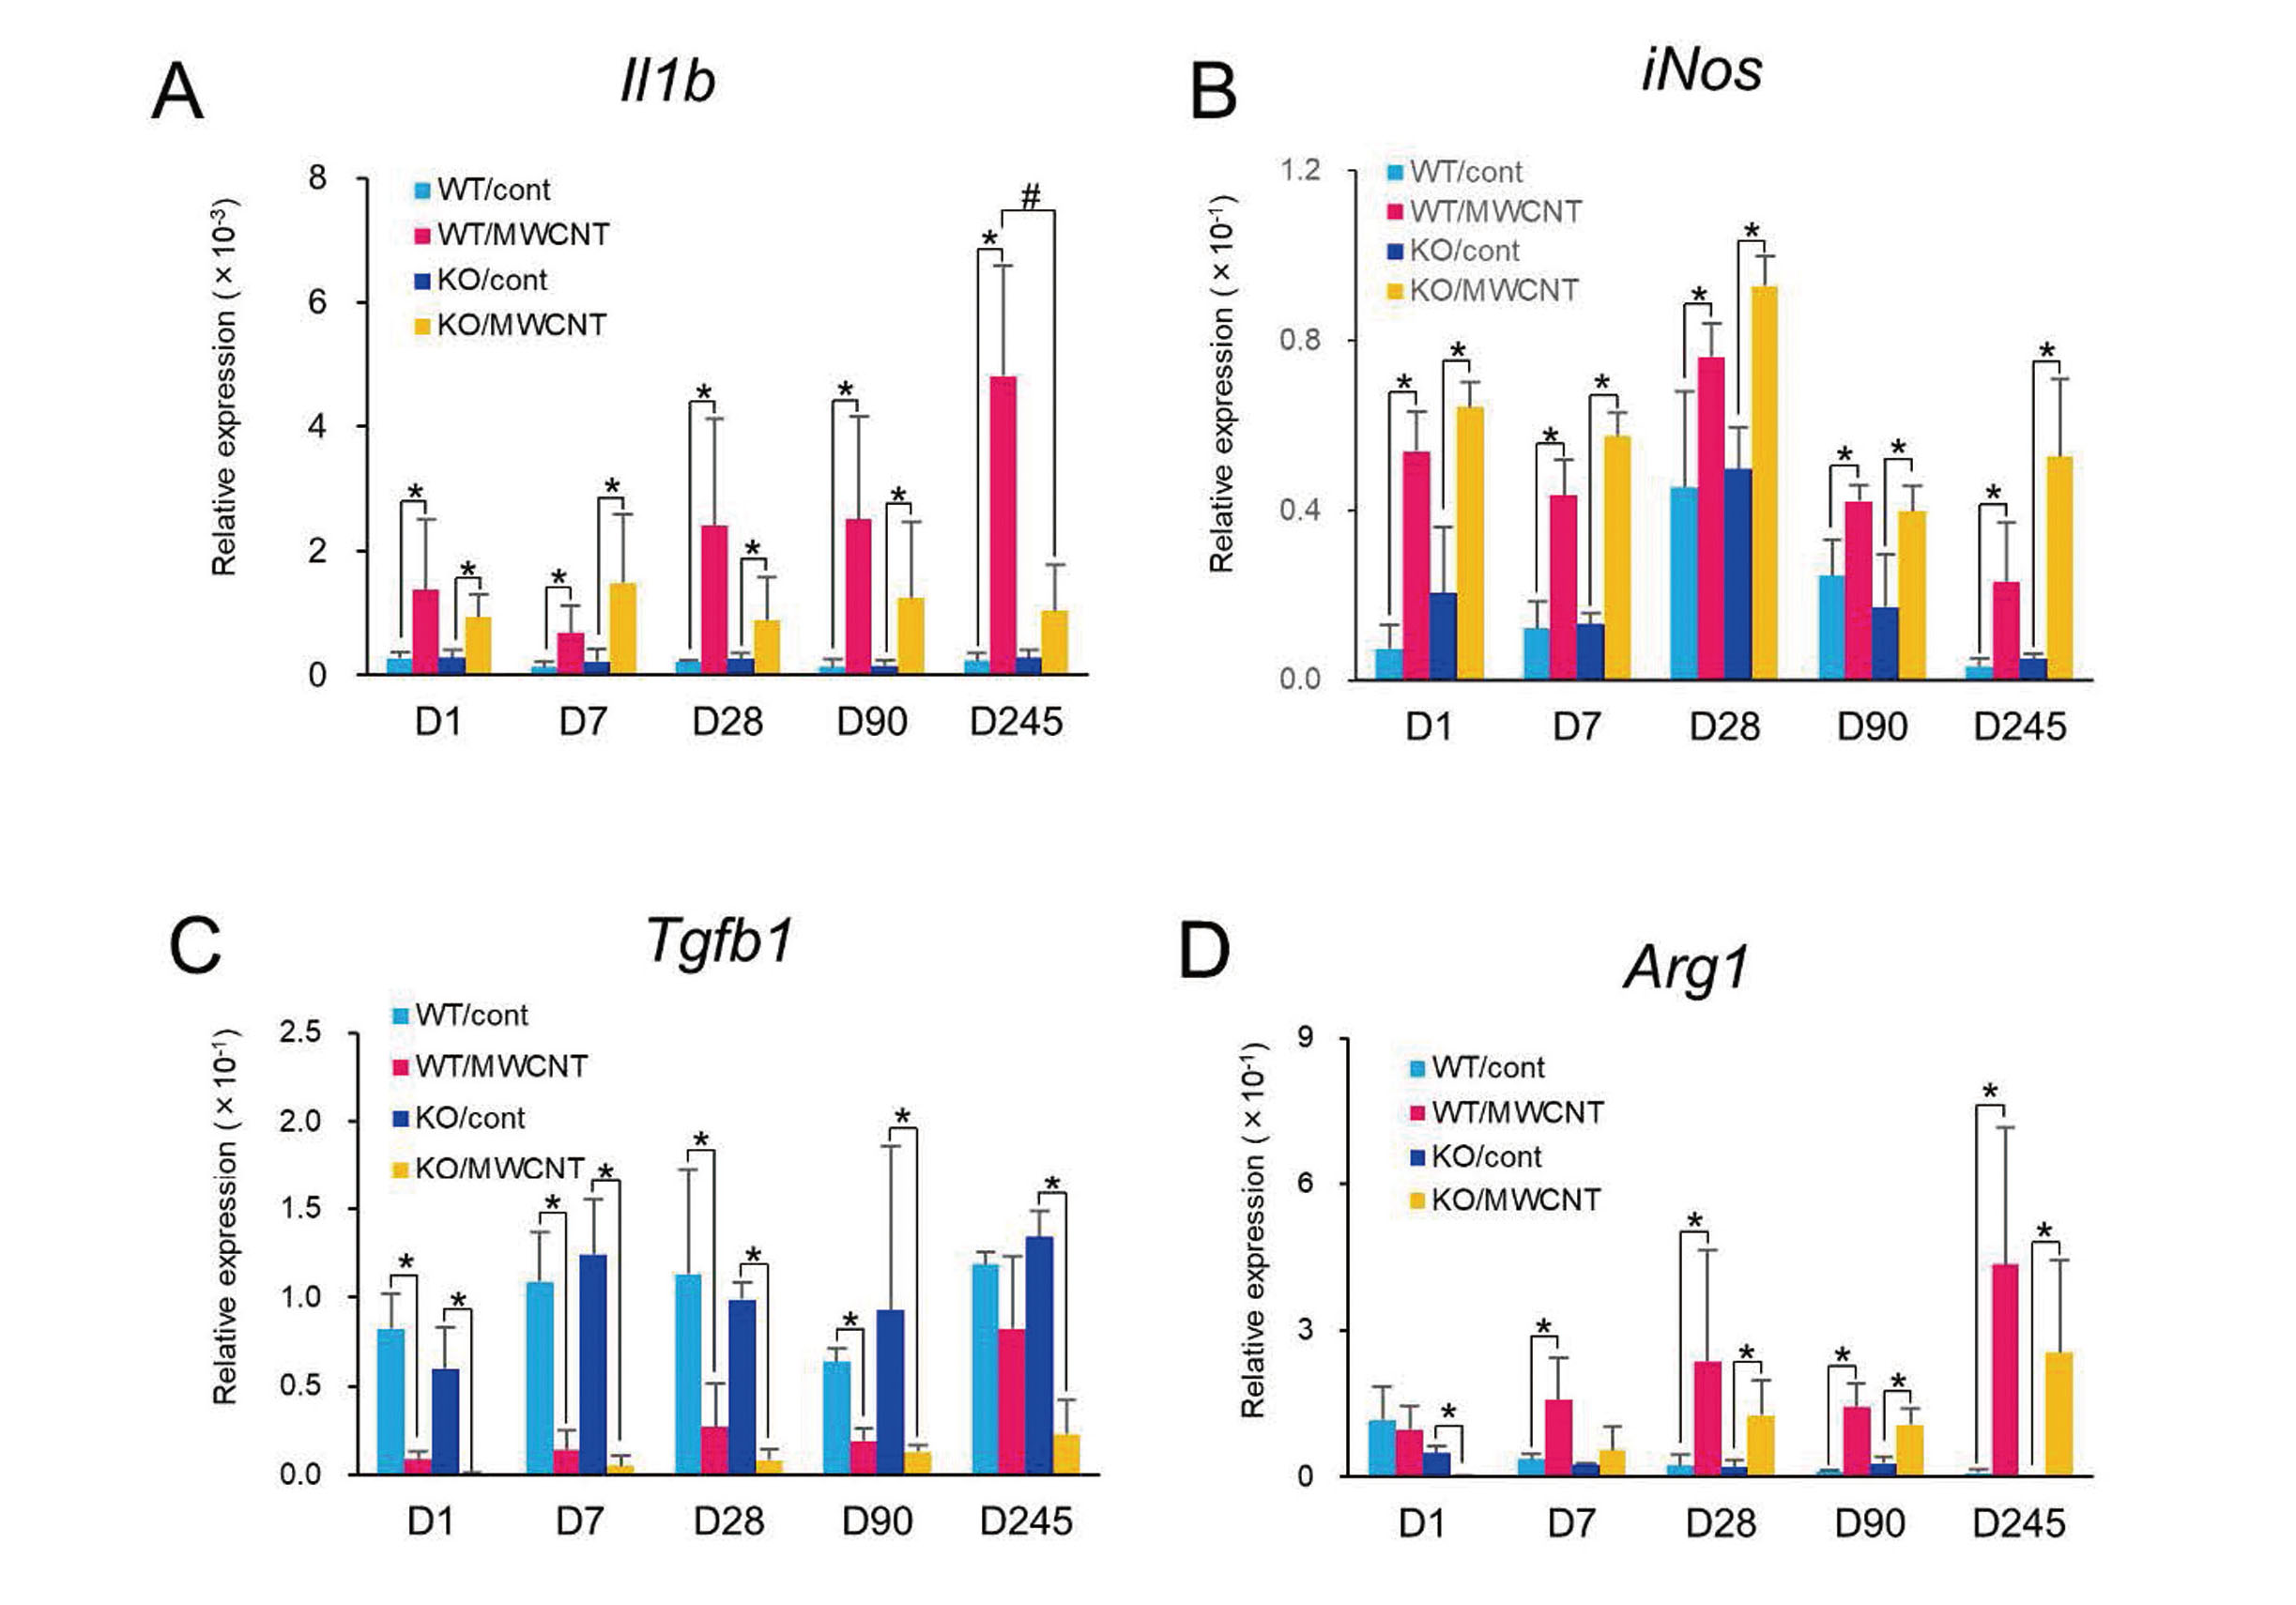
mRNA expression levels of M1 and M2 macrophage-related genes in the PECs were analyzed by qRT-PCR (Fig. 8). Expression levels of Il1b (interleukin 1β) and iNos (nitric oxide synthase) were examined as M1-associated genes (Figs. 8A and 8B). Levels of both genes were observed to be significantly upregulated in the MWCNT-treated groups in WT and KO mice from day 1 to day 245. The level of Il1b increased gradually, and the level was higher in the WT mice than that in the KO mice at day 245 (Fig. 8A). Meanwhile, expression levels of Tgfb1 and Arg1 (arginase 1) were evaluated as M2-associated genes (Figs. 8C and 8D). The levels of Tgfb1 in the MWCNT-treated groups were unexpectedly lower than the vehicle controls throughout the experimental period (Fig. 8C). Given that TGF-β1 protein was elevated in the MWCNT-treated groups (Fig. 4C), the protein may have mainly originated from mesothelial or sub-mesothelial cells instead of PECs (leukocytes). The level of Arg1 was found to have gradually increased in WT and KO mice from day 7 to day 245, with higher levels in the WT mice (Fig. 8D). These results are largely consistent with the flow cytometric analysis; the status of peritoneal macrophage appeared to be M1 like at day 1 after the injection, but gradually shifted to an M1/M2 mixed status at the later time points. Discordances in the results of M1/M2 polarization between qRT-PCR and flow cytometry such as elevation of the expressions of Il1b and iNos in the later time points were probably due to a difference of the sample preparation in both analyses. In the qRT-PCR analysis, effects of other immune cells were inevitable because RNA were extracted not from macrophages but from whole PECs.
DISCUSSION
Using Ccr2-KO mice, we have evaluated the role of Ccr2 in the wide spectrum of MWCNT-induced toxicities, from acute inflammation and fibrosis to mesothelioma. First and foremost, we observed a clear difference in the acute inflammatory responses between WT and KO mice. Almost all the SPMs and LPMs disappeared one day after MWCNT administration in KO mice, suggesting a critical role of Ccr2 in the quick recruitment of macrophages into the peritoneal cavity after an MDR. Histologically, a large number of active macrophages engulfing MWCNTs and granulomatous aggregations were observed in the WT mice at day 1, while fractured macrophages or cell debris and an abundance of neutrophils were frequently found in the KO mice. In the KO mice, despite a significant delayed and decreased supply of macrophages, the deficiency of CCR2 signaling was most likely to be compensated by other recruitment routes until day 7. In spite of this, KO mice exhibited a lower efficiency in replenishment of macrophages (approximately 50% of that in WT) throughout the experimental period. Intriguingly, the level of CCL2 in the PLF was constantly higher in the KO group than WT group, especially at day 1. This is probably because MWCNT fibers have escaped from phagocytosis by macrophages and massively infiltrated neutrophils caused more tissue damage, and thus, leukocytes, mesothelial cells, and submesothelial cells produced further amount of the CCL2 to remove these remaining foreign materials and biological debris. Similarly, CCL2 protein levels of lungs strikingly increased in Ccr2-KO mice compared to WT mice in a pulmonary fibrosis model (Moore et al., 2001) and in a lung contusion model (Suresh et al., 2012). In addition, the significantly higher number of neutrophils and higher level of CXCL1 in the PLF of KO mice in this study resembles to results of previous studies for evaluating inflammatory responses to various stimuli in Ccr2-KO mice (Boring et al., 1997; Suresh et al., 2012; Wareing et al., 2007). Macrophages are known to phagocyte dying neutrophils in the inflammatory site and even induce apoptosis of the neutrophils (Silva, 2011; Amano et al., 2004; Meszaros et al., 2000), which supports the results of the increase of neutrophils as the effect of CCR2 deficiency.
Secondly, as for chronic outcomes of the deficiency of Ccr2 gene, we found a significantly lesser progression of the peritoneal fibrosis in KO mice. Attenuations of fibrosis in Ccr2-KO mice have been reported in rodent pulmonary fibrosis models induced by bleomycin or by inflammatory stimuli using particulate or fibrous materials (Moore et al., 2001; Shichino et al., 2015; Lebrun et al., 2017). A study by Kushiyama et al. demonstrated that a blockade of macrophage infiltration by clodronate administration clearly ameliorated the chlorhexidine gluconate-induced peritoneal fibrosis in rats (Kushiyama et al., 2011). In these studies, the fibrogenic role of macrophages is thought to have been exerted mainly by alternatively activated macrophages (AAM or M2) producing TGF-β1, which mediates induction of mesothelial mesenchymal transition, and the proliferation and activation of submesothelial fibroblasts (Terri et al., 2021). In the present study, there were no significant differences in the levels of TGF-β1 in the PLF, and other M2-related markers in the macrophages or PECs between WT and KO. However, the histological finding of a slight enhancement of leukocyte infiltration in the fibrotic tissues in KO mice, suggested that the CCR2-positive macrophages may have an immunosuppressive function. The phenotype of immature and loose fibrotic response appears to be similar to that of a silica-induced lung fibrosis in Ccr2-KO mice (Shichino et al., 2015). In association with fibrotic lesions, huge granulomas with FBGC were frequently found after the end of day 7. In previous studies, FBGCs were detected in animals exposed to MWCNTs (Poland et al., 2008; Aiso et al., 2010; Sakamoto et al., 2009). Since FBGC formations are generally associated with nondegradable foreign substances such as implants, surgical sutures, and implanted biomedical device (Witherel et al., 2019), the biological implications of FBGC emerging in MWCNT-exposed lesions is likely isolation of the highly durable materials from the host, and thus suppression of the excessive inflammation by the production of TGF-β (Ahmadzadeh et al., 2022). Some in vivo and in vitro studies showed that the CCL2-CCR2 axis is involved in the formation of FBGCs (Kyriakides et al., 2004; Miyamoto et al., 2009). In the present study, histological and cytological analyses showed the marked decline in the population of macrophages at day 1, which was probably related to a slight delay in the peak of FBGCs formation in the KO mice.
Thirdly, we have evaluated the contribution of Ccr2 to the initiation of mesotheliomagenesis during the 245 days observation period, based on the results of our unpublished 2-year study, in which mesothelioma-related deaths started around 200 days after a single i.p. injection of MWNT-7 in WT C57BL/6 mice. As expected, in this study, some mice from the MWCNT-treated groups had developed AMHs or mesotheliomas until the terminal necropsy. This is the first report to demonstrate the induction of peritoneal mesotheliomas in WT C57BL/6 mice by MWCNT. There was no histological and biochemical evidence indicating that CCR2 protein produces a favorable condition for mesothelioma development in the peritoneum. The Ccr2 gene (and CCR2-dependent macrophages) did not largely affect the growth of mesothelial cells at least until day 245. However, it is still possible that the constantly lower infiltration of CCR2 positive macrophages would affect the tumor incidence, severity or malignancy of the mesothelioma due to their potential immunosuppressive functions if we extend the observation period (e.g., 2 years).
Consistent with previous reports (Ghosn et al., 2010; Orsi et al., 2021), the peritoneal macrophages were composed of a major population of LPMs and a small amount of SPMs in the peritoneal cavity in the negative control groups, but the SPMs became a major population after the MDR by administration of MWCNT. Orsi et al. demonstrated that an MDR induced by MWCNT in rats was not associated with the migration of macrophages from the peritoneum to the omentum, but rather was a result of the cell deaths caused by cytotoxicity of the MWCNT (Orsi et al., 2021). The authors revealed that the type of macrophages replenished after the MDR depends on the type of MWCNTs. When the carcinogenic rigid, long fiber (MWNT-7) was exposed, the macrophage population was replenished by SPMs which express a high concentration of MHCII molecules. In contrast, when a non-carcinogenic thin, tangled fiber was exposed, the replenishment was done by LPMs, which expressed lower levels of MHCII. The authors predicted that SPMs with a high output of MHCII emerging after the MDR, might have a critical role in the development of peritoneal mesothelioma. The present study demonstrated that the ontogeny of macrophages after the MWCNT exposure in rats could be applied in mice, and that the macrophage replenishment by MHCIIhigh SPMs continued for a long time, at least eight months after the single exposure, importantly at the beginning of mesothelioma development.
Furthermore, the present study also indicated one more important fact: The macrophage replenishment by SPMs, expressing high level of MHCII after the MDR, is achieved by both CCR2-dependent and CCR2-independent routes (Fig. 9A). During early response following the exposure of MWCNT, the SPMs are recruited as Ly-6C+MHCII− cells exclusively by CCR2-dependent route, and thereafter they mature and transition into Ly-6C−MHCII+ cells. This macrophage differentiation pattern resembles that of in situ maturation process of recruited macrophages in a colitis model (Tamoutounour et al., 2012), a sterile wound model (Crane et al., 2014), and a skeletal muscle injury model (Arnold et al., 2007) in mice. Besides the CCR2-dependent differentiation, the CCR2-independent route was put into action following seven days in WT mice (Ly-6C−MHCII− cells), and this resulted in generation of about half of total SPMs in the later time points. Through this CCR2-independent route, macrophages mobilized to the peritoneal cavity and gradually altered their molecular signature from Ly-6C−MHCII− to Ly-6C−MHCII+. One limitation of the present study is that molecular basis of this additional route recruiting Ly-6C−MHCII− cells was not identified. We are of the opinion that CX3CL1-CX3CR1 axis is one of the candidates for the additional route. In several murine models, it has been reported that phenotypes of macrophages in injured tissues changed from Ly-6C+ CCR2high CX3CR1low (at early phase; about 1 day after the stimuli) to Ly-6C− CCR2low CX3CR1high (at late phase; 3–7 days after the stimuli), suggesting an alteration of the recruiting axis, from CCL2-CCR2 to CX3CL1-CX3CR1 (Dal-Secco et al., 2015; Yang et al., 2019; Ramachandran et al., 2012; Nahrendorf et al., 2007). This switching of the macrophage populations is similar to the occurrences in our time-course analysis. In an atherosclerosis model, a drastic reduction of the macrophage accumulation in the lesions and amelioration of the disease were observed in Cxc3l1−/−Ccr2−/− mice compared with Ccr2−/− mice, suggesting a great contribution of the CX3CL1-CX3CR1 axis in chronic inflammation-related disease (Saederup et al., 2008). Unfortunately, we did not analyze the CX3CR1 cells by flow cytometry and did not detect any signals of CX3CL1 in the ELISA (data not shown), probably because the quantity of available PLF samples was too low. But the transcriptional levels of Cx3cr1 were constantly upregulated in MWCNT-treated groups and were higher in KO mice compared to WT mice.

The other limitation of the present study is the use of male mice only. We chose male mice in the i.p. injection model based on previous studies reporting of inductions of peritoneal mesotheliomas by fibrous materials (Suzuki and Kohyama, 1984; Marsella et al., 1997; Takagi et al., 2008). We cannot exclude a possibility that implications of our findings are gender dependent because Bain et al. indicated striking differences between the gender; e.g., occurrence of replenishment of homeostatic peritoneal macrophages by CCR2-dependent route throughout the life time of mice (Bain et al., 2016); comprehensive gene expression pattern of macrophages; and protection against pneumococcal peritonitis (Bain et al., 2020).
Although both the present study and study by Orsi et al. suggests that the Ly-6ClowMHCIIhigh SPMs might be involved in the pathology of the mesothelioma induced by MWCNT, its actual role is still not quite clear (Fig. 9B). Regarding a difference of SPM or LPM, generally, SPMs show a higher phagocytotic capacity against particles or bacteria than LPMs (Ghosn et al., 2010), and perhaps produce higher levels of proinflammatory mediators and ROS in injured tissues. The ROS generation is thought to be a particularly important step in the generation of genomic insults during particle/fiber-induced carcinogenesis, suggesting that SPMs are related to the initiation of mesotheliomagenesis (Fig. 9B (i)). But, we did not find any differences between the KO and WT mice at the initiation of mesothelioma development. Analyses of the relationship between phenotypes and functions of macrophages during the wound healing suggested that Ly-6Chigh macrophages have proinflammatory roles (produce of TNF-α; M1-like), while Ly-6Clow macrophages contribute to anti-inflammatory responses and wound healings (produce of VEGF and TGF-β; M2-like) (Nahrendorf et al., 2007; Crane et al., 2014) (Fig. 9B (ii)). These studies support our finding of a significant attenuation of the fibrosis in Ccr2-KO mice. Thus, we speculate that the Ly-6ClowMHCIIhigh SPM may be more involved in the progression of mesothelioma. Besides being involved in innate immune responses, SPMs may possibly be involved in adaptive immune responses due to their antigen-presenting potentials. For instance, methylated BSA-mediated peritonitis elicited macrophages with higher expressions of MHCII and these macrophages were responsible for stimulating T-cell proliferation (Cook et al., 2003). Conversely, some reports have also discussed immunosuppressive roles of macrophages with high MHCII expression. AAMs express high level of MHCII and PD-L2 have suppressed the proliferation of Th2 cells in a murine lung infection model (Huber et al., 2010). It is also possible that the SPMs may function like TAMs (Fig. 9B (iii)). In a mammary tumor model, inflammatory CCR2+Ly-6C+ monocytes underwent sequential phenotypical changes characterized by the downregulation of Ly-6C and the upregulation of MHCII molecules, and finally Ly-6ClowMHCIIhigh cells functioned as TAMs (Franklin et al., 2014). Crucially, features of recruited macrophages after the replenishment are not predetermined by origin or recruitment routes, rather, they are intricately regulated by the environment such as niche-specific factors or presence of resident macrophages (Louwe et al., 2021). Additional experiments using other immunological approaches such as bone marrow chimeric mice are needed to fully elucidate the phenotypes and roles of MHCIIhigh SPMs in mesothelioma development.
Ghosn et al. reported that the M1/M2 framework cannot be readily applied in the SPM/LPM subsets in the peritoneal cavity (Ghosn et al., 2010). According to a definition of M1 macrophage, and considering the nitric oxide production by the Toll-like receptor signaling, both the SPM and LPM can be classified as M1 macrophages. Indeed, our study demonstrated that a large percentage of macrophages infiltrated by MWCNT exposure exhibited the M1-like phenotype, but in chronic phase, the macrophages altered their features to resemble both M1- and M2-like phenotypes. The M1/M2 mixed phenotype of macrophages in this study coincides with a number of immunotoxicological studies for MWCNTs: a flow cytometric analysis of alveolar macrophages in bronchiolar alveolar lavage fluids collected from C57BL/6 mice one year after a repeated inhalation exposure of Taquann-treated MWNT-7 (Otsuka et al., 2018); a flow cytometric analysis of RAW cells exposed with an oxidized MWCNT (Meng et al., 2015); and a comprehensive mRNA analysis of SPMs collected from the rat peritoneal cavity after a carcinogenic dosing of MWNT-7 (Orsi et al., 2021). The emergence of macrophages with the M1/M2 mixed phenotype is, however, not specific to MWCNT toxicities, rather, it is perhaps a common outcome of chronic inflammation or tumorigenesis. For example, the M1/M2 mixed status was shown in multiple sclerosis (Vogel et al., 2013) and cutaneous squamous cell carcinoma (Pettersen et al., 2011) by immunohistochemical analyses. Since various microenvironmental stimuli can alter macrophage phenotypes like the Ly-6C-signature above discussed, an expression of the intermediate (mixed) phenotype is plausible, especially in in vivo experiments. Recent intensive immunological studies have uncovered the incredible plasticity of macrophages, and proposed some detailed classifications beyond the classical M1-M2 polarization framework, e.g., M1/M2b/M2c/M2d; M(Hb)/Mox/M4; and tissue-resident M2-like macrophages etc. (Jinnouchi et al., 2020; Rőszer, 2015; Satoh et al., 2013). Given that M1/M2 polarization is highly complex and context-dependent, our insufficient evaluation approach may be a drawback, i.e., flow cytometry using only one pair of markers (CD80/CD206) and gene expression analysis in total cells instead of sorted cells from PLFs. We could not histologically evaluate phenotypes of tissue-infiltrated macrophages in the fibrosis and mesothelioma development due to time and resource constraints. The characterization of peritoneal macrophages; M1 vs. M2, CCR2+ vs. CX3CR1+, or Ly-6Chigh vs. Ly-6Clow; should be further explored in the histological context, similar to previous studies evaluating the polarization of alveolar macrophages during fibrosis induced by a crystalline silica (Shichino et al., 2015) or an MWCNT (Dong and Ma, 2018) exposure. Additional experiments are necessary to delineate the phenotypic and profibrogenic (and possibly pro-tumorigenic) activities of macrophages that have chronically accumulated in the peritoneum after the MWCNT exposure.
Rodent i.p. injection models have been applied to hazard identification of fibrous materials due to a facile and reproducible method of producing mesothelioma (Stanton et al., 1977; Adachi et al., 2001; Sakamoto et al., 2018). Literatures have suggested that peritoneal mesothelioma have a certain level of similarity with pleural mesothelioma in histological features, genomic profiling, and mechanism of the tumorigenesis (Nagai et al., 2011; Hiltbrunner et al., 2022; Chernova et al., 2017). Thus, the implication from i.p. injection experiments including the present study will be useful to understand the mechanism of development of human MPM and to prevent of CNT health hazard.
In summary, while a CCR2-dependent macrophage influx occurred immediately after the MDR, an additional CCR2-independent recruitment began to be active after 1 to 7 days. Both routes contributed to the recruitment and replenishment of macrophages during chronic pathological events. The deficiency of the Ccr2 gene resulted in a less efficient repopulation of macrophages in the peritoneal cavity for an extended period of time, which led to the attenuation of peritoneal fibrosis induced by the MWCNT. Meanwhile, the timing of the neoplastic change was unaltered in the Ccr2-KO mice at least in the 245 days observation period. The repopulated macrophages exhibited a molecular signature of Ly-6C−MHCII+ and M1/M2 mixed features and probably have roles in chronic toxicities.
ACKNOWLEDGEMENTS
We would like to thank Mxs. Katsuhiro Yuzawa, Yuko Hasegawa, Aya Saiga, Akemichi Nagasawa, Kazuyoshi Tanaka, and Hiroshi Ando (Tokyo Metropolitan Institute of Public Health), Dr. Kyoko Hiramatsu (former Tokyo Metropolitan Institute of Public Health), and the late Mxs. Yoshikazu Kubo and Norio Yano for their superb technical supports. The present study was supported by Health and Labour Sciences Research Grants (H30-kagaku-shitei-004 and 21KD2004) from the Ministry of Health, Labour and Welfare of Japan.
Conflict of interest
The authors declare that the research was conducted in the absence of any commercial or financial relationships that could be construed as a potential conflict of interest.
REFERENCES
- Adachi, S., Kawamura, K. and Takemoto, K. (2001): A trial on the quantitative risk assessment of man-made mineral fibers by the rat intraperitoneal administration assay using the JFM standard fibrous samples. Ind. Health, 39, 168-174.
- Ahmadzadeh, K., Vanoppen, M., Rose, C.D., Matthys, P. and Wouters, C.H. (2022): Multinucleated Giant Cells: Current Insights in Phenotype, Biological Activities, and Mechanism of Formation. Front. Cell Dev. Biol., 10, 873226.
- Aiso, S., Yamazaki, K., Umeda, Y., Asakura, M., Kasai, T., Takaya, M., Toya, T., Koda, S., Nagano, K., Arito, H. and Fukushima, S. (2010): Pulmonary toxicity of intratracheally instilled multiwall carbon nanotubes in male Fischer 344 rats. Ind. Health, 48, 783-795.
- Amano, H., Morimoto, K., Senba, M., Wang, H., Ishida, Y., Kumatori, A., Yoshimine, H., Oishi, K., Mukaida, N. and Nagatake, T. (2004): Essential contribution of monocyte chemoattractant protein-1/C-C chemokine ligand-2 to resolution and repair processes in acute bacterial pneumonia. J. Immunol., 172, 398-409.
- Arnold, L., Henry, A., Poron, F., Baba-Amer, Y., van Rooijen, N., Plonquet, A., Gherardi, R.K. and Chazaud, B. (2007): Inflammatory monocytes recruited after skeletal muscle injury switch into antiinflammatory macrophages to support myogenesis. J. Exp. Med., 204, 1057-1069.
- Bain, C.C., Gibson, D.A., Steers, N.J., Boufea, K., Louwe, P.A., Doherty, C., González-Huici, V., Gentek, R., Magalhaes-Pinto, M., Shaw, T., Bajénoff, M., Bénézech, C., Walmsley, S.R., Dockrell, D.H., Saunders, P.T., Batada, N.N. and Jenkins, S.J. (2020): Rate of replenishment and microenvironment contribute to the sexually dimorphic phenotype and function of peritoneal macrophages. Sci. Immunol., 5, eabc4466.
- Bain, C.C., Hawley, C.A., Garner, H., Scott, C.L., Schridde, A., Steers, N.J., Mack, M., Joshi, A., Guilliams, M., Mowat, A.M., Geissmann, F. and Jenkins, S.J. (2016): Long-lived self-renewing bone marrow-derived macrophages displace embryo-derived cells to inhabit adult serous cavities. Nat. Commun., 7, ncomms11852.
- Barbarin, V., Nihoul, A., Misson, P., Arras, M., Delos, M., Leclercq, I., Lison, D. and Huaux, F. (2005): The role of pro- and anti-inflammatory responses in silica-induced lung fibrosis. Respir. Res., 6, 112.
- Boring, L., Gosling, J., Chensue, S.W., Kunkel, S.L., Farese, R.V. Jr., Broxmeyer, H.E. and Charo, I.F. (1997): Impaired monocyte migration and reduced type 1 (Th1) cytokine responses in C-C chemokine receptor 2 knockout mice. J. Clin. Invest., 100, 2552-2561.
- Cassado, A.A., D’Império Lima, M.R. and Bortoluci, K.R. (2015): Revisiting mouse peritoneal macrophages: heterogeneity, development, and function. Front. Immunol., 6, 225.
- Chéné, A.L., d’Almeida, S., Blondy, T., Tabiasco, J., Deshayes, S., Fonteneau, J.F., Cellerin, L., Delneste, Y., Grégoire, M. and Blanquart, C. (2016): Pleural Effusions from Patients with Mesothelioma Induce Recruitment of Monocytes and Their Differentiation into M2 Macrophages. J. Thorac. Oncol., 11, 1765-1773.
- Chernova, T., Murphy, F.A., Galavotti, S., Sun, X.M., Powley, I.R., Grosso, S., Schinwald, A., Zacarias-Cabeza, J., Dudek, K.M., Dinsdale, D., Le Quesne, J., Bennett, J., Nakas, A., Greaves, P., Poland, C.A., Donaldson, K., Bushell, M., Willis, A.E. and MacFarlane, M. (2017): Long-Fiber Carbon Nanotubes Replicate Asbestos-Induced Mesothelioma with Disruption of the Tumor Suppressor Gene Cdkn2a (Ink4a/Arf). Curr. Biol., 27, 3302-3314.e6.
- Cook, A.D., Braine, E.L. and Hamilton, J.A. (2003): The phenotype of inflammatory macrophages is stimulus dependent: implications for the nature of the inflammatory response. J. Immunol., 171, 4816-4823.
- Crane, M.J., Daley, J.M., van Houtte, O., Brancato, S.K., Henry, W.L. Jr. and Albina, J.E. (2014): The monocyte to macrophage transition in the murine sterile wound. PLoS One, 9, e86660.
- Dal-Secco, D., Wang, J., Zeng, Z., Kolaczkowska, E., Wong, C.H., Petri, B., Ransohoff, R.M., Charo, I.F., Jenne, C.N. and Kubes, P. (2015): A dynamic spectrum of monocytes arising from the in situ reprogramming of CCR2+ monocytes at a site of sterile injury. J. Exp. Med., 212, 447-456.
- Donaldson, K., Murphy, F.A., Duffin, R. and Poland, C.A. (2010): Asbestos, carbon nanotubes and the pleural mesothelium: a review of the hypothesis regarding the role of long fibre retention in the parietal pleura, inflammation and mesothelioma. Part. Fibre Toxicol., 7, 5.
- Dong, J. and Ma, Q. (2018): Macrophage polarization and activation at the interface of multi-walled carbon nanotube-induced pulmonary inflammation and fibrosis. Nanotoxicology, 12, 153-168.
- Franklin, R.A., Liao, W., Sarkar, A., Kim, M.V., Bivona, M.R., Liu, K., Pamer, E.G. and Li, M.O. (2014): The cellular and molecular origin of tumor-associated macrophages. Science, 344, 921-925.
- Geissmann, F., Jung, S. and Littman, D.R. (2003): Blood monocytes consist of two principal subsets with distinct migratory properties. Immunity, 19, 71-82.
- Ghosn, E.E., Cassado, A.A., Govoni, G.R., Fukuhara, T., Yang, Y., Monack, D.M., Bortoluci, K.R., Almeida, S.R., Herzenberg, L.A. and Herzenberg, L.A. (2010): Two physically, functionally, and developmentally distinct peritoneal macrophage subsets. Proc. Natl. Acad. Sci. USA, 107, 2568-2573.
- Grossman, J.G., Nywening, T.M., Belt, B.A., Panni, R.Z., Krasnick, B.A., DeNardo, D.G., Hawkins, W.G., Goedegebuure, S.P., Linehan, D.C. and Fields, R.C. (2018): Recruitment of CCR2+ tumor associated macrophage to sites of liver metastasis confers a poor prognosis in human colorectal cancer. OncoImmunology, 7, e1470729.
- Hamilton, R.F. Jr., Wu, Z., Mitra, S., Shaw, P.K. and Holian, A. (2013): Effect of MWCNT size, carboxylation, and purification on in vitro and in vivo toxicity, inflammation and lung pathology. Part. Fibre Toxicol., 10, 57.
- Hiltbrunner, S., Fleischmann, Z., Sokol, E.S., Zoche, M., Felley-Bosco, E. and Curioni-Fontecedro, A. (2022): Genomic landscape of pleural and peritoneal mesothelioma tumours. Br. J. Cancer, 127, 1997-2005.
- Hiraku, Y., Guo, F., Ma, N., Yamada, T., Wang, S., Kawanishi, S. and Murata, M. (2016): Multi-walled carbon nanotube induces nitrative DNA damage in human lung epithelial cells via HMGB1-RAGE interaction and Toll-like receptor 9 activation. Part. Fibre Toxicol., 13, 16.
- Hojo, M., Maeno, A., Sakamoto, Y., Ohnuki, A., Tada, Y., Yamamoto, Y., Ikushima, K., Inaba, R., Suzuki, J., Taquahashi, Y., Yokota, S., Kobayashi, N., Ohnishi, M., Goto, Y., Numano, T., Tsuda, H., Alexander, D.B., Kanno, J., Hirose, A., Inomata, A. and Nakae, D. (2022): Two-year intermittent exposure of a multiwalled carbon nanotube by intratracheal instillation induces lung tumors and pleural mesotheliomas in F344 rats. Part. Fibre Toxicol., 19, 38.
- Hojo, M., Yamamoto, Y., Sakamoto, Y., Maeno, A., Ohnuki, A., Suzuki, J., Inomata, A., Moriyasu, T., Taquahashi, Y., Kanno, J., Hirose, A. and Nakae, D. (2021): Histological sequence of the development of rat mesothelioma by MWCNT, with the involvement of apolipoproteins. Cancer Sci., 112, 2185-2198.
- Huaux, F. (2018): Emerging Role of Immunosuppression in Diseases Induced by Micro- and Nano-Particles: Time to Revisit the Exclusive Inflammatory Scenario. Front. Immunol., 9, 2364.
- Huaux, F., d’Ursel de Bousies, V., Parent, M.A., Orsi, M., Uwambayinema, F., Devosse, R., Ibouraadaten, S., Yakoub, Y., Panin, N., Palmai-Pallag, M., van der Bruggen, P., Bailly, C., Marega, R., Marbaix, E. and Lison, D. (2016): Mesothelioma response to carbon nanotubes is associated with an early and selective accumulation of immunosuppressive monocytic cells. Part. Fibre Toxicol., 13, 46.
- Huber, S., Hoffmann, R., Muskens, F. and Voehringer, D. (2010): Alternatively activated macrophages inhibit T-cell proliferation by Stat6-dependent expression of PD-L2. Blood, 116, 3311-3320.
- Jinnouchi, H., Guo, L., Sakamoto, A., Torii, S., Sato, Y., Cornelissen, A., Kuntz, S., Paek, K.H., Fernandez, R., Fuller, D., Gadhoke, N., Surve, D., Romero, M., Kolodgie, F.D., Virmani, R. and Finn, A.V. (2020): Diversity of macrophage phenotypes and responses in atherosclerosis. Cell. Mol. Life Sci., 77, 1919-1932.
- Kasai, T., Umeda, Y., Ohnishi, M., Mine, T., Kondo, H., Takeuchi, T., Matsumoto, M. and Fukushima, S. (2016): Lung carcinogenicity of inhaled multi-walled carbon nanotube in rats. Part. Fibre Toxicol., 13, 53.
- Kishimoto, T., Fujimoto, N., Ebara, T., Omori, T., Oguri, T., Niimi, A., Yokoyama, T., Kato, M., Usami, I., Nishio, M., Yoshikawa, K., Tokuyama, T., Tamura, M., Yokoyama, Y., Tsuboi, K., Matsuo, Y., Xu, J., Takahashi, S., Abdelgied, M., Alexander, W.T., Alexander, D.B. and Tsuda, H. (2019): Serum levels of the chemokine CCL2 are elevated in malignant pleural mesothelioma patients. BMC Cancer, 19, 1204.
- Kobayashi, N., Naya, M., Ema, M., Endoh, S., Maru, J., Mizuno, K. and Nakanishi, J. (2010): Biological response and morphological assessment of individually dispersed multi-wall carbon nanotubes in the lung after intratracheal instillation in rats. Toxicology, 276, 143-153.
- Kuempel, E.D., Jaurand, M.C., Møller, P., Morimoto, Y., Kobayashi, N., Pinkerton, K.E., Sargent, L.M., Vermeulen, R.C., Fubini, B. and Kane, A.B. (2017): Evaluating the mechanistic evidence and key data gaps in assessing the potential carcinogenicity of carbon nanotubes and nanofibers in humans. Crit. Rev. Toxicol., 47, 1-58.
- Kushiyama, T., Oda, T., Yamada, M., Higashi, K., Yamamoto, K., Oshima, N., Sakurai, Y., Miura, S. and Kumagai, H. (2011): Effects of liposome-encapsulated clodronate on chlorhexidine gluconate-induced peritoneal fibrosis in rats. Nephrol. Dial. Transplant., 26, 3143-3154.
- Kyriakides, T.R., Foster, M.J., Keeney, G.E., Tsai, A., Giachelli, C.M., Clark-Lewis, I., Rollins, B.J. and Bornstein, P. (2004): The CC chemokine ligand, CCL2/MCP1, participates in macrophage fusion and foreign body giant cell formation. Am. J. Pathol., 165, 2157-2166.
- Lebrun, A., Lo Re, S., Chantry, M., Izquierdo Carerra, X., Uwambayinema, F., Ricci, D., Devosse, R., Ibouraadaten, S., Brombin, L., Palmai-Pallag, M., Yakoub, Y., Pasparakis, M., Lison, D. and Huaux, F. (2017): CCR2+ monocytic myeloid-derived suppressor cells (M-MDSCs) inhibit collagen degradation and promote lung fibrosis by producing transforming growth factor-β1. J. Pathol., 243, 320-330.
- Li, X., Yao, W., Yuan, Y., Chen, P., Li, B., Li, J., Chu, R., Song, H., Xie, D., Jiang, X. and Wang, H. (2017): Targeting of tumour-infiltrating macrophages via CCL2/CCR2 signalling as a therapeutic strategy against hepatocellular carcinoma. Gut, 66, 157-167.
- Louwe, P.A., Badiola Gomez, L., Webster, H., Perona-Wright, G., Bain, C.C., Forbes, S.J. and Jenkins, S.J. (2021): Recruited macrophages that colonize the post-inflammatory peritoneal niche convert into functionally divergent resident cells. Nat. Commun., 12, 1770.
- Marsella, J.M., Liu, B.L., Vaslet, C.A. and Kane, A.B. (1997): Susceptibility of p53-deficient mice to induction of mesothelioma by crocidolite asbestos fibers. Environ. Health Perspect., 105 (Suppl 5), 1069-1072.
- Meng, J., Li, X., Wang, C., Guo, H., Liu, J. and Xu, H. (2015): Carbon nanotubes activate macrophages into a M1/M2 mixed status: recruiting naïve macrophages and supporting angiogenesis. ACS Appl. Mater. Interfaces, 7, 3180-3188.
- Meszaros, A.J., Reichner, J.S. and Albina, J.E. (2000): Macrophage-induced neutrophil apoptosis. J. Immunol., 165, 435-441.
- Mitchell, L.A., Lauer, F.T., Burchiel, S.W. and McDonald, J.D. (2009): Mechanisms for how inhaled multiwalled carbon nanotubes suppress systemic immune function in mice. Nat. Nanotechnol., 4, 451-456.
- Miyamoto, K., Ninomiya, K., Sonoda, K.H., Miyauchi, Y., Hoshi, H., Iwasaki, R., Miyamoto, H., Yoshida, S., Sato, Y., Morioka, H., Chiba, K., Egashira, K., Suda, T., Toyama, Y. and Miyamoto, T. (2009): MCP-1 expressed by osteoclasts stimulates osteoclastogenesis in an autocrine/paracrine manner. Biochem. Biophys. Res. Commun., 383, 373-377.
- Moore, B.B., Paine, R. 3rd, Christensen, P.J., Moore, T.A., Sitterding, S., Ngan, R., Wilke, C.A., Kuziel, W.A. and Toews, G.B. (2001): Protection from pulmonary fibrosis in the absence of CCR2 signaling. J. Immunol., 167, 4368-4377.
- Murciano, C., Yáñez, A., O’Connor, J.E., Gozalbo, D. and Gil, M.L. (2008): Influence of aging on murine neutrophil and macrophage function against Candida albicans. FEMS Immunol. Med. Microbiol., 53, 214-221.
- Murphy, F.A., Schinwald, A., Poland, C.A. and Donaldson, K. (2012): The mechanism of pleural inflammation by long carbon nanotubes: interaction of long fibres with macrophages stimulates them to amplify pro-inflammatory responses in mesothelial cells. Part. Fibre Toxicol., 9, 8.
- Nagai, H., Okazaki, Y., Chew, S.H., Misawa, N., Yamashita, Y., Akatsuka, S., Ishihara, T., Yamashita, K., Yoshikawa, Y., Yasui, H., Jiang, L., Ohara, H., Takahashi, T., Ichihara, G., Kostarelos, K., Miyata, Y., Shinohara, H. and Toyokuni, S. (2011): Diameter and rigidity of multiwalled carbon nanotubes are critical factors in mesothelial injury and carcinogenesis. Proc. Natl. Acad. Sci. USA, 108, E1330-E1338.
- Nahrendorf, M., Swirski, F.K., Aikawa, E., Stangenberg, L., Wurdinger, T., Figueiredo, J.L., Libby, P., Weissleder, R. and Pittet, M.J. (2007): The healing myocardium sequentially mobilizes two monocyte subsets with divergent and complementary functions. J. Exp. Med., 204, 3037-3047.
- Nakanishi, J., Morimoto, Y., Ogura, I., Kobayashi, N., Naya, M., Ema, M., Endoh, S., Shimada, M., Ogami, A., Myojyo, T., Oyabu, T., Gamo, M., Kishimoto, A., Igarashi, T. and Hanai, S. (2015): Risk Assessment of the Carbon Nanotube Group. Risk Anal., 35, 1940-1956.
- Nicholson, A.G., Sauter, J.L., Nowak, A.K., Kindler, H.L., Gill, R.R., Remy-Jardin, M., Armato, S.G. 3rd, Fernandez-Cuesta, L., Bueno, R., Alcala, N., Foll, M., Pass, H., Attanoos, R., Baas, P., Beasley, M.B., Brcic, L., Butnor, K.J., Chirieac, L.R., Churg, A., Courtiol, P., Dacic, S., De Perrot, M., Frauenfelder, T., Gibbs, A., Hirsch, F.R., Hiroshima, K., Husain, A., Klebe, S., Lantuejoul, S., Moreira, A., Opitz, I., Perol, M., Roden, A., Roggli, V., Scherpereel, A., Tirode, F., Tazelaar, H., Travis, W.D., Tsao, M.S., van Schil, P., Vignaud, J.M., Weynand, B., Lang-Lazdunski, L., Cree, I., Rusch, V.W., Girard, N. and Galateau-Salle, F. (2020): EURACAN/IASLC Proposals for Updating the Histologic Classification of Pleural Mesothelioma: Towards a More Multidisciplinary Approach. J. Thorac. Oncol., 15, 29-49.
- Oberdörster, G. and Kuhlbusch, T.A. (2018): In vivo effects: methodologies and biokinetics of inhaled nanomaterials. NanoImpact, 10, 38-60.
- Ordóñez, N.G. (2006): Mesothelioma with rhabdoid features: an ultrastructural and immunohistochemical study of 10 cases. Mod. Pathol., 19, 373-383.
- Orecchioni, M., Ghosheh, Y., Pramod, A.B. and Ley, K. (2019): Macrophage Polarization: different Gene Signatures in M1(LPS+) vs. Classically and M2(LPS-) vs. Alternatively Activated Macrophages. Front. Immunol., 10, 1084.
- Orsi, M., Palmai-Pallag, M., Yakoub, Y., Ibouraadaten, S., De Beukelaer, M., Bouzin, C., Bearzatto, B., Ambroise, J., Gala, J.L., Brusa, D., Lison, D. and Huaux, F. (2021): Monocytic Ontogeny of Regenerated Macrophages Characterizes the Mesotheliomagenic Responses to Carbon Nanotubes. Front. Immunol., 12, 666107.
- Otsuka, K., Yamada, K., Taquahashi, Y., Arakaki, R., Ushio, A., Saito, M., Yamada, A., Tsunematsu, T., Kudo, Y., Kanno, J. and Ishimaru, N. (2018): Long-term polarization of alveolar macrophages to a profibrotic phenotype after inhalation exposure to multi-wall carbon nanotubes. PLoS One, 13, e0205702.
- Palomäki, J., Välimäki, E., Sund, J., Vippola, M., Clausen, P.A., Jensen, K.A., Savolainen, K., Matikainen, S. and Alenius, H. (2011): Long, needle-like carbon nanotubes and asbestos activate the NLRP3 inflammasome through a similar mechanism. ACS Nano, 5, 6861-6870.
- Pettersen, J.S., Fuentes-Duculan, J., Suárez-Fariñas, M., Pierson, K.C., Pitts-Kiefer, A., Fan, L., Belkin, D.A., Wang, C.Q., Bhuvanendran, S., Johnson-Huang, L.M., Bluth, M.J., Krueger, J.G., Lowes, M.A. and Carucci, J.A. (2011): Tumor-associated macrophages in the cutaneous SCC microenvironment are heterogeneously activated. J. Invest. Dermatol., 131, 1322-1330.
- Poland, C.A., Duffin, R., Kinloch, I., Maynard, A., Wallace, W.A., Seaton, A., Stone, V., Brown, S., Macnee, W. and Donaldson, K. (2008): Carbon nanotubes introduced into the abdominal cavity of mice show asbestos-like pathogenicity in a pilot study. Nat. Nanotechnol., 3, 423-428.
- Rabolli, V., Lo Re, S., Uwambayinema, F., Yakoub, Y., Lison, D. and Huaux, F. (2011): Lung fibrosis induced by crystalline silica particles is uncoupled from lung inflammation in NMRI mice. Toxicol. Lett., 203, 127-134.
- Ramachandran, P., Pellicoro, A., Vernon, M.A., et al. (2012): Differential Ly-6C expression identifies the recruited macrophage phenotype, which orchestrates the regression of murine liver fibrosis. Proceedings of the National Academy of Sciences, 109.
- Rittinghausen, S., Hackbarth, A., Creutzenberg, O., Ernst, H., Heinrich, U., Leonhardt, A. and Schaudien, D. (2014): The carcinogenic effect of various multi-walled carbon nanotubes (MWCNTs) after intraperitoneal injection in rats. Part. Fibre Toxicol., 11, 59.
- Rőszer, T. (2015): Understanding the Mysterious M2 Macrophage through Activation Markers and Effector Mechanisms. Mediators Inflamm., 2015, 816460.
- Rushton, E.K., Jiang, J., Leonard, S.S., Eberly, S., Castranova, V., Biswas, P., Elder, A., Han, X., Gelein, R., Finkelstein, J. and Oberdörster, G. (2010): Concept of assessing nanoparticle hazards considering nanoparticle dosemetric and chemical/biological response metrics. J. Toxicol. Environ. Health A, 73, 445-461.
- Saederup, N., Chan, L., Lira, S.A. and Charo, I.F. (2008): Fractalkine deficiency markedly reduces macrophage accumulation and atherosclerotic lesion formation in CCR2-/- mice: evidence for independent chemokine functions in atherogenesis. Circulation, 117, 1642-1648.
- Sakamoto, Y., Dai, N., Hagiwara, Y., Satoh, K., Ohashi, N., Fukamachi, K., Tsuda, H., Hirose, A., Nishimura, T., Hino, O. and Ogata, A. (2010): Serum level of expressed in renal carcinoma (ERC)/ mesothelin in rats with mesothelial proliferative lesions induced by multi-wall carbon nanotube (MWCNT). J. Toxicol. Sci., 35, 265-270.
- Sakamoto, Y., Hojo, M., Kosugi, Y., Watanabe, K., Hirose, A., Inomata, A., Suzuki, T. and Nakae, D. (2018): Comparative study for carcinogenicity of 7 different multi-wall carbon nanotubes with different physicochemical characteristics by a single intraperitoneal injection in male Fischer 344 rats. J. Toxicol. Sci., 43, 587-600.
- Sakamoto, Y., Nakae, D., Fukumori, N., Tayama, K., Maekawa, A., Imai, K., Hirose, A., Nishimura, T., Ohashi, N. and Ogata, A. (2009): Induction of mesothelioma by a single intrascrotal administration of multi-wall carbon nanotube in intact male Fischer 344 rats. J. Toxicol. Sci., 34, 65-76.
- Saleh, D.M., Luo, S., Ahmed, O.H., Alexander, D.B., Alexander, W.T., Gunasekaran, S., El-Gazzar, A.M., Abdelgied, M., Numano, T., Takase, H., Ohnishi, M., Tomono, S., Hady, R.H., Fukamachi, K., Kanno, J., Hirose, A., Xu, J., Suzuki, S., Naiki-Ito, A., Takahashi, S. and Tsuda, H. (2022): Assessment of the toxicity and carcinogenicity of double-walled carbon nanotubes in the rat lung after intratracheal instillation: a two-year study. Part. Fibre Toxicol., 19, 30.
- Satoh, T., Kidoya, H., Naito, H., Yamamoto, M., Takemura, N., Nakagawa, K., Yoshioka, Y., Morii, E., Takakura, N., Takeuchi, O. and Akira, S. (2013): Critical role of Trib1 in differentiation of tissue-resident M2-like macrophages. Nature, 495, 524-528.
- Shichino, S., Abe, J., Ueha, S., Otsuji, M., Tsukui, T., Kosugi-Kanaya, M., Shand, F.H., Hashimoto, S., Suzuki, H.I., Morikawa, T., Inagaki, Y. and Matsushima, K. (2015): Reduced supply of monocyte-derived macrophages leads to a transition from nodular to diffuse lesions and tissue cell activation in silica-induced pulmonary fibrosis in mice. Am. J. Pathol., 185, 2923-2938.
- Shvedova, A.A., Tkach, A.V., Kisin, E.R., Khaliullin, T., Stanley, S., Gutkin, D.W., Star, A., Chen, Y., Shurin, G.V., Kagan, V.E. and Shurin, M.R. (2013): Carbon nanotubes enhance metastatic growth of lung carcinoma via up-regulation of myeloid-derived suppressor cells. Small, 9, 1691-1695.
- Sica, A. and Mantovani, A. (2012): Macrophage plasticity and polarization: in vivo veritas. J. Clin. Invest., 122, 787-795.
- Silva, M.T. (2011): Macrophage phagocytosis of neutrophils at inflammatory/infectious foci: a cooperative mechanism in the control of infection and infectious inflammation. J. Leukoc. Biol., 89, 675-683.
- Stanton, M.F., Laynard, M., Tegeris, A., Miller, E., May, M. and Kent, E. (1977): Carcinogenicity of fibrous glass: pleural response in the rat in relation to fiber dimension. J. Natl. Cancer Inst., 58, 587-603.
- Suresh, M.V., Yu, B., Machado-Aranda, D., Bender, M.D., Ochoa-Frongia, L., Helinski, J.D., Davidson, B.A., Knight, P.R., Hogaboam, C.M., Moore, B.B. and Raghavendran, K. (2012): Role of macrophage chemoattractant protein-1 in acute inflammation after lung contusion. Am. J. Respir. Cell Mol. Biol., 46, 797-806.
- Suzuki, Y. and Kohyama, N. (1984): Malignant mesothelioma induced by asbestos and zeolite in the mouse peritoneal cavity. Environ. Res., 35, 277-292.
- Takagi, A., Hirose, A., Futakuchi, M., Tsuda, H. and Kanno, J. (2012): Dose-dependent mesothelioma induction by intraperitoneal administration of multi-wall carbon nanotubes in p53 heterozygous mice. Cancer Sci., 103, 1440-1444.
- Takagi, A., Hirose, A., Nishimura, T., Fukumori, N., Ogata, A., Ohashi, N., Kitajima, S. and Kanno, J. (2008): Induction of mesothelioma in p53+/- mouse by intraperitoneal application of multi-wall carbon nanotube. J. Toxicol. Sci., 33, 105-116.
- Takahashi, M., Galligan, C., Tessarollo, L. and Yoshimura, T. (2009): Monocyte chemoattractant protein-1 (MCP-1), not MCP-3, is the primary chemokine required for monocyte recruitment in mouse peritonitis induced with thioglycollate or zymosan A. J. Immunol., 183, 3463-3471.
- Tamoutounour, S., Henri, S., Lelouard, H., de Bovis, B., de Haar, C., van der Woude, C.J., Woltman, A.M., Reyal, Y., Bonnet, D., Sichien, D., Bain, C.C., Mowat, A.M., Reis e Sousa, C., Poulin, L.F., Malissen, B. and Guilliams, M. (2012): CD64 distinguishes macrophages from dendritic cells in the gut and reveals the Th1-inducing role of mesenteric lymph node macrophages during colitis. Eur. J. Immunol., 42, 3150-3166.
- Taquahashi, Y., Ogawa, Y., Takagi, A., Tsuji, M., Morita, K. and Kanno, J. (2013): Improved dispersion method of multi-wall carbon nanotube for inhalation toxicity studies of experimental animals. J. Toxicol. Sci., 38, 619-628.
- Terri, M., Trionfetti, F., Montaldo, C., Cordani, M., Tripodi, M., Lopez-Cabrera, M. and Strippoli, R. (2021): Mechanisms of Peritoneal Fibrosis: Focus on Immune Cells-Peritoneal Stroma Interactions. Front. Immunol., 12, 607204.
- Vogel, D.Y., Vereyken, E.J., Glim, J.E., Heijnen, P.D., Moeton, M., van der Valk, P., Amor, S., Teunissen, C.E., van Horssen, J. and Dijkstra, C.D. (2013): Macrophages in inflammatory multiple sclerosis lesions have an intermediate activation status. J. Neuroinflammation, 10, 35.
- Wareing, M.D., Lyon, A., Inglis, C., Giannoni, F., Charo, I. and Sarawar, S.R. (2007): Chemokine regulation of the inflammatory response to a low-dose influenza infection in CCR2-/- mice. J. Leukoc. Biol., 81, 793-801.
- Witherel, C.E., Abebayehu, D., Barker, T.H. and Spiller, K.L. (2019): Macrophage and Fibroblast Interactions in Biomaterial-Mediated Fibrosis. Adv. Healthc. Mater., 8, e1801451.
- Yamaguchi, A., Fujitani, T., Ohyama, K., Nakae, D., Hirose, A., Nishimura, T. and Ogata, A. (2012): Effects of sustained stimulation with multi-wall carbon nanotubes on immune and inflammatory responses in mice. J. Toxicol. Sci., 37, 177-189.
- Yang, W., Zhao, X., Tao, Y., Wu, Y., He, F. and Tang, L. (2019): Proteomic analysis reveals a protective role of specific macrophage subsets in liver repair. Sci. Rep., 9, 2953.