Abstract
Antiparasitic ivermectin has been reported to induce cardiovascular adverse events, including orthostatic hypotension, tachycardia and cardiopulmonary arrest, of which the underlying pathophysiology remains unknown. Since its drug repurposing as an antiviral agent is underway at higher doses than those for antiparasitic, we evaluated the cardiovascular safety pharmacology of ivermectin using isoflurane-anesthetized beagle dogs (n=4). Ivermectin in doses of 0.1 followed by 1 mg/kg was intravenously infused over 10 min with an interval of 20 min, attaining peak plasma concentrations of 0.94 ± 0.04 and 8.82 ± 1.25 μg/mL, which were 29-31 and 276-288 times higher than those observed after its antiparasitic oral dose of 12 mg/body, respectively. The latter peak concentration was > 2 times greater than those inhibiting proliferation of dengue virus, severe acute respiratory syndrome coronavirus 2 (SARS-CoV-2) and hepatitis B virus in vitro. Ivermectin decreased heart rate without altering mean blood pressure, suggesting that ivermectin does not cause hypotension or tachycardia directly. Ivermectin hardly altered atrioventricular nodal or intraventricular conduction, indicating a lack of inhibitory action on Ca2+ or Na+ channel in vivo. Ivermectin prolonged QT interval/QTcV in a dose-related manner and tended to slow the repolarization speed in a reverse frequency-dependent manner, supporting previously described its IKr inhibition, which would explain Tpeak-Tend prolongation and heart-rate reduction in this study. Meanwhile, ivermectin did not significantly prolong J-Tpeakc or terminal repolarization period, indicating torsadogenic potential of ivermectin leading to the onset of cardiopulmonary arrest would be small. Thus, ivermectin has a broad range of cardiovascular safety profiles, which will help facilitate its drug repurposing.
INTRODUCTION
Ivermectin is an antiparasitic drug approved for clinical use in 1987 (Molyneux and Ward, 2015). The drug has been used for preventing and treating parasitic infection with ascariasis, head lice, lymphatic filariasis, onchocerciasis, scabies, strongyloidiasis and trichuriasis (Conterno et al., 2020; Coscione et al., 2018). Importantly, cardiovascular adverse events of ivermectin have been also noticed. For example, in clinical trials involving 963 adult patients who received 100 to 200 μg/kg of ivermectin for treating onchocerciasis, orthostatic hypotension (1.1%) and tachycardia (3.5%) occurred according to information from the manufacturer (Merck Sharp & Dohme LLC, NJ, USA, revised May 2022), and these two cardiovascular adverse events have been also reported in a large clinical trial (Goa et al., 1991; WHO Health Organization, 1987) and a case report (Sparsa et al., 2006), respectively. Furthermore, among 750 patients treated for scabies, one case of cardiopulmonary arrest was reported according to information from the manufacturer (Maruho Co., Ltd., Osaka, Japan, published October 2021, version 17). In recent years, drug repurposing of ivermectin as an antiviral agent has been active; namely, higher doses of ivermectin than those for antiparasitic have been reported to exert antiviral activity against Zika, dengue, yellow fever, West Nile, Newcastle, Sindbis, Avian influenza A, hepatitis B viruses and severe acute respiratory syndrome coronavirus 2 (SARS-CoV-2) in the in vitro and in vivo experimental infection models (Heidary and Gharebaghi, 2020; Nakanishi et al., 2022). There, in vitro inhibitory concentrations of ivermectin for dengue virus, SARS-CoV-2 and hepatitis B virus were described to be 1.66-2.32, 2.2-2.8 and 5 µmol/L (Caly et al., 2020; Kinobe and Owens, 2021; Nakanishi et al., 2022), respectively, which were 45-66, 60-80 and 137-143 times greater than its antiparasitic concentration (35-37 nmol/L) after single oral dosing (12 mg/body) described in the information from the manufacturer (Maruho Co., Ltd.). Since ivermectin was approved before the ICH S7B guideline went into effect in 2005, experimental information on cardiovascular safety profiles along with the onset mechanisms of cardiovascular adverse events is still limited.
To better understand the underlying pathophysiology of those clinical adverse events, we precisely evaluated the cardiovascular effects of ivermectin using the isoflurane-anesthetized beagle dogs (Saito et al., 2021a, 2021b) as the ICH S7B follow-up study. For this purpose, we recorded His-bundle electrogram and monophasic action potential (MAP) in addition to the lead II electrocardiogram to precisely analyze the drug effects on depolarization and repolarization (Sugiyama, 2008). Since QT-interval prolongation by itself may not necessarily predict the onset of torsade de pointes (Johannesen et al., 2014; Strauss et al., 2021; Sugiyama, 2008), we measured 3 types of proarrhythmic surrogate markers; namely, early repolarization period (J-Tpeak) and late repolarization period (Tpeak-Tend) as well as terminal repolarization period (Goto et al., 2023). The J-Tpeak estimates the net balance between inward currents (INa,L and ICa,L) and outward ones (IKs and IKr) during phase 2 of the action potential. Its prolongation may eventually overload the sarcoplasmic reticulum of ventricular cardiomyocytes with Ca2+, which could increase the short-term variability of repolarization, governing “trigger” of premature contractions (Johannesen et al., 2014). The Tpeak-Tend reflects the extent of IKr inhibition, of which prolongation could reflect the global increase of transmural dispersion of ventricular repolarization, providing "substrate" for the initiation of spiral reentry (Johannesen et al., 2014). The terminal repolarization period was calculated by the difference between the duration of MAP and the ventricular effective refractory period (VERP) at the same site, which could reflect the magnitude of local electrical vulnerability, providing "substrate" for the perpetuation of spiral reentry (Sugiyama and Hashimoto, 2002). Finally, we compared the current results of ivermectin on these proarrhythmic surrogate markers with those of typical antiviral drugs (Cao et al., 2016; Kitahara et al., 2013; Kondo et al., 2020) to better characterize the cardiac safety profile of ivermectin.
MATERIALS AND METHODS
A total of 4 female beagle dogs weighing approximately 10 kg were obtained from Kitayama Labes Co., Ltd. (Nagano, Japan). All experiments were approved by the Toho University Animal Care and User Committee (No. 21-51-470, 22-52-470) and performed in accordance with the Guidelines for the Care and Use of Laboratory Animals of Toho University.
Surgical procedures
Beagle dogs (n=4) were initially anesthetized with thiopental sodium (30 mg/kg, i.v.). After intubation with a cuffed endotracheal tube, anesthesia was maintained by inhalation of isoflurane (1.5-2.5% v/v) vaporized in oxygen with a volume-limited ventilator (SN-480-3, Shinano Manufacturing Co., Ltd., Tokyo, Japan). Tidal volume and respiratory rate were set at 20 mL/kg and 15 breaths/min, respectively. Four clinically available catheter sheath sets (Terumo Corporation, Tokyo, Japan) were used; two were inserted into the right and left femoral arteries toward the aorta, and the other two were done into the right and left femoral veins toward the inferior vena cava for introducing the catheters as described below. Heparin calcium (100 IU/kg) was administered to prevent blood clotting through a flush line of the catheter sheath placed at the right femoral vein.
Cardiohemodynamic variables
A pig-tail catheter was placed at the left ventricle through the right femoral artery to measure the left ventricular pressure, whereas the aortic pressure was measured at a space between the inside of the catheter sheath and outside of the pig-tail catheter through a flush line. The left ventricular pressure at a time point of peak of R wave on the electrocardiogram was defined as the left ventricular end-diastolic pressure (Nagueh et al., 2001). The maximum upstroke velocities of left ventricular pressure (LVdP/dtmax) and the left ventricular end-diastolic pressure were obtained during sinus rhythm to estimate the isovolumic systolic function and the preload to left ventricle, respectively. A thermodilution catheter (132F5; Edwards Lifesciences, Irvine, CA, USA) was positioned at right side of the heart through the right femoral vein. The cardiac output was measured by using a standard thermodilution method with a cardiac output computer (MFC-1100, Nihon Kohden Corporation, Tokyo, Japan). The total peripheral vascular resistance was calculated with the following basic equation: total peripheral vascular resistance=mean blood pressure/cardiac output.
Electrophysiological variables
The lead II electrocardiogram was obtained from the limb electrodes. The PR interval, QRS width and QT interval along with the J-Tpeak and Tpeak-Tend were measured. When the end of T-wave was obscure, we used the MAP signals as a guide to estimate its end. The QT interval was corrected with Van de Water's formula: QTcV=QT−0.087×(RR−1,000) with RR given in ms (Van de Water et al., 1989), whereas the J-Tpeak was done with Johannesen's formula: J-Tpeakc=J-Tpeak/RR0.58 with RR given in seconds (Johannesen et al., 2014). A correction was not made on the Tpeak-Tend, since previous QT studies have shown a minimal heart-rate dependency in the Tpeak-Tend at resting heart rate (Johannesen et al., 2014).
A standard 6-French quad-polar electrodes catheter (Cordis-Webster Inc., Baldwin Park, CA, USA) was positioned at the non-coronary cusp of the aortic valve through the left femoral artery to obtain the His-bundle electrogram. A bidirectional steerable MAP recording/pacing combination catheter (1675P, EP Technologies, Inc., Sunnyvale, CA, USA) was positioned at the endocardium of the interventricular septum in the right ventricle through the left femoral vein to obtain MAP signals which were amplified with a DC preamplifier (model 300, EP Technologies, Inc.). The interval (ms) at 90% repolarization was defined as MAP90.
The heart was electrically driven with a cardiac stimulator (SEC-3102, Nihon Kohden Corporation) via pacing electrodes of the combination catheter placed in the right ventricle. The stimulation pulses were rectangular in shape, 2-2.5 V (about twice the threshold voltage) and of 1-ms duration. The MAP90 of the ventricle was measured during sinus rhythm (MAP90(sinus)) and ventricular pacing at cycle lengths of 400 ms (MAP90(CL400)) and 300 ms (MAP90(CL300)). The ventricular effective refractory period (VERP) was assessed with programmed electrical stimulation. The pacing protocol consisted of 5 beats of basal stimuli in a cycle length of 400 ms followed by an extra stimulus of various coupling intervals. Starting in the late diastole, the coupling interval was shortened in 5-ms decrements until the additional stimulus could no longer elicit a response. The VERP was defined as the shortest coupling interval that could produce a response. The duration of terminal repolarization period of the ventricle was calculated as the difference between the MAP90(CL400) and VERP (terminal repolarization period=MAP90(CL400)−VERP) at the same site to estimate the extent of electrical vulnerability of the ventricular muscle (Sugiyama and Hashimoto, 2002).
Experimental protocol
The aortic pressure, left ventricular pressure, electrocardiogram, His-bundle electrogram and MAP signals were monitored with a polygraph system (RM-6000, Nihon Kohden Corporation) and analyzed by using a real-time, fully automatic data analysis system (Win VAS 3 for Windows ver. 1.1R24v; Physio-Tech Co., Ltd., Tokyo, Japan). Three recordings of consecutive complexes were used to calculate the mean for the electrocardiographic indices, MAP duration as well as atrio-His (AH) and His-ventricular (HV) intervals. The cardiovascular variables were assessed in the following order. The electrocardiogram, His-bundle electrogram, aortic pressure, left ventricular pressure and MAP signals were recorded under sinus rhythm. Then, the cardiac output was measured 3 times. Next, the MAP signals were recorded during the ventricular pacing at cycle lengths of 400 and 300 ms. Finally, the VERP was measured. All parameters described above were usually obtained within 2 min at each time point. After the basal assessment, ivermectin in a low dose of 0.1 mg/kg was intravenously infused over 10 min, and each variable was assessed at 5, 10, 15, 20 and 30 min after the start of administration. Then, the drug in a high dose of 1 mg/kg was infused over 10 min, and each variable was assessed at 5, 10, 15, 20, 30, 45 and 60 min after the start of administration.
Measurement of plasma concentration of ivermectin
The concentration of ivermectin was determined in arterial blood samples obtained at 5, 10, 15 and 30 min after the start of low-dose administration, and at 5, 10, 15, 30 and 60 min after the start of high-dose administration. The blood samples were centrifuged at 1,500 × g at 4°C for 15 min, of which supernatant plasma was stored at −80°C. The plasma concentration of ivermectin was quantified by liquid chromatography-tandem mass spectrometry (LC-MS/MS) system (Shimadzu Corporation, Kyoto, Japan). The analytical method and representative chromatograms are provided in supplementary data.
Drugs and chemicals
Ivermectin (FUJIFILM Wako Pure Chemical Corporation, Osaka, Japan) was dissolved with ethanol to obtain a 6.67 mg/mL solution. The solution was intravenously infused at a rate of 1.5 and 15 µL/kg per min to perform 0.1 and 1 mg/kg administration, respectively. We have confirmed that those volumes of ethanol hardly altered cardiovascular variables in the anesthetized dogs (Sugiyama et al., 2001). Heparin calcium (Caprocin®, Sawai Pharmaceutical Co., Ltd., Osaka, Japan), isoflurane inhalation solution [Pfizer] (Mylan Seiyaku Ltd., Tokyo, Japan), thiopental sodium (Ravonal® 0.5 g for Injection, Mitsubishi-Tanabe Pharma Co., Osaka, Japan) and saline (Otsuka Pharmaceutical Factory Inc., Tokushima, Japan) were purchased.
Statistical analysis
Data are presented as mean ± S.E. The statistical significances within a parameter were evaluated by one-way, repeated-measures analysis of variance (ANOVA) followed by Contrasts as a post-hoc test for mean values comparison. Meanwhile, differences between MAP90(CL400) and MAP90(CL300) at each time point were analyzed with t-test. A p-value < 0.05 was considered to be statistically significant.
RESULTS
No animal exerted any lethal ventricular arrhythmias or hemodynamic collapse leading to animals’ death during the experimental period.
Plasma concentration
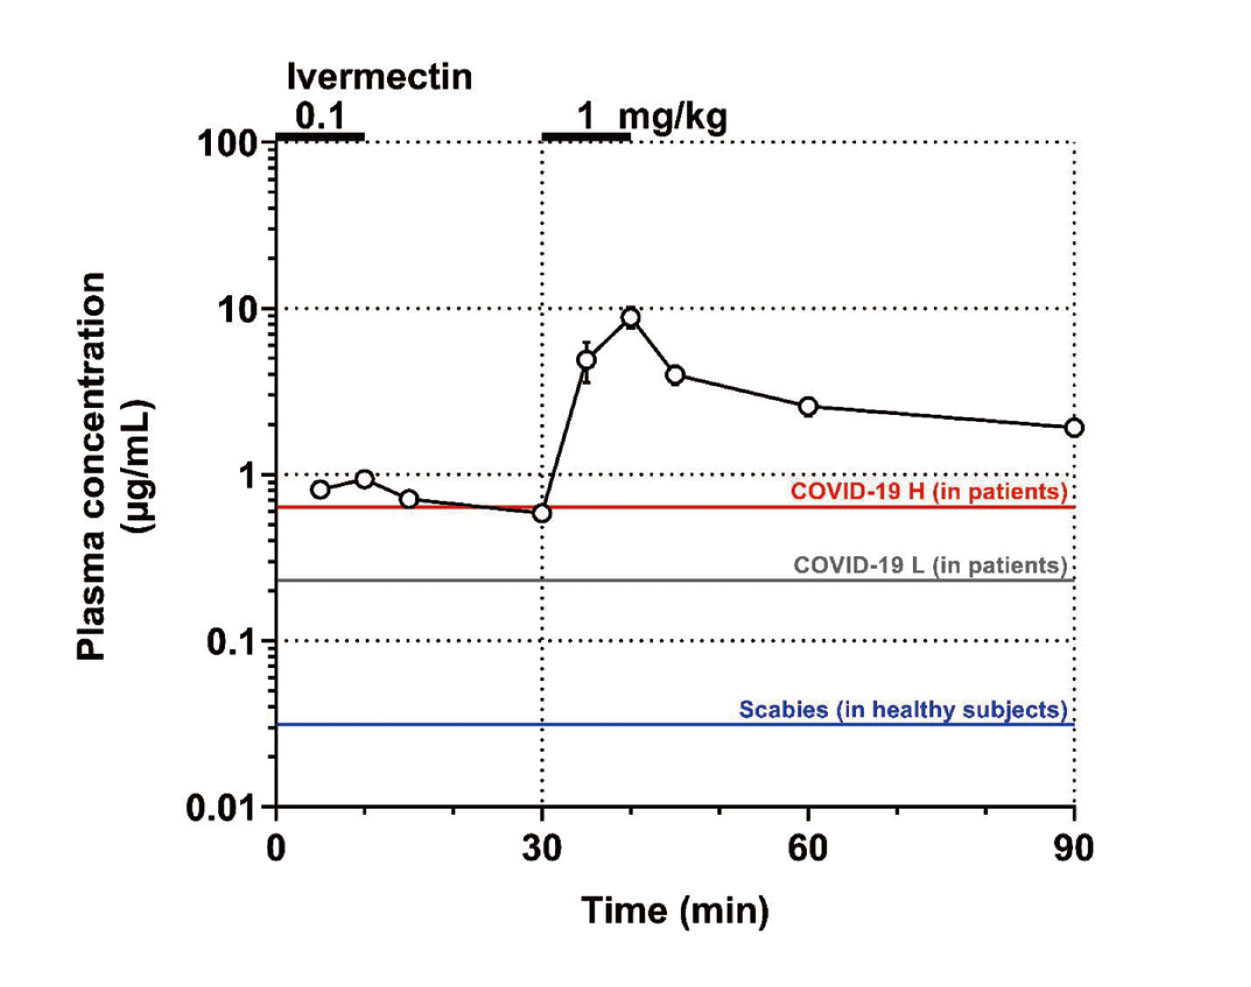
The time course of changes in the plasma concentrations of ivermectin is summarized in Fig. 1. Ivermectin in doses of 0.1 and 1 mg/kg attained the peak plasma concentrations of 0.94 ± 0.04 μg/mL (1.07 ± 0.04 μmol/L) and 8.82 ± 1.25 μg/mL (10.08 ± 1.43 μmol/L) at the end of infusion, respectively. The plasma concentrations of ivermectin obviously decreased in distribution and elimination phases, and its time course followed a pattern that may be predicted by the two-compartment model.
Cardiohemodynamic effects
Typical tracings of the aortic and left ventricular pressures during sinus rhythm are shown in Fig. 2, whereas the time courses of changes in cardiohemodynamic variables are summarized in Fig. 3. The pre-drug control values (C) of the heart rate, mean blood pressure, cardiac output, total peripheral vascular resistance, LVdP/dtmax and left ventricular end-diastolic pressure were 107 ± 8 bpm, 117 ± 7 mmHg, 2.70 ± 0.44 L/min, 46 ± 5 mmHg/L/min, 2,969 ± 309 mmHg/s and 8 ± 1 mmHg, respectively. The low dose did not alter any of these variables. The high dose decreased the heart rate for 45-60 min, whereas no significant change was detected in the other variables.
Electrophysiological effects
Typical tracings of the His-bundle electrogram and electrocardiogram during sinus rhythm are shown in Fig. 2, whereas the time courses of changes in the electrocardiographic variables, and AH and HV intervals are summarized in Fig. 4. The pre-drug control values (C) of the PR interval and QRS width; QT interval and QTcV; J-Tpeakc and Tpeak-Tend; and AH and HV intervals were 93 ± 3 ms and 59 ± 2 ms; 299 ± 12 ms and 336 ± 9; 186 ± 8 and 106 ± 4 ms; and 76 ± 2 ms and 24 ± 2 ms, respectively. The low dose prolonged the QT interval and QTcV for 10-30 min, whereas no significant change was detected in the other variables. The high dose also prolonged the QT interval and QTcV for 5-60 min, and prolonged the Tpeak-Tend for 15-60 min, whereas no significant change was detected in the other variables.

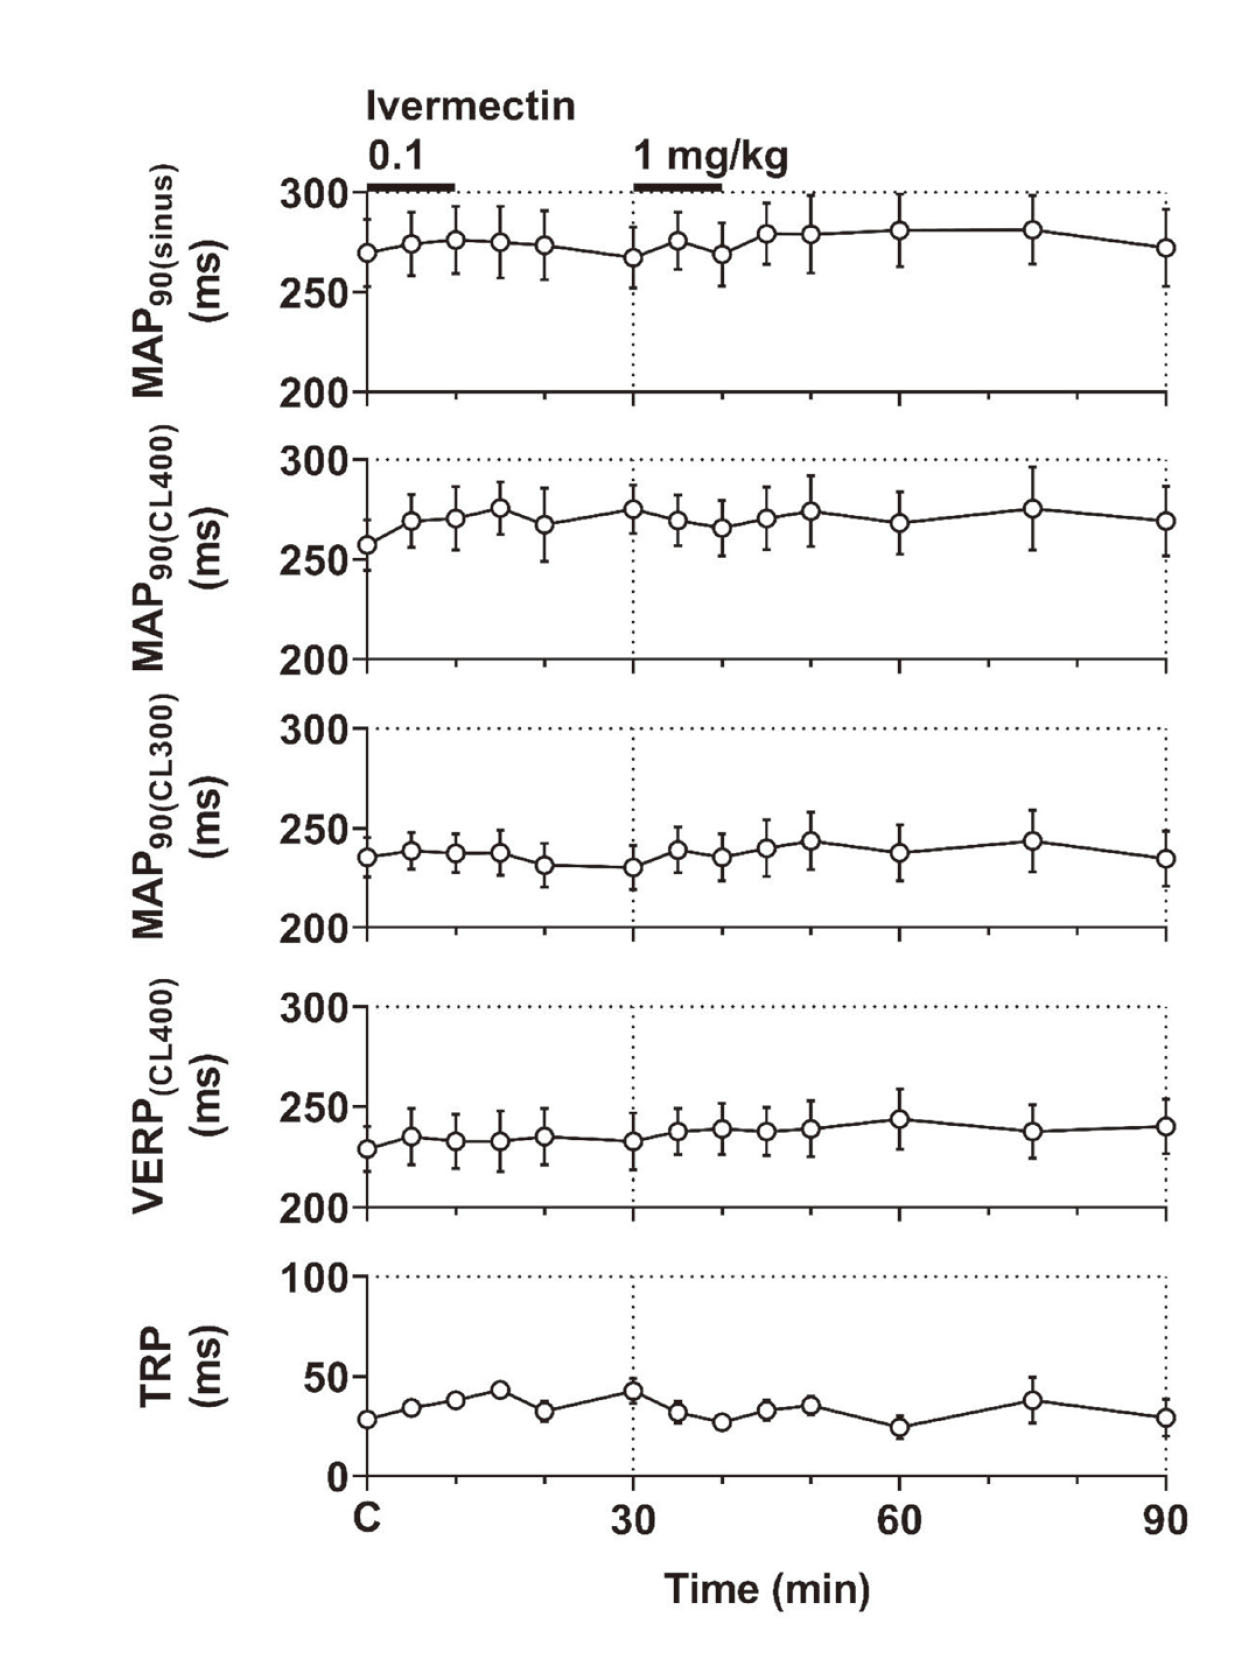
Typical tracings of the MAP during sinus rhythm are shown in Fig. 2, whereas the time courses of changes in the electrophysiological variables are summarized in Fig. 5. The pre-drug control values (C) of the MAP90(sinus), MAP90(CL400), MAP90(CL300), VERP(CL400) and terminal repolarization period were 270 ± 17 ms, 257 ± 13 ms, 235 ± 10 ms, 229 ± 11 ms and 28 ± 2 ms, respectively. The low as well as high dose did not alter any of these variables. The increments of MAP90(CL400) and MAP90(CL300) from their respective basal control value were +17 ± 5 and +8 ± 6 ms, respectively at 20 min after the high dose administration when the prolongation of QTcV was the greatest. Significant difference was not attained in the increments between MAP90(CL400) and MAP90(CL300) (p=0.08).
DISCUSSION
Ivermectin impacted several cardiohemodynamic and electrophysiological variables, including the heart-rate reduction and the prolongation of QT interval/QTcV and Tpeak-Tend, the significances of which were analyzed as discussed below.
Rationale for the drug doses used in this study
The clinically recommended oral dose of ivermectin is approximately 0.2 mg/kg as a single dose for the treatment of scabies, and twice at 2-week interval for that of intestinal strongyloidiasis according to the information from the manufacturer (Maruho Co, Ltd.). In a phase I study with healthy Japanese subjects (n=5), Cmax after a single oral dosing of 6 and 12 mg/body of ivermectin was 19.9 ± 4.8 ng/mL (22.7 ± 5.5 nmol/L) and 32.0 ± 7.3 ng/mL (36.6 ± 8.3 nmol/L), respectively. In another phase I study with healthy non-Japanese subjects (n=12), Cmax after single oral dosing of 6, 12 and 15 mg/body of ivermectin was 18.3 ± 2.8 ng/mL (20.9 ± 3.2 nmol/L), 30.6 ± 4.5 ng/mL (35.0 ± 5.1 nmol/L) and 48.5 ± 10.2 ng/mL (55.4 ± 11.6 nmol/L), respectively according to the information from the manufacturer (Maruho Co, Ltd.). Although the bioavailability of ivermectin for humans or dogs has not been reported, it was described as 48.1% for horses (Gokbulut et al., 2010). Supposing that the bioavailability of ivermectin is similar among the species, intravenous doses of 0.1 and 1 mg/kg in this study would be equivalent to oral doses of 0.21 and 2.1 mg/kg, which may reflect clinically relevant and 10 times of oral doses for those patients, respectively.
Intravenous administration of ivermectin in doses of 0.1 and 1 mg/kg attained the peak plasma concentrations of 0.94 ± 0.04 μg/mL (1.07 ± 0.04 μmol/L) and 8.82 ± 1.25 μg/mL (10.08 ± 1.43 μmol/L) (Fig. 1), respectively, which were 29-31 and 276-288 times higher than those attained after single oral dosing of 12 mg/body of ivermectin. It should be also noted that the peak plasma concentration of ivermectin after the high dose in this study was 4.3-6.1, 3.6-4.6 and 2.0 times higher than its in vitro inhibitory concentrations for dengue virus, SARS-CoV-2 and hepatitis B virus, respectively (Caly et al., 2020; Kinobe and Owens, 2021; Nakanishi et al., 2022). Moreover, in a clinical study to try to assess the safety and efficacy of high dose ivermectin in reducing viral load in individuals with early COVID-19, its daily oral doses of 0.6 mg/kg and 1.2 mg/kg for 5 consecutive days were evaluated (Buonfrate et al., 2022). The respective mean Cmax values were 230 ng/mL (n=7) and 634 ng/mL (n=3), indicating that peak plasma concentration in our canine study was >14 times higher than those of the clinical study (Fig. 1).
Cardiohemodynamic effects
In one case report, tachycardia was observed 3 days after the ivermectin administration to treat scabies (Sparsa et al., 2006), whereas 37 patients out of 14,488 (2.6%) exerted severe symptomatic orthostatic hypotension between 24 and 42 hr after the administration of ivermectin to treat onchocerciasis (Goa et al., 1991; WHO Health Organization, 1987). Accordingly, there was a time lag between the drug administration and the onset of adverse effects, which was explained by the patient’s immune response against the dead parasitic body (Goa et al., 1991). Meanwhile, in this study, ivermectin slightly but significantly decreased the heart rate without altering the mean blood pressure during the observation period. These findings indicate that ivermectin is unlikely to cause hypotension or tachycardias directly.
Electrophysiological effects
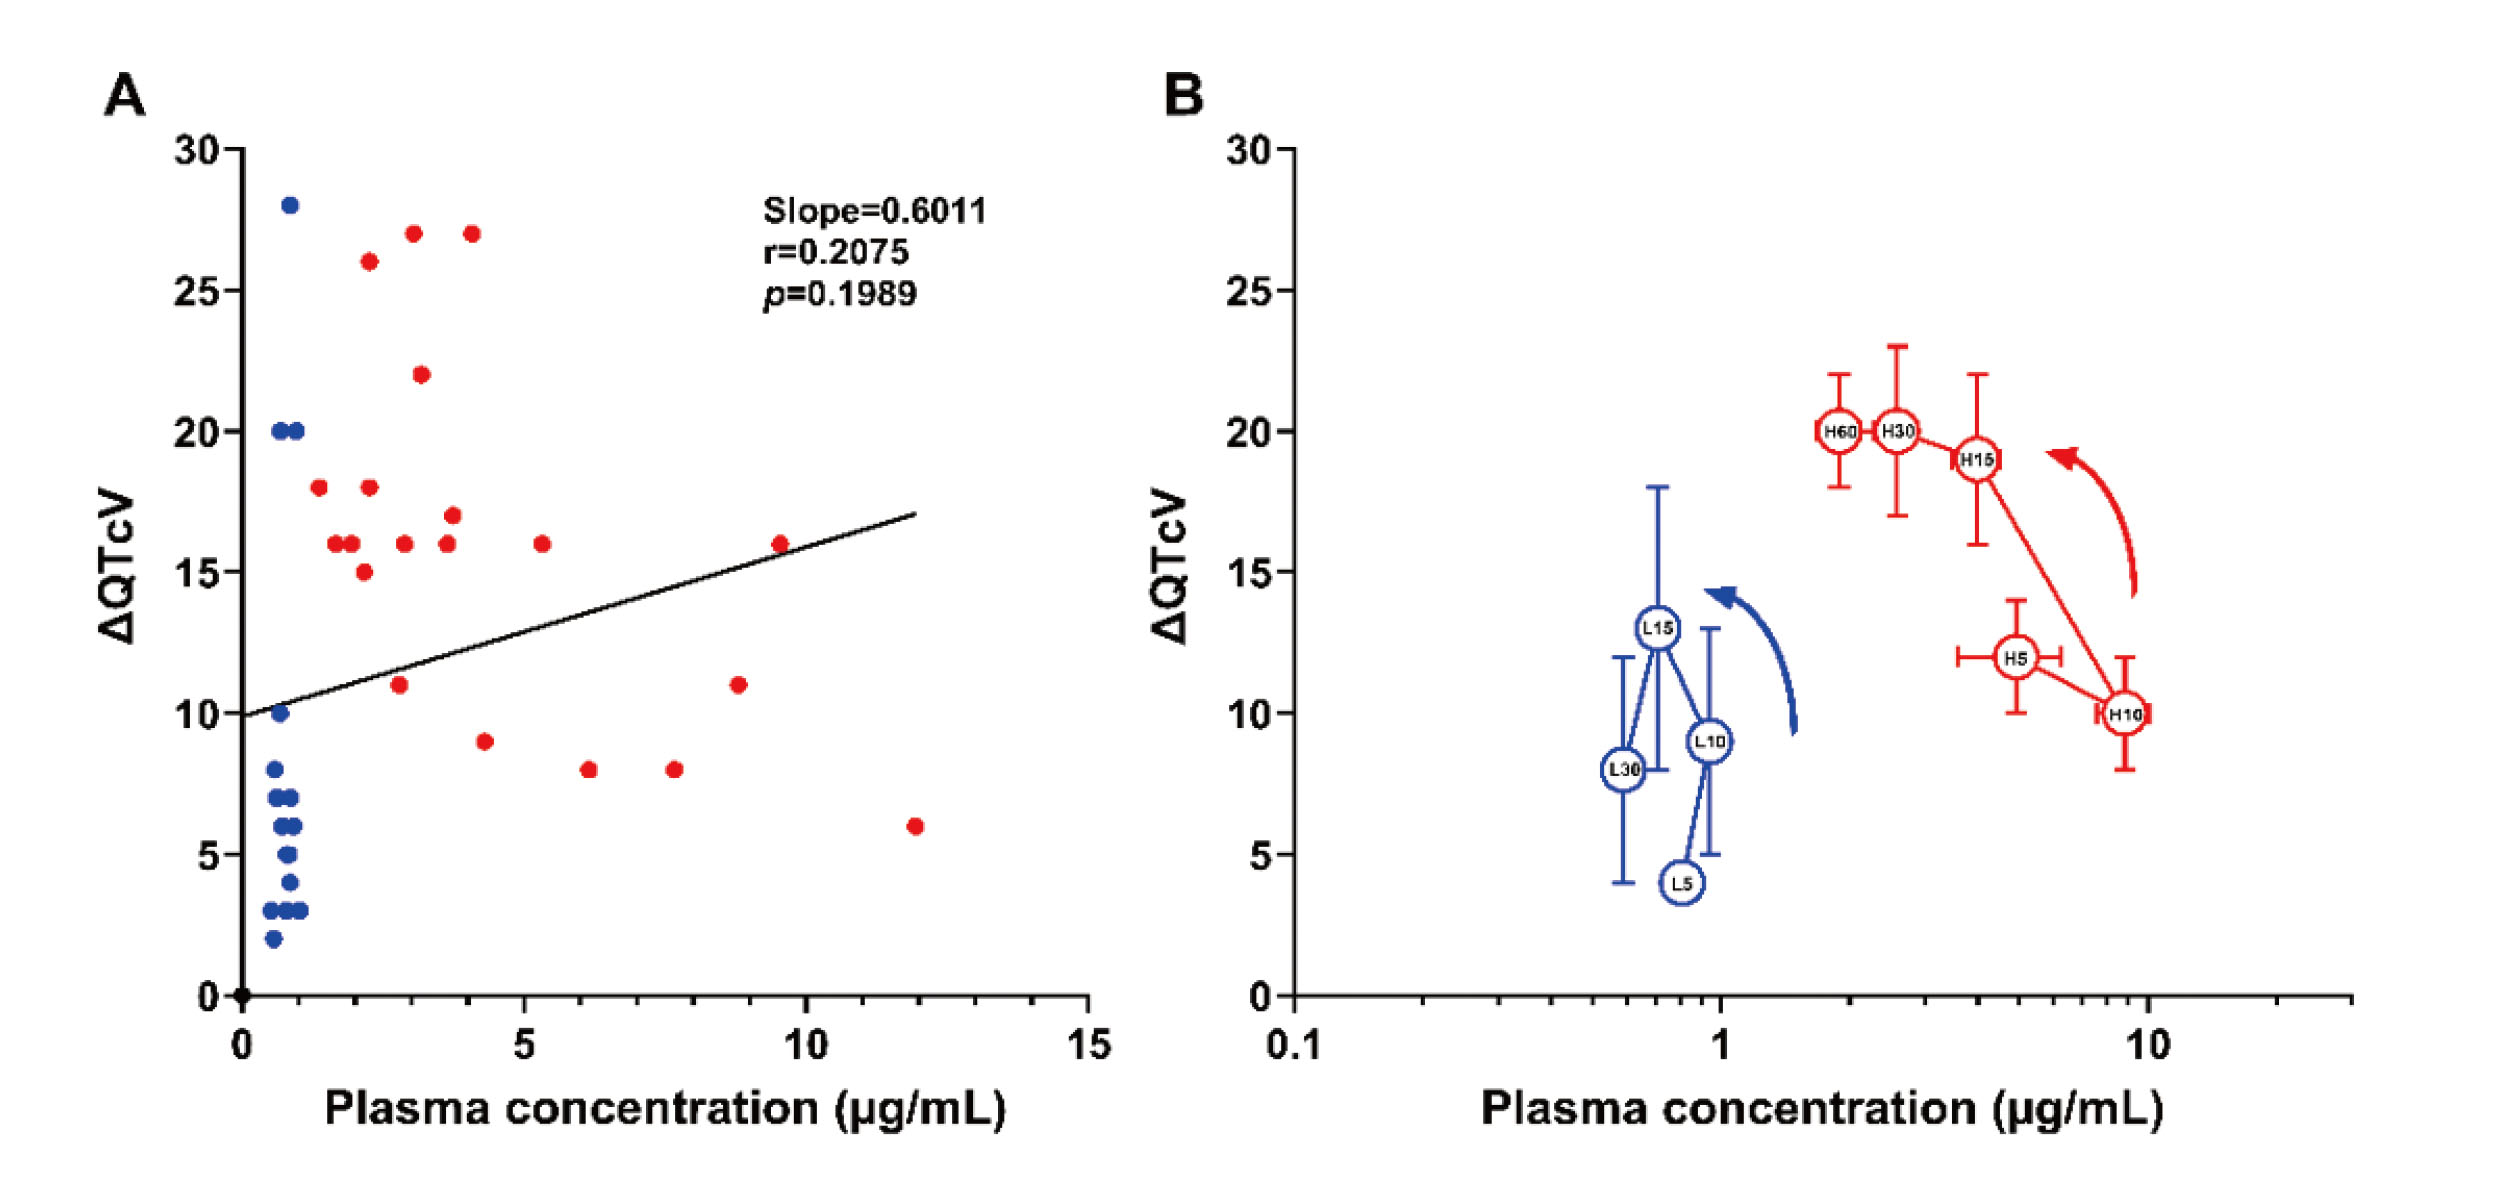
Ivermectin hardly altered the atrioventricular nodal or intraventricular conduction (Fig. 4), suggesting that ivermectin may not inhibit Ca2+ or Na+ channel. On the other hand, ivermectin prolonged the QT interval/QTcV in a dose-related manner (Fig. 4); moreover, it tended to prolong the MAP90 in a reverse frequency-dependent manner without achieving statistical significance (Fig. 5), indicating that ivermectin can inhibit IKr. Meanwhile, in a previous in vitro study (Kauthale et al., 2015), ivermectin directly inhibited IKr with IC50 of 12.52 μmol/L at 23°C and 24.41 μmol/L at 37°C. Since the human plasma protein binding ratio of ivermectin was reported to be 93.1% (Okonkwo et al., 1993), its free peak concentration in this study could be expected to be 0.69 μmol/L, which will be >18 times lower than the IC50 values for IKr. Ivermectin is an extremely lipid-soluble substance, of which 1-octanol/water partition coefficient is 1,651 according to the information from the manufacturer (Maruho Co, Ltd.). Accordingly, this knowledge of physicochemical properties suggests such a hypothesis that ivermectin could be accumulated in the heart to increase its local tissue concentration, partly explaining the slow onset of the negative chronotropic effect (Fig. 3) and ventricular repolarization delay (Fig. 4). In order to test the validity of that hypothesis, we initially evaluated the relationship between the plasma ivermectin concentration and the change in QTcV (∆QTcV) using all data points as depicted in Fig. 6A. No significant correlation was found between them. Next, to verify the presence of hysteresis, a diagram showing the time course of relationship between the plasma concentration and the ∆QTcV was depicted as Fig. 6B. After the low and high doses administration, a counterclockwise hysteresis was observed in the time course of relationship with further increase of the ΔQTcV even after Cmax. Thus, these findings support the hypothesis that ivermectin may accumulate in the heart.
The thorough QT study is useful to assess the presence or absence of QT-interval prolonging effects of drug candidates in human subjects. However, the evaluation of QT-interval prolongation alone cannot necessarily predict the degree of risk for inducing torsade de pointes (Johannesen et al., 2014; Strauss et al., 2021; Sugiyama, 2008). To address this issue, various alternative proarrhythmic surrogate markers are currently being discussed in ICH E14/S7B Q&A stage 2. The promising surrogate markers under discussion are the early (J-Tpeak) and late ventricular repolarizations (Tpeak-Tend) as used in this study (Strauss et al., 2021). Prolongation of both J-Tpeak and Tpeak-Tend has been considered to be a prerequisite for the onset of torsade de pointes (Johannesen et al., 2014). In this study, we further evaluated the proarrhythmic effect of ivermectin by simultaneously measuring the terminal repolarization period, a surrogate marker for the substrate of local reentry (Sugiyama and Hashimoto, 2002). Ivermectin prolonged the Tpeak-Tend (Fig. 4), indicating the risk for providing “substrate” for the initiation of spiral reentry, also supporting the IKr inhibitory action of ivermectin as described above. On the other hand, ivermectin did not prolong the J-Tpeakc (Fig. 4) or terminal repolarization period (Fig. 5), suggesting that either risk for providing “trigger” for the onset of early afterdepolarization or “substrate” for the perpetuation of spiral reentry may not be formed by ivermectin. Therefore, ivermectin by itself may have less potential to induce torsade de pointes.
In order to better characterize the proarrhythmic potential of ivermectin, we compared effects of the high dose of ivermectin on the proarrhythmic surrogate markers with those of supratherapeutic doses of aciclovir, amantadine and oseltamivir in our previous studies assessed under the halothane anesthesia (Cao et al., 2016; Kitahara et al., 2013; Kondo et al., 2020). Each effect was compared when the drug-induced QTcV prolongation was the greatest, which is summarized in Table 1. Ivermectin as well as the other antiviral drugs all prolonged the QTcV and Tpeak-Tend, whereas the effects on the J-Tpeakc and terminal repolarization period varied among the drugs. When the extent of QTcV prolongation was the greatest in each drug, the order of potency on the prolongation of J-Tpeakc was amantadine ≥ivermectin >oseltamivir and aciclovir shortened it; that of Tpeak-Tend was amantadine ≥aciclovir >oseltamivir =ivermectin; and that of terminal repolarization period was amantadine >ivermectin >aciclovir, and oseltamivir shortened it. Thus, the magnitude of proarrhythmic potential will be the most potent for amantadine and may be the least for oseltamivir, whereas those of ivermectin and aciclovir would be the middle among those four drugs.
Table 1. Comparison of effects of antiviral drugs on proarrhythmic surrogate markers in the anesthetized dogs.
| Drugs |
Ivermectin |
Aciclovir |
Amantadine |
Oseltamivir |
| Dose (mg/kg, i.v.) |
10 |
20 |
10 |
30 |
| Time after administration (min) |
20 |
60 |
10 |
10 |
| QTcV (ms (%)) |
+20 (+6)* |
+35 (+12)* |
+42 (+14)* |
+20 (+7)* |
| J-Tpeakc (ms (%)) |
+9 (+5) |
–3 (0) |
+10 (+6) |
+4 (+2) |
| Tpeak-Tend (ms (%)) |
+12 (+11)* |
+30 (+42)* |
+33 (+40)* |
+12 (+19) |
| TRP (ms (%)) |
+7 (+25) |
+4 (+12) |
+14 (+60) |
–4 (–1) |
Each value represents absolute change (% change) from their corresponding pre-drug basal control values (n=4 for each drug) when the magnitude of QTcV prolongation was the greatest. Data on aciclovir, amantadine and oseltamivir were obtained from our previous studies (Cao et al., 2016; Kitahara et al., 2013; Kondo et al., 2020). TRP: terminal repolarization period. See text for details.
Study limitation
We compared current findings of ivermectin obtained under the isoflurane anesthesia with those of aciclovir, amantadine and oseltamivir done under the halothane anesthesia (Cao et al., 2016; Kitahara et al., 2013; Kondo et al., 2020) (Table 1). In our previous comparative studies using the same group of beagle dogs (Saito et al., 2021a, 2021b), drug-induced cardiovascular responses were qualitatively and quantitatively similar between isoflurane and halothane anesthesia, indirectly providing the rationale for currently performed direct comparisons of the effects of those four drugs on the proarrhythmic surrogate markers.
In conclusion, the supratherapeutic concentration of ivermectin slightly but significantly decreased the heart rate without altering the mean blood pressure, suggesting ivermectin will not cause hypotension or tachycardia directly. Ivermectin hardly altered the atrioventricular nodal or intraventricular conduction, indicating a lack of inhibitory action on Ca2+ or Na+ channel. Ivermectin prolonged the late repolarization period possibly due to IKr inhibition, whereas it did not significantly alter the early repolarization or terminal repolarization, indicating that torsadogenic potential of ivermectin leading to the onset of cardiopulmonary arrest would be small. Thus, ivermectin has a broad range of cardiovascular safety profiles. Further information based on higher-dose exposure studies of ivermectin will facilitate its future drug repurposing as an antiviral agent.
ACKNOWLEDGMENTS
The authors thank Mr. Makoto Shinozaki and Mrs. Yuri Ichikawa for their technical assistance, and Dr. Koki Chiba for his productive advice during the preparation of the manuscript. This study was supported in part by JSPS KAKENHI Grant Number 20K16136 (to R.K.), 23K08430 (to A.S.) and 23K15143 (to A.G.); and Project Research Grant of Toho University School of Medicine Grant Number 23-22 (to N.S.).
Conflict of interest
The authors declare that there is no conflict of interest.
REFERENCES
- Buonfrate, D., Chesini, F., Martini, D., Roncaglioni, M.C., Ojeda Fernandez, M.L., Alvisi, M.F., De Simone, I., Rulli, E., Nobili, A., Casalini, G., Antinori, S., Gobbi, M., Campoli, C., Deiana, M., Pomari, E., Lunardi, G., Tessari, R. and Bisoffi, Z. (2022): High-dose ivermectin for early treatment of COVID-19 (COVER study): a randomised, double-blind, multicentre, phase II, dose-finding, proof-of-concept clinical trial. Int. J. Antimicrob. Agents, 59, 106516.
- Caly, L., Druce, J.D., Catton, M.G., Jans, D.A. and Wagstaff, K.M. (2020): The FDA-approved drug ivermectin inhibits the replication of SARS-CoV-2 in vitro. Antiviral Res., 178, 104787.
- Cao, X., Nakamura, Y., Wada, T., Izumi-Nakaseko, H., Ando, K. and Sugiyama, A. (2016): Electropharmacological effects of amantadine on cardiovascular system assessed with J-Tpeak and Tpeak-Tend analysis in the halothane-anesthetized beagle dogs. J. Toxicol. Sci., 41, 439-447.
- Conterno, L.O., Turchi, M.D., Corrêa, I. and Monteiro de Barros Almeida, R.A. (2020): Anthelmintic drugs for treating ascariasis. Cochrane Database Syst. Rev., 4, CD010599.
- Coscione, S., Esau, T., Kekeubata, E., Diau, J., Asugeni, R., MacLaren, D., Steer, A.C., Kositz, C. and Marks, M. (2018): Impact of ivermectin administered for scabies treatment on the prevalence of head lice in Atoifi, Solomon Islands. PLoS Negl. Trop. Dis., 12, e0006825.
- Goa, K.L., McTavish, D. and Clissold, S.P. (1991): Ivermectin. A review of its antifilarial activity, pharmacokinetic properties and clinical efficacy in onchocerciasis. Drugs, 42, 640-658.
- Gokbulut, C., Cirak, V.Y., Senlik, B., Aksit, D., Durmaz, M. and McKellar, Q.A. (2010): Comparative plasma disposition, bioavailability and efficacy of ivermectin following oral and pour-on administrations in horses. Vet. Parasitol., 170, 120-126.
- Goto, A., Kambayashi, R., Izumi-Nakaseko, H., Shinozaki, M., Takei, Y. and Sugiyama, A. (2023): Characterization of electropharmacological profile of an anti-atrial fibrillatory drug vernakalant along with potential risk toward torsade de pointes: translational studies using isoflurane-anesthetized dogs and isolated rat aortic preparations. J. Pharmacol. Sci., 152, 201-209.
- Heidary, F. and Gharebaghi, R. (2020): Ivermectin: a systematic review from antiviral effects to COVID-19 complementary regimen. J. Antibiot. (Tokyo), 73, 593-602.
- Johannesen, L., Vicente, J., Mason, J.W., Sanabria, C., Waite-Labott, K., Hong, M., Guo, P., Lin, J., Sørensen, J.S., Galeotti, L., Florian, J., Ugander, M., Stockbridge, N. and Strauss, D.G. (2014): Differentiating drug-induced multichannel block on the electrocardiogram: randomized study of dofetilide, quinidine, ranolazine, and verapamil. Clin. Pharmacol. Ther., 96, 549-558.
- Kauthale, R.R., Dadarkar, S.S., Husain, R., Karande, V.V. and Gatne, M.M. (2015): Assessment of temperature-induced hERG channel blockade variation by drugs. J. Appl. Toxicol., 35, 799-805.
- Kinobe, R.T. and Owens, L. (2021): A systematic review of experimental evidence for antiviral effects of ivermectin and an in silico analysis of ivermectin’s possible mode of action against SARS-CoV-2. Fundam. Clin. Pharmacol., 35, 260-276.
- Kitahara, K., Nakamura, Y., Tsuneoka, Y., Adachi-Akahane, S., Tanaka, H., Yamazaki, H., Takahara, A., Yamazaki, J., Ikeda, T. and Sugiyama, A. (2013): Cardiohemodynamic and electrophysiological effects of anti-influenza drug oseltamivir in vivo and in vitro. Cardiovasc. Toxicol., 13, 234-243.
- Kondo, Y., Hagiwara-Nagasawa, M., Kambayashi, R., Goto, A., Chiba, K., Nunoi, Y., Izumi-Nakaseko, H., Matsumoto, A. and Sugiyama, A. (2020): Electropharmacological characterization of aciclovir in the halothane-anesthetized dogs: A proposal of evaluation method for cardiovascular safety pharmacology of anti-virus drugs. Cardiovasc. Toxicol., 20, 419-426.
- Molyneux, D.H. and Ward, S.A. (2015): Reflections on the Nobel Prize for Medicine 2015–The public health legacy and impact of avermectin and artemisinin. Trends Parasitol., 31, 605-607.
- Nagueh, S.F., Sun, H., Kopelen, H.A., Middleton, K.J. and Khoury, D.S. (2001): Hemodynamic determinants of the mitral annulus diastolic velocities by tissue Doppler. J. Am. Coll. Cardiol., 37, 278-285.
- Nakanishi, A., Okumura, H., Hashita, T., Yamashita, A., Nishimura, Y., Watanabe, C., Kamimura, S., Hayashi, S., Murakami, S., Ito, K., Iwao, T., Ikeda, A., Hirose, T., Sunazuka, T., Tanaka, Y. and Matsunaga, T. (2022): Ivermectin inhibits HBV entry into the nucleus by suppressing KPNA2. Viruses, 14, 2468.
- Okonkwo, P.O., Ogbuokiri, J.E., Ofoegbu, E. and Klotz, U. (1993): Protein binding and ivermectin estimations in patients with onchocerciasis. Clin. Pharmacol. Ther., 53, 426-430.
- Saito, H., Kambayashi, R., Hagiwara-Nagasawa, M., Nunoi, Y., Goto, A., Izumi-Nakaseko, H., Kawai, S., Takei, Y., Matsumoto, A., Hoshiai, K., Akie, Y. and Sugiyama, A. (2021a): In vivo comparison of dl-sotalol-induced electrocardiographic responses among halothane anesthesia, isoflurane anesthesia with nitrous oxide, and conscious state. J. Pharmacol. Sci., 145, 16-22.
- Saito, H., Kambayashi, R., Goto, A., Hagiwara-Nagasawa, M., Hoshiai, K., Nunoi, Y., Izumi-Nakaseko, H., Akie, Y., Takei, Y., Matsumoto, A. and Sugiyama, A. (2021b): In vivo analysis of concentration-dependent effects of halothane or isoflurane inhalation on the electrocardiographic and hemodynamic variables in dogs. J. Pharmacol. Sci., 145, 268-272.
- Sparsa, A., Bonnetblanc, J.M., Peyrot, I., Loustaud-Ratti, V., Vidal, E. and Bédane, C. (2006): Systemic adverse reactions with ivermectin treatment of scabies. Ann. Dermatol. Venereol., 133, 784-787.
- Sugiyama, A. and Hashimoto, K. (2002): Effects of a typical I(Kr) channel blocker sematilide on the relationship between ventricular repolarization, refractoriness and onset of torsades de pointes. Jpn. J. Pharmacol., 88, 414-421.
- Sugiyama, A. (2008): Sensitive and reliable proarrhythmia in vivo animal models for predicting drug-induced torsades de pointes in patients with remodelled hearts. Br. J. Pharmacol., 154, 1528-1537.
- Sugiyama, A., Satoh, Y. and Hashimoto, K. (2001): Acute electropharmacological effects of intravenously administered amiodarone assessed in the in vivo canine model. Jpn. J. Pharmacol., 87, 74-82.
- Strauss, D.G., Wu, W.W., Li, Z., Koerner, J. and Garnett, C. (2021): Translational models and tools to reduce clinical trials and improve regulatory decision making for QTc and proarrhythmia risk (ICH E14/S7B updates). Clin. Pharmacol. Ther., 109, 319-333.
- Van de Water, A., Verheyen, J., Xhonneux, R. and Reneman, R.S. (1989): An improved method to correct the QT interval of the electrocardiogram for changes in heart rate. J. Pharmacol. Methods, 22, 207-217.
- WHO Health Organization. (1987): WHO Expert Committee on onchocerciasis. Third report. World Health Organ. Tech. Rep. Ser., 752, 1-167.