Abstract
Olanzapine is widely used as a treatment for schizophrenia and other psychiatric disorders. Its metabolic side effects, including weight gain and hyperglycemia, are a clinical problem; however, their full mechanism is not yet clearly understood. Recently, it was reported that the accumulation of oxidative stress in the hypothalamus may cause obesity and diabetes mellitus. Epidemiologically, metabolic side effects are known to be more likely to occur in women. In the present study, we investigated and tested the hypothesis that olanzapine induces oxidative stress in the hypothalamus and induces metabolic side effects. We also examined its association with sex differences. Olanzapine was administered intraperitoneally to male and female C57BL/6 mice, and the expression levels of oxidative stress-responsible genes in the hypothalamus and cerebral cortex were measured by qRT-PCR. In addition, olanzapine was administered intraperitoneally to C57BL/6 and Nrf2 KO mice, and the expression level of total glutathione was measured. Gene expressions induced by the Keap1-Nrf2-regulated system showed different responses to olanzapine for each gene. Under the conditions of this experiment, cystine-glutamate transporter was decreased although heme oxygenase-1 and γ-glutamylcysteine synthetase were increased. It was also clear that these responses were not hypothalamus-specific. Long-term feeding with olanzapine suppressed weight gain in males but not females. No glucose intolerance was observed at 13 weeks of administration. Furthermore, deaths occurred only in females. In conclusion, this study failed to provide evidence that olanzapine induces oxidative stress in a hypothalamic-specific manner. Instead, sex differences were observed in response to long-term and high-dose olanzapine administration, suggesting that individual susceptibility to olanzapine toxicity occurred in female mice.
INTRODUCTION
Atypical antipsychotics, such as multi-acting receptor targeted antipsychotics (MARTA) and dopamine system stabilizers (DSS), are characterized by a lower risk of extrapyramidal symptoms compared to typical antipsychotics, which mainly inhibit dopamine D2 receptors (Gardner et al., 2005; Li et al., 2016). Therefore, atypical antipsychotics are widely used for the treatment of schizophrenia and bipolar disorder. However, MARTA can cause metabolic side effects, including weight gain and hyperglycemia (Haupt and Newcomer, 2001; Taylor and McAskill, 2000). Weight gain may increase the likelihood a patient rejects a continuation of medication, reduce medication adherence, and make it more difficult to control the symptoms of schizophrenia. In addition, the progression of obesity and hyperglycemia leads to the development of type 2 diabetes mellitus and cardiovascular disease, which shortens life expectancy (Go et al., 2013; Low Wang et al., 2016). Therefore, the prevention of obesity and diabetes mellitus complicating schizophrenia patients is an important issue.
Olanzapine, a typical MARTA, was reported to cause weight gain and hyperglycemia by increasing appetite and insulin resistance (Ebenbichler et al., 2003; Kluge et al., 2007). In addition, in animal studies, olanzapine-induced weight gain was observed in females but not males (Albaugh et al., 2006; Lord et al., 2017; Pouzet et al., 2003). In humans, side effects such as obesity have been observed in women compared with men (Seeman, 2020), indicating there might be a sex difference in metabolic side effects caused by olanzapine.
The mechanisms related to metabolic side effects were reported to include an association with histamine H1 receptors, hyperphagia, and decreased physical activity due to serotonin 5-HT2C receptor inhibition, and structural abnormalities of proinsulin from pancreatic β-cells (Wirshing et al., 1999; Lord et al., 2017; Ninagawa et al., 2020). However, olanzapine binds to a variety of monoamine receptors (serotonin, dopamine, histamine, muscarinic, and adrenergic receptors) expressed by central nerves responsible for metabolic homeostasis (Bymaster et al., 1996), making its action complex. Therefore, the mechanism of olanzapine-induced side effects remains poorly understood.
Recently, the accumulation of oxidative stress in the hypothalamus, which plays a central role in the regulation of energy metabolism, was shown to cause obesity and diabetes mellitus by damaging feeding-related neurons, although these phenomena are not observed in Kelch-like ECH-associated protein 1 (Keap1) conditionally deficient mice. It was reported that activation of the Keap1-NF-E2-related factor 2 (Nrf2) system suppressed oxidative stress in the hypothalamus and prevented the development of obesity and diabetes mellitus (Yagishita et al., 2017).
Nrf2 is a transcription factor important for the maintenance of homeostasis in living organisms. Under unstressed conditions, Nrf2 is ubiquitinated by binding to Keap1 and undergoes proteasome-dependent proteolysis. Under stress conditions, the binding of Keap1 to Nrf2 is disrupted by reactive oxygen species (ROS) and electrophiles, and the ubiquitination of Nrf2 is attenuated. As a result, Nrf2 degradation is suppressed, and stabilized Nrf2 migrates into the nucleus, increasing the expression of various antioxidant genes such as heme oxygenase-1 (HO-1), cystine-glutamate transporter (xCT, SLC7A11) and γ-glutamylcysteine synthetase (GCS) involved in regulating glutathione (GSH) levels (Sasaki et al., 2002; Solis et al., 2002).
In this study, we hypothesized that olanzapine induces metabolic side effects such as obesity and hyperglycemia by inducing oxidative stress in the hypothalamus. We also hypothesized that the sex difference in the onset of metabolic side effects may be due to the fact that females are more susceptible to oxidative stress induced by olanzapine than males are. Therefore, the purpose of this study was to clarify the mechanism of olanzapine-induced metabolic side effects and its sex difference in terms of the above hypothesis.
MATERIALS AND METHODS
Materials
Olanzapine (Zyprexa) was purchased from Eli Lilly Corporation (Indianapolis, IN, USA). Olanzapine (# I960) was purchased from Ak-Scientific (Union City, CA, USA). Zyprexa was used for intraperitoneal (i.p.) administration. Olanzapine (# I960) was used for mixing into the diet. Normal diet (ND; F-2) was purchased from Sankyo Lab Service Corporation (Tokyo, Japan). High-fat diet (HFD; D12492M, 60 kcal% fat) was purchased from Research Diets (New Brunswick, NJ, USA). D-glucose, diazepam, formic acid, and ammonium formate were purchased from Wako Pure Chemicals (Osaka, Japan). LC-MS grade methanol and acetonitrile were purchased from Kanto Chemical Co., Inc. (Tokyo, Japan). Bond Elut QuEChERS extract pouches were purchased from Agilent Technologies (Santa Clara, CA, USA). All other reagents used were of the highest grade and commercially available.
Animals and treatments
Nrf2 gene-deficient (Nrf2 KO) mice were established by Itoh et al. (1997). C57BL/6J mice were mated with Nrf2 KO mice. Wild-type (WT) and deficient mice progenies were selected by their respective genotypes, and the lines for WT or deficient mice were established. Male and female C57BL/6J mice (7 weeks old) purchased from Sankyo Lab Service Corporation were used for some experiments. Mice were fed a ND as well as and water ad libitum unless otherwise noted. Mice were housed in plastic cages placed in a temperature-controlled room (22 ± 1°C) and maintained on a 12-hr light-dark cycle. Mice were grouped based on their body weight before the start of the experiment. All procedures for animal care were conducted in accordance with the National Institutes of Health Guide for the Care and Use of Laboratory Animals and were approved by the Institutional Animal Care and Use Committee of Showa University (Approval No. 23036). Zyprexa was diluted with water for injection to a concentration of 2.5 mg/mL. The diluting solvent was prepared as follows according to the package insert for Zyprexa: 25 mg lactose hydrate and 1.75 mg tartaric acid adjusted to pH 5 in 1 mL of water for injection.
Quantitation of RNA expression levels
Male and female WT mice were administered a single dose of olanzapine (25 mg/10 mL/kg, i.p.) or solvent (10 mL/kg, i.p.). The hypothalamus and cortex were collected at 3, 6, and 12 hr after administration. The brains were quickly frozen in liquid nitrogen, and stored at –80°C until the total RNA was extracted. Total RNA was isolated from the brain using RNeasy Mini Kit (QIAGEN Inc., CA, USA), and first-stranded cDNA was synthesized with PrimeScript RT Master Mix (Takara Bio Inc., Shiga, Japan). Real-time PCR with a FAM-labeled probe for the target mRNA and a VIC-labeled probe for the housekeeping gene was performed using TaqMan Fast Advanced Master Mix (Applied Biosystems, Foster City, CA, USA) on a StepOne real-time PCR system (Applied Biosystems) according to the manufacturer’s protocol, and mRNA levels were measured as the relative ratio to β-actin mRNA. All predesigned PCR primers and TaqMan MGB probes were purchased from Applied Biosystems. The assay IDs of the probes used in this study were as follows: mouse Hmox1, Mm00516005_m1; mouse Gclc, Mm00802655_m1; mouse Slc7a11, Mm00442530_m1; mouse Actb, Mm00607939_s1.
Measurement of total glutathione
Male and female WT and Nrf2 KO mice were administered olanzapine (25 mg/10 mL/kg, i.p.) or solvent (10 mL/kg, i.p.) for 3 days, and the cortex and hypothalamus were collected 12 hr after the last dose. The brains were quickly frozen in liquid nitrogen, and stored at –80°C until the next step. Approximately 40 mg of frozen cortex was homogenized in 800 μL of phosphate buffered saline (PBS) and divided for protein quantification (300 μL) and total glutathione measurement (400 μL). Approximately 10 mg of frozen hypothalamus was homogenized in 200 μL of PBS and divided for protein quantification (25 μL) and total glutathione measurement (150 μL). Protein quantification was performed using the Takara BCA Protein Assay Kit (Takara Bio Inc.) and absorbance was measured at 562 nm using a SpectraMax i3 microplate reader (Molecular Devices, Sunnyvale, CA, USA). Total glutathione (reduced glutathione (GSH) + oxidized glutathione (GSSG)) was determined using the GSH/GSSG Ratio Detection Assay II (Fluorometric-Green) (ab205811, Abcam plc, Cambridge, UK) according to the manufacturer’s protocol. Fluorescence intensity was measured at Ex/Em = 490/520 nm by a SpectraMax i3 microplate reader using 384-well black plates (Thermo Fisher Scientific, Waltham, MA, USA). Total glutathione was normalized using the amount of protein.
Weight measurement, glucose tolerance test, and survival analysis during long-term olanzapine feeding
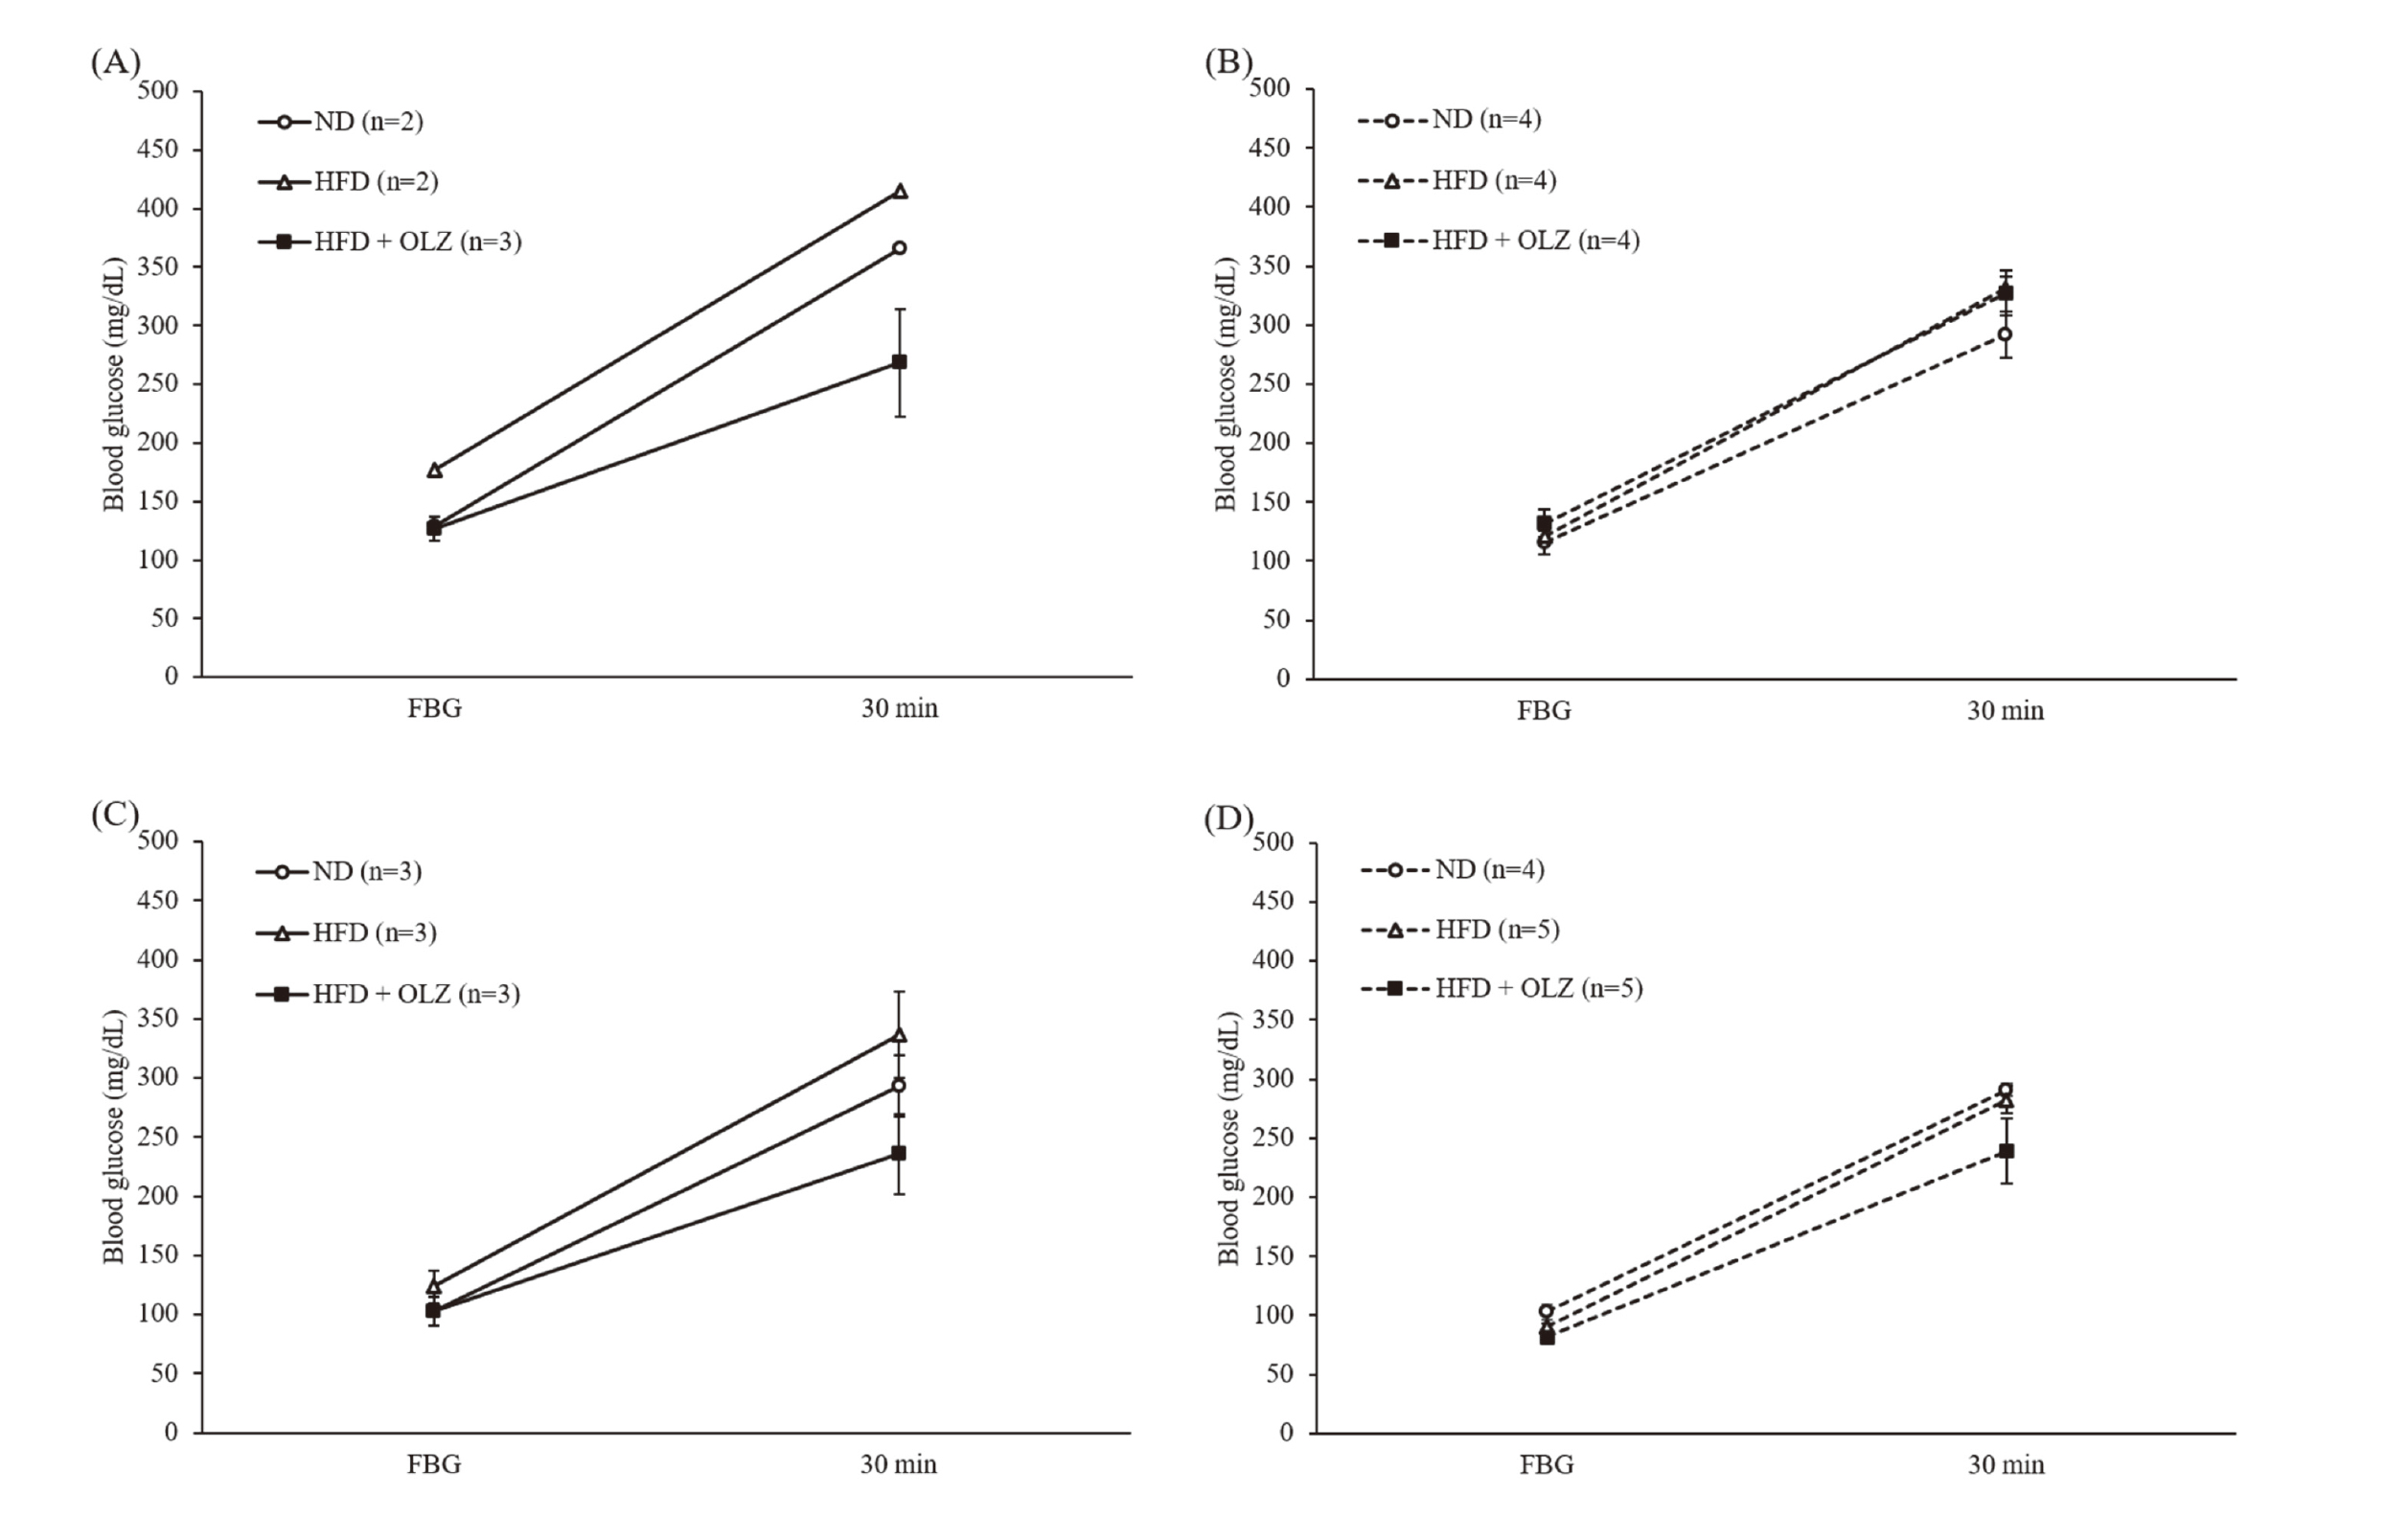
Male and female WT and Nrf2 KO mice were fed ND or HFD (60 kcal% fat) for 1 week for acclimation. Mice acclimated on ND served as a control group and were fed ND for 30 weeks. Mice acclimated on HFD were divided into an HFD group and HFD with 0.017% (w/w) olanzapine (HFD + OLZ) group for 30 weeks. In our preliminary study, the intake of ND and ND with OLZ was almost the same and approximately 3 g/day for both males and females, and the high-fat diet intake of male C57BL/6J mice has been reported to be approximately 2.7 g/day (Gourineni et al., 2012). In addition, the mice weighed approximately 20 g at the beginning of this study. Based on these facts, olanzapine at 0.017% was mixed with HFD so that the daily intake of olanzapine would be 25 mg/kg/day. According to the schedule shown in Fig. 1, body weight was monitored weekly and glucose tolerance testing was performed at 13 weeks. For glucose tolerance testing, mice were fasted for 16 hr and fasting blood glucose (FBG) levels were measured using a blood glucose meter (Medisafe Fit) (Terumo Corporation, Tokyo, Japan). The blood glucose level was measured 30 min after the administration of D-glucose (1.0 g/kg, i.p.). The survival time of mice during the feeding period was analyzed using a Kaplan-Meier survival curve.

Male and female WT mice, anesthetized with a combination of medetomidine (0.15 mg/kg, i.p.), midazolam (2 mg/kg, i.p.) and butorphanol (2.5 mg/kg, i.p.), were placed in a stereotaxic apparatus. A microdialysis probe (D-I-6-02: 0.22 mm outer diameter, 2 mm membrane length; Eicom Co., Ltd., Kyoto, Japan) was implanted into the striatum at the following coordinates; AP: + 0.5 mm, ML: + 1.7 mm relative to bregma and DV: − 4.4 mm from the skull. The probes were secured onto the skull using dental acrylic. The mice were allowed to recover for at least 18 hr before the experiment was begun. After the experiments, the mice were decapitated and brain tissue was removed to confirm that the probe had been embedded in the striatum. The probes were perfused at 2 μL/min with Ringer’s solution. One hour after the reflux, olanzapine (25 mg/10 mL/kg, i.p.) was administered and sample collection was initiated. The dialysate sample was collected in 10-min fractions. Samples were collected up to 24 hr after olanzapine administration. Samples collected 0.5, 1, 2, 4, 8 and 24 hr after olanzapine administration were subjected to liquid chromatography-mass spectrometry (LC-MS/MS) analysis directly.
Blood sampling for the measurement of olanzapine
From mice used for microdialysis, i.e., mice that administered a single dose of olanzapine (25 mg/kg/10 mL, i.p.), 30 μL of blood was collected from the tail vein at 0.5, 1, 2, 4, 8, and 24 hr after olanzapine administration using microhematocrit tubes (Fisher Scientific, Tokyo, Japan). After standing for 30 min, the blood was centrifuged for 10 min at 2,300 × g at 4°C and the serum was collected. The olanzapine in the serum was extracted according to the QuEChERS method. Five microliters of serum were added to 150 μL of water, 50 mg of Bond Elut QuEChERS, and 150 μL of acetonitrile containing 5 ng of diazepam as an internal standard and mixed well using a vortex mixer. The mixture was centrifuged for 10 min at 15,000 × g at room temperature. The supernatant was collected and subjected to LC-MS/MS analysis.
LC-MS/MS Analysis
LC-MS/MS was performed using a LC-40ADXR and LCMS-8045 (Shimadzu, Kyoto, Japan). Chromatographic separation was achieved on a Phenomenex Kinetex XB-C18 column (2.1 mm I.D. × 100 mm., 2.6 μm) with an equivalent Phenomenex Security Ultra C18 guard column (2.1 mm I.D.). The column temperature was set at 40°C. The injection volume was 5 μL. The samples were kept in an autosampler (Nexera SIL-40C XR) at 15°C. The mobile phases were (A) 10 mmol/L ammonium formate and 0.1% formic acid, and (B) methanol containing 10 mmol/L ammonium formate and 0.1% formic acid. The initial elute condition was set at 95% A, the condition was changed linearly to 5% A in 7.5 min, held for 2.5 min, then immediately back to 95% A, and held for 5 min. The flow rate was set at 0.3 mL/min. After ionization with electrospray ionization, the samples were analyzed in multiple reaction monitoring mode. Olanzapine was detected in positive mode. The flow rates of the nebulizer gas, the drying gas and the heating gas were set at 3 L/min, 10 L/min, and 10 L/min, respectively. Temperatures of the interface, the desolvation line and the heat block were set to 300°C, 250°C, and 400°C, respectively. The precursor ions of olanzapine and diazepam were m/z 313.15 and m/z 285.10, respectively. Product ions were set to m/z 256.20 and m/z 193.05, respectively. Collision energies were set to 24 V and 29 V, respectively.
Statistical analysis
Expression levels of Hmox1, Gclc, and Slc7a11 were analyzed by Student’s t-test with the Jonckheere-Terpstra trend test. Total glutathione, change of weight, blood glucose, and area under the drug concentration-time curve (AUC) of blood and brain extracellular fluid were analyzed by Student’s t-test. Survival analysis was performed by log-rank test. All statistical analyses were performed using JMP Pro 16.0 (SAS, Cary, NC, USA). P < 0.05 was considered to indicate statistical significance.
RESULTS AND DISCUSSION
Effect of olanzapine on gene expression of antioxidant proteins in the brain
In this study, we employed an olanzapine dose of 25 mg/kg, because our preliminary study used doses ranging from 5 to 50 mg/kg, and gene expression levels of Hmox1, encoding HO-1 increased the most in the 25 mg/kg dose group in the hypothalamus (data not shown). Gene expression levels of Hmox1 were significantly increased in the hypothalamus of males and females 12 hr after olanzapine administration (Fig. 2A). In the cortex, gene expression levels of Hmox1 were significantly increased in males and females 6 hr after olanzapine administration and remained increased at 12 hr (Fig. 2B). Gene expression levels of Gclc, encoding GCS, were significantly increased in the hypothalamus of males and females 12 hr after olanzapine administration (Fig. 2C), but in the cortex in males only (Fig. 2D). In contrast, the expression of Slc7a11, encoding xCT, was decreased in a time-dependent manner in the hypothalamus and cortex of males and females treated with olanzapine (Fig. 2E, F).

HO-1, an enzyme responsible for heme degradation, is a sensitive marker of oxidative stress because it is rapidly induced under oxidative stress conditions (Abraham and Kappas, 2008; Sassa, 2006). GCS, a glutathione synthase with antioxidant properties, and xCT, an amino acid transporter that contributes to the intracellular uptake of cystine, a precursor of GSH, have also been reported to be induced by oxidative stress (Franklin et al., 2009; Siow et al., 1998). All these gene expressions are under the control of Nrf2; therefore, Nrf2 activation involves the induction of these genes. Based on these facts, we expected that HO-1, GCS, and xCT would all be elevated in the hypothalamus of olanzapine-treated mice because the drug causes oxidative stress in a tissue-specific manner. However, under the conditions of this experiment, although some oxidative stress markers such as HO-1 and GCS were increased, xCT was decreased. Furthermore, no evidence was obtained that the induced gene expression occurred in a hypothalamic-specific manner. Thus, our results suggest that although a single dose of olanzapine may produce oxidative stress in the brain, it is not a hypothalamus-specific response.
Effect of olanzapine on total glutathione levels in the brain
In general, oxidative stress activates Nrf2 and glutathione synthesis, resulting in an increase in the reduced form of GSH. Therefore, to further clarify whether olanzapine induces oxidative stress, we used Nrf2 KO mice, an animal model used to determine the involvement of Nrf2.
The total glutathione level in the cortex of male WT mice treated with olanzapine for 3 days was significantly increased, but no change was observed in female WT mice (Fig. 3). In Nrf2 KO mice, no change in total glutathione level was observed after the administration of olanzapine in males and females (Fig. 3). A similar tendency was observed in the hypothalamus (data not shown), but it was difficult to quantify the total glutathione content because of the small tissue size.

These results obtained from male and female WT mice revealed a sex difference in the responsiveness of glutathione contents to olanzapine. In addition, the results using Nrf2 KO mice suggested that the Keap1-Nrf2 system was involved in the increase in total glutathione levels induced by olanzapine in male mice. Under the conditions of this experiment, neither the induction of oxidative stress markers nor involvement of the Keap1-Nrf2 system was observed in olanzapine-treated females. Shertzer et al. (2010) reported that a low dose of olanzapine (3 mg/kg) and an HFD for 10 weeks activated NADPH oxidase (NOX) in the white adipocytes (WAT) of female C57BL/6J mice and increased the production of ROS. It was also reported that female diabetic rats were more resistant to oxidative stress than males (Diaz et al., 2019). These results suggested that the biological reaction of females to olanzapine may differ between the acute phase and the chronic phase in experimental animal.
Effects of long-term olanzapine feeding on body weight, glucose tolerance, and longevity
Next, experiments were conducted to examine the effects of the chronic administration of olanzapine on the development of metabolic side effects and the Keap1-Nrf2 system, with particular attention to sex differences. The occurrence of obesity and type 2 diabetes in humans, which are side effects of olanzapine, is not only due to olanzapine, but also to dietary habits. Therefore, the following experiments were conducted using an olanzapine-containing HFD.
Male and female WT and Nrf2 KO mice were fed ND, HFD, or HFD containing 0.017% olanzapine (HFD + OLZ), a concentration calculated to be equivalent to a dose of 25 mg/kg/day, and body weight changes were measured over time. Because the female HFD + OLZ group died at week 14 of feeding, changes in body weight up to 13 weeks, when all animals were alive, are shown in Fig. 4. Due to the small number of WT mice born at the same time as the Nrf2 KO mice used in this study, there were two male WT mice each in the ND and HFD groups. Therefore, statistical analysis could not be performed, but there was little variation in body weight within groups. Although no statistically significant differences were identified, the results suggested that the HFD group gained more weight than the ND group, and the HFD + OLZ group lost more weight than the ND group. These trends persisted until 30 weeks of feeding (data not shown). The HFD + OLZ group of male Nrf2 KO mice had a significantly lower body weight than the HFD group at weeks 1–7 and 9 and the ND group at weeks 1–8 after feeding (Fig. 4B). However, in female WT mice, each group showed similar body weights until 9 weeks after feeding (Fig. 4C). After 10 weeks, the HFD group gained significantly more weight than the ND group, and the HFD + OLZ group showed a similar trend in weight gain as the HFD group (Fig. 4C). In female Nrf2 KO mice, the body weight of each group remained similar until 13 weeks after feeding (Fig. 4D). The results of the glucose tolerance test conducted at 13 weeks showed no significant differences in fasting blood glucose and post-glucose tolerance in all groups (Fig. 5).

Olanzapine-induced weight gain and impaired glucose tolerance were reported to be stronger in females (Lord et al., 2017; Davoodi et al., 2009; Choi et al., 2007). Under the conditions of this experiment, no weight gain or impaired glucose tolerance was observed in male and female mice, although weight loss was observed in male Nrf2 KO mice (Figs. 4, 5). In this study, olanzapine was fed at 4–10 times higher concentration than previously reported to facilitate the assessment of olanzapine-induced toxicity. Therefore, the obtained results in this study differ from those previously reported possibly because of differences in dosage. However, because there was a sex difference in body weight change even under the conditions of this study, it is clear that there is also a sex difference in the effects of chronic olanzapine administration.
After 30 weeks of feeding with HFD + OLZ, no death occurred in male mice (data not shown). In female WT mice, all of the HFD group survived during the observation period, but in the HFD + OLZ group, death was observed starting from 15 weeks after feeding (Fig. 6A). The median survival time of the HFD + OLZ group of female WT mice was 103 days. All female Nrf2 KO mice in the HFD group survived, but in the HFD + OLZ group, death was observed starting from 14 weeks after feeding (Fig. 6B). The median survival time of female Nrf2 KO mice in the HFD + OLZ group was 116 days, which was significantly shorter than that of the HFD controls. However, no obvious differences were observed in the survival time between female WT and Nrf2 KO mice in the HFD + OLZ groups. In addition, blood biochemistry tests were performed at week 30 of treatment to evaluate hepatic, pancreatic, and renal function and lipid-related parameters (data not shown). However, no tests were found to be worse in the HFD + OLZ group compared to the HFD group. Results from these experiments do not provide clear evidence that olanzapine induces metabolic side effects and hypothalamic-specific oxidative stress. Nevertheless, short-term olanzapine administration showed different behavior for each oxidative stress marker. In addition, the results of glutathione and long-term olanzapine feeding showed that glutathione levels and change in weight were unchanged in female WT and Nrf2 KO mice, suggesting that the Keap1-Nrf2 system is less involved in females than in males. This is supported by the fact that similar susceptibility to olanzapine was observed in female WT and Nrf2 KO mice. Thus, the hypothesis that females are more susceptible to the effects of oxidative stress in the hypothalamus and induce metabolic side effects should be rejected. However, this study revealed that chronic olanzapine administration at a high dose may produce significant life-threatening toxicity in female mice.

Although various enzymes are thought to be involved in olanzapine metabolism, the main metabolite in human plasma and urine is olanzapine glucuronide (Kassahun et al., 1997), which is produced by UDP-glucuronyl transferase (UGT). Although the olanzapine metabolic pathway in mice is poorly understood, sex differences were reported for UGT expression in C57BL/6J mice (Buckley and Klaassen, 2007). Therefore, we considered the possibility that olanzapine metabolic capacity might be affected as the cause of the deaths observed in females only, and decided to measure blood levels of olanzapine after administration. In addition, concentrations in the extracellular fluid of the brain were also measured to examine whether life-threatening toxicity was associated with the blood-to-brain transfer of olanzapine.
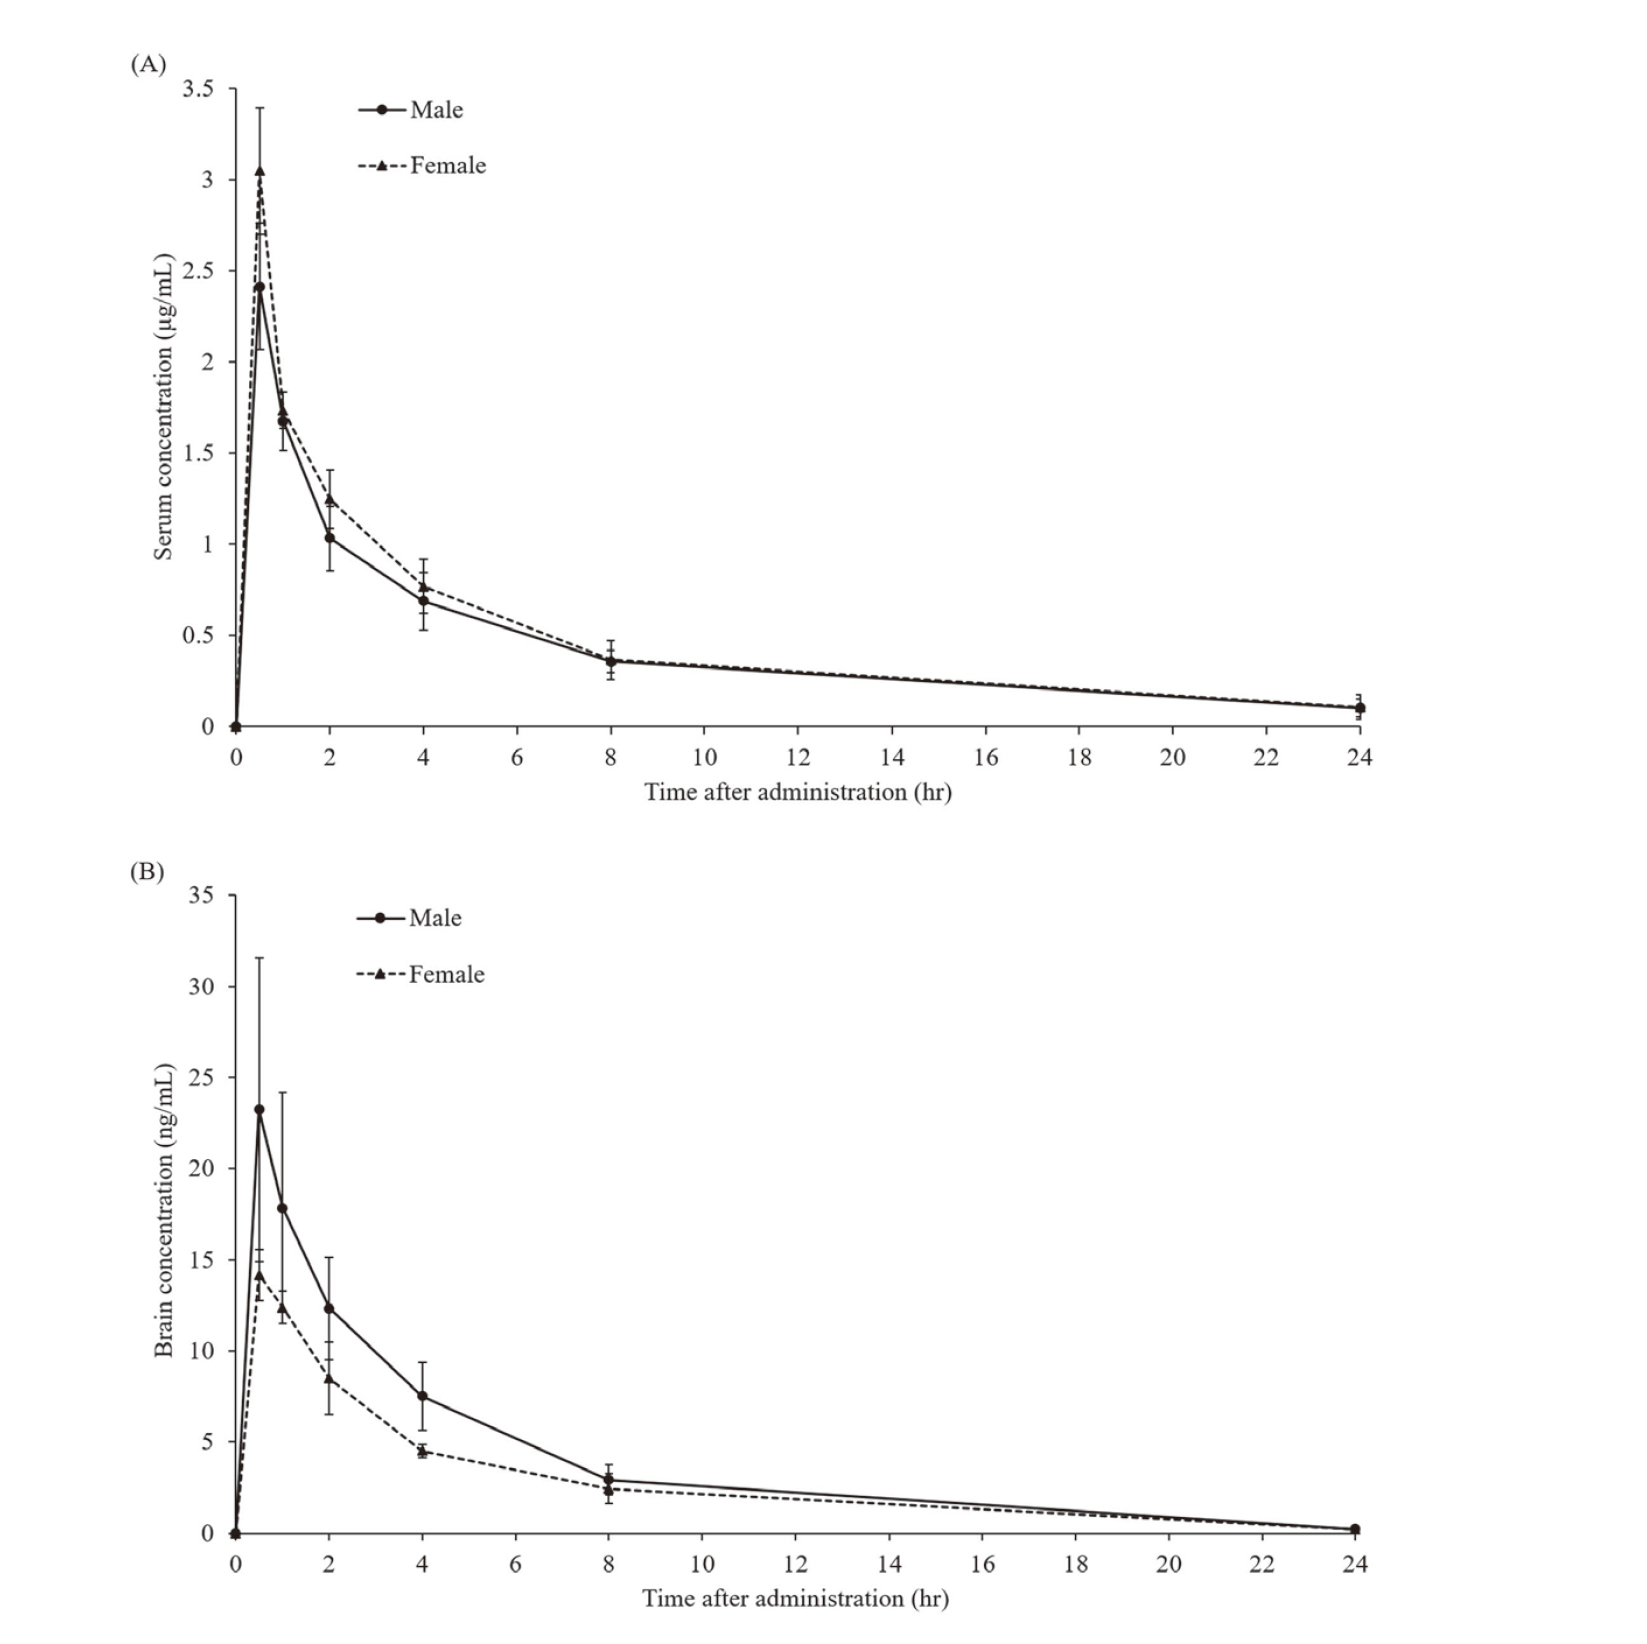
The serum Tmax of olanzapine was 0.5 hr in male and female mice, and the serum Cmax was 2.41 ± 0.35 μg/mL in male and 3.05 ± 0.35 μg/mL in female mice (Fig. 7A). The serum AUC0-24 was 10.5 ± 1.4 μg hr/mL in male and 11.5 ± 2.1 μg hr/mL in female mice (Fig. 7A). The Tmax of olanzapine in the extracellular brain fluid was 0.5 hr in male and female mice, and the extracellular brain fluid Cmax was 23.2 ± 8.3 ng/mL in male and 14.2 ± 1.4 ng/mL in female mice (Fig. 7B). The extracellular brain fluid AUC0-24 was 96.9 ± 18.7 ng hr/mL in male and 68.7 ± 5.9 ng hr/mL in female mice (Fig. 7B). There were no significant differences in any of these parameters between male and female mice. Since these results are based on a single administration, differences in metabolic capacity during long-term administration may not have been adequately evaluated. On the other hand, although no sex difference was observed in olanzapine concentrations of serum and extracellular fluid of the brain after a single administration, it was observed in responses of oxidative stress markers and glutathione contents (Fig. 2, 3). Thus, the sex differences observed in weight change and survival are also likely not explained by serum concentrations of olanzapine or blood-brain transfer.
Cardiac death was reported to be approximately 2.3 times higher in those taking atypical antipsychotics compared to nonusers, and was proportional to drug dosage (Ray et al., 2009). It has also been reported that women taking olanzapine had an extended QTc interval, but men did not have a changed QTc interval (Suzuki et al., 2014). Although cardiotoxicity was not evaluated in this study, these reports suggest that cardiotoxicity may explain the deaths of female mice, and requires further investigation.
In conclusion, in this study, sex differences were observed in vivo in response to a high dose of olanzapine. Furthermore, the Nrf2-Keap1 system was active in male mice during the acute phase, but not in female mice. It was also shown that chronic administration was more likely to cause fatal toxicity in female mice than male mice.
Conflict of interest
The authors declare that there is no conflict of interest.
REFERENCES
- Abraham, N.G. and Kappas, A. (2008): Pharmacological and clinical aspects of heme oxygenase. Pharmacol. Rev., 60, 79-127.
- Albaugh, V.L., Henry, C.R., Bello, N.T., Hajnal, A., Lynch, S.L., Halle, B. and Lynch, C.J. (2006): Hormonal and metabolic effects of olanzapine and clozapine related to body weight in rodents. Obesity (Silver Spring), 14, 36-51.
- Buckley, D.B. and Klaassen, C.D. (2007): Tissue- and gender-specific mRNA expression of UDP-glucuronosyltransferases (UGTs) in mice. Drug Metab. Dispos., 35, 121-127.
- Bymaster, F.P., Calligaro, D.O., Falcone, J.F., Marsh, R.D., Moore, N.A., Tye, N.C., Seeman, P. and Wong, D.T. (1996): Radioreceptor binding profile of the atypical antipsychotic olanzapine. Neuropsychopharmacology, 14, 87-96.
- Choi, S., DiSilvio, B., Unangst, J. and Fernstrom, J.D. (2007): Effect of chronic infusion of olanzapine and clozapine on food intake and body weight gain in male and female rats. Life Sci., 81, 1024-1030.
- Davoodi, N., Kalinichev, M., Korneev, S.A. and Clifton, P.G. (2009): Hyperphagia and increased meal size are responsible for weight gain in rats treated sub-chronically with olanzapine. Psychopharmacology (Berl.), 203, 693-702.
- Diaz, A., Lopez-Grueso, R., Gambini, J., Monleon, D., Mas-Bargues, C., Abdelaziz, K.M., Vina, J. and Borras, C. (2019): Sex differences in age-associated type 2 diabetes in rats—role of estrogens and oxidative stress. Oxid. Med. Cell. Longev., 2019, 6734836.
- Ebenbichler, C.F., Laimer, M., Eder, U., Mangweth, B., Weiss, E., Hofer, A., Hummer, M., Kemmler, G., Lechleitner, M., Patsch, J.R. and Fleischhacker, W.W. (2003): Olanzapine induces insulin resistance: results from a prospective study. J. Clin. Psychiatry, 64, 1436-1439.
- Franklin, C.C., Backos, D.S., Mohar, I., White, C.C., Forman, H.J. and Kavanagh, T.J. (2009): Structure, function, and post-translational regulation of the catalytic and modifier subunits of glutamate cysteine ligase. Mol. Aspects Med., 30, 86-98.
- Gardner, D.M., Baldessarini, R.J. and Waraich, P. (2005): Modern antipsychotic drugs: a critical overview. CMAJ, 172, 1703-1711.
- Go, A.S., Mozaffarian, D., Roger, V.L., Benjamin, E.J., Berry, J.D., Borden, W.B., Bravata, D.M., Dai, S., Ford, E.S., Fox, C.S., Franco, S., Fullerton, H.J., Gillespie, C., Hailpern, S.M., Heit, J.A., Howard, V.J., Huffman, M.D., Kissela, B.M., Kittner, S.J., Lackland, D.T., Lichtman, J.H., Lisabeth, L.D., Magid, D., Marcus, G.M., Marelli, A., Matchar, D.B., McGuire, D.K., Mohler, E.R., Moy, C.S., Mussolino, M.E., Nichol, G., Paynter, N.P., Schreiner, P.J., Sorlie, P.D., Stein, J., Turan, T.N., Virani, S.S., Wong, N.D., Woo, D. and Turner, M.B. (2013): Heart disease and stroke statistics-2013 update: A report from the american heart association. Circulation, 127, 6-245.
- Gourineni, V., Shay, N.F., Chung, S., Sandhu, A.K. and Gu, L. (2012): Muscadine grape (Vitis rotundifolia) and wine phytochemicals prevented obesity-associated metabolic complications in C57BL/6J mice. J. Agric. Food Chem., 60, 7674-7681.
- Haupt, D.W. and Newcomer, J.W. (2001): Hyperglycemia and antipsychotic medications. J. Clin. Psychiatry, 62 (Suppl 27), 15-26, discussion, 40-41.
- Itoh, K., Chiba, T., Takahashi, S., Ishii, T., Igarashi, K., Katoh, Y., Oyake, T., Hayashi, N., Satoh, K., Hatayama, I., Yamamoto, M. and Nabeshima, Y. (1997): An Nrf2/small Maf heterodimer mediates the induction of phase II detoxifying enzyme genes through antioxidant response elements. Biochem. Biophys. Res. Commun., 236, 313-322.
- Kassahun, K., Mattiuz, E., Nyhart, E. Jr., Obermeyer, B., Gillespie, T., Murphy, A., Goodwin, R.M., Tupper, D., Callaghan, J.T. and Lemberger, L. (1997): Disposition and biotransformation of the antipsychotic agent olanzapine in humans. Drug Metab. Dispos., 25, 81-93.
- Kluge, M., Schuld, A., Himmerich, H., Dalal, M., Schacht, A., Wehmeier, P.M., Hinze-Selch, D., Kraus, T., Dittmann, R.W. and Pollmächer, T. (2007): Clozapine and olanzapine are associated with food craving and binge eating: results from a randomized double-blind study. J. Clin. Psychopharmacol., 27, 662-666.
- Li, P., Snyder, G.L. and Vanover, K.E. (2016): Dopamine targeting drugs for the treatment of schizophrenia: Past, present and future. Curr. Top. Med. Chem., 16, 3385-3403.
- Lord, C.C., Wyler, S.C., Wan, R., Castorena, C.M., Ahmed, N., Mathew, D., Lee, S., Liu, C. and Elmquist, J.K. (2017): The atypical antipsychotic olanzapine causes weight gain by targeting serotonin receptor 2C. J. Clin. Invest., 127, 3402-3406.
- Low Wang, C.C., Hess, C.N., Hiatt, W.R. and Goldfine, A.B. (2016): Atherosclerotic cardiovascular disease and heart failure in type 2 diabetes – mechanisms, management, and clinical considerations. Circulation, 133, 2459-2502.
- Ninagawa, S., Tada, S., Okumura, M., Inoguchi, K., Kinoshita, M., Kanemura, S., Imami, K., Umezawa, H., Ishikawa, T., Mackin, R.B., Torii, S., Ishihama, Y., Inaba, K., Anazawa, T., Nagamine, T. and Mori, K. (2020): Antipsychotic olanzapine-induced misfolding of proinsulin in the endoplasmic reticulum accounts for atypical development of diabetes. eLife, 9, 1-26.
- Pouzet, B., Mow, T., Kreilgaard, M. and Velschow, S. (2003): Chronic treatment with antipsychotics in rats as a model for antipsychotic-induced weight gain in human. Pharmacol. Biochem. Behav., 75, 133-140.
- Sasaki, H., Sato, H., Kuriyama-Matsumura, K., Sato, K., Maebara, K., Wang, H., Tamba, M., Itoh, K., Yamamoto, M. and Bannai, S. (2002): Electrophile response element-mediated induction of the cystine/glutamate exchange transporter gene expression. J. Biol. Chem., 277, 44765-44771.
- Sassa, S. (2006): Biological implications of heme metabolism. J. Clin. Biochem. Nutr., 38, 138-155.
- Seeman, M.V. (2020): Men and women respond differently to antipsychotic drugs. Neuropharmacology, 163, 107631.
- Shertzer, H.G., Kendig, E.L., Nasrallah, H.A., Johansson, E. and Genter, M.B. (2010): Protection from olanzapine-induced metabolic toxicity in mice by acetaminophen and tetrahydroindenoindole. Int. J. Obes., 34, 970-979.
- Siow, R.C., Sato, H., Leake, D.S., Pearson, J.D., Bannai, S. and Mann, G.E. (1998): Vitamin C protects human arterial smooth muscle cells against atherogenic lipoproteins: effects of antioxidant vitamins C and E on oxidized LDL-induced adaptive increases in cystine transport and glutathione. Arterioscler. Thromb. Vasc. Biol., 18, 1662-1670.
- Solis, W.A., Dalton, T.P., Dieter, M.Z., Freshwater, S., Harrer, J.M., He, L., Shertzer, H.G. and Nebert, D.W. (2002): Glutamate-cysteine ligase modifier subunit: mouse Gclm gene structure and regulation by agents that cause oxidative stress. Biochem. Pharmacol., 63, 1739-1754.
- Suzuki, Y., Sugai, T., Ono, S., Sawamura, K., Fukui, N., Watanabe, J., Tsuneyama, N., Saito, M. and Someya, T. (2014): Changes in PR and QTc intervals after switching from olanzapine to risperidone in patients with stable schizophrenia. Psychiatry Clin. Neurosci., 68, 353-356.
- Taylor, D.M. and McAskill, R. (2000): Atypical antipsychotics and weight gain--a systematic review. Acta Psychiatr. Scand., 101, 416-432.
- Ray, W.A., Chung, C.P., Murray, K.T., Hall, K. and Stein, C.M. (2009): Atypical antipsychotic drugs and the risk of sudden cardiac death. N. Engl. J. Med., 360, 225-235.
- Wirshing, D.A., Wirshing, W.C., Kysar, L., Berisford, M.A., Goldstein, D., Pashdag, J., Mintz, J. and Marder, S.R. (1999): Novel antipsychotics: comparison of weight gain liabilities. J. Clin. Psychiatry, 60, 358-363.
- Yagishita, Y., Uruno, A., Fukutomi, T., Saito, R., Saigusa, D., Pi, J., Fukamizu, A., Sugiyama, F., Takahashi, S. and Yamamoto, M. (2017): Nrf2 improves leptin and insulin resistance provoked by hypothalamic oxidative stress. Cell Rep., 18, 2030-2044.