Abstract
Particulate matter (PM) is among the major air pollutants suspended in the atmosphere. PM2.5 has a particle size of 2.5 µm; it is known to cause inflammation, especially in the respiratory tract and skin. Since the skin acts a primary barrier against harmful environmental substances that may enter the body, it is highly exposed to PM2.5 present in the environment. However, the adverse health effects of PM2.5 exposure on human skin have not been accurately examined due to the lack of a system that exposes human epidermal tissue to the actual environmental concentration of PM2.5. In this study, we developed an air–liquid interface exposure system for exposing cultured human 3D epidermis and cornea to PM2.5 collected through cyclonic separation. PM2.5 suspension was nebulized in an acrylic chamber, and the resulting mist was pumped through a diffusion dryer into a glass exposure chamber. A particle counter was connected to the exposure chamber to continuously measure the spatial mass concentration of PM. Human 3D epidermis was cultured in the exposure chamber. Exposure of the human 3D epidermis to PM aerosol increased interleukin-8 release into the media around 50 µg/m3. Mass concentrations above 100 µg/m3 caused cell death. Furthermore, a human corneal model showed similar responses against PM2.5 exposure as 3D epidermis. The air–liquid interface exposure system developed in this study is considered useful for evaluating the health effects induced by environmental PM2.5 and can be used as an alternative to experiments involving actual human or animals.
INTRODUCTION
Air pollutants cause serious health problems. According to the World Health Organization, ozone, nitrogen dioxide, sulfur dioxide, and particulate matter (PM) are the major air pollutants. PM2.5 has an aerodynamic diameter less than 2.5 μm. Owing to its small particle size, PM2.5 can easily penetrate the deep part of the lungs, causing inflammation. Several epidemiological studies have shown that PM2.5 exposure exacerbates respiratory diseases, such as bronchitis, bronchial asthma, and lung cancer (Dockery et al., 1993; Ghosh et al., 2016; Mirabelli et al., 2016).
As the interface between the body and the surrounding atmosphere, the skin is the primary organ exposed to ambient air pollution. Epidemiological evidence has shown that PM2.5 causes skin inflammation and worsens atopic dermatitis, psoriasis, and rosacea (Park et al., 2022). Most studies have used monolayer keratinocytes for the toxicological evaluation of pollutants. When immortalized non-tumorigenic human keratinocytes (HaCaT) were exposed to PM2.5, the level of intracellular reactive oxygen species increased, followed by endoplasmic reticulum stress and inflammasome activation, eventually leading to inflammation (Piao et al., 2018; Dong et al., 2020). However, monolayer keratinocytes such as HaCaT do not have a skin barrier function; hence, it may not be possible to accurately assess the effects of PM2.5 on skin. To address this issue, a cultured human three-dimensional (3D) epidermis model was developed and has been commercially used. Liao et al. reported that the cholesterol levels of a 3D epidermis model increased after treating it with PM2.5 (Liao et al., 2019). It was also shown that PM2.5 induced chemokine release, followed by neutrophil activation, which can cause an unregulated inflammatory reaction, in a cultured human 3D epidermis model (Kono et al., 2023).
In our previous study, we collected PM2.5 through cyclonic separation and added the PM2.5 suspension to the side of the stratum corneum in the 3D epidermis model and then examined the effects of PM2.5 on the 3D epidermis model (Kono et al., 2023; Kono et al., 2022). However, it is critical to evaluate the toxicity and reaction of the skin to PM2.5 using an exposure system that matches the actual exposure conditions of the skin to PM2.5 suspended in the atmosphere; therefore, the air–liquid interface exposure system is better adapted to the human epidermal model exposed to PM2.5. The air–liquid interface exposure system has been developed to mimic the exposure of the respiratory tract to a single compound such as a nanomaterial and metal particle. Air–liquid interface exposure systems that may be applicable to PM2.5 collected by cyclones have been reported. Lenz et al. (2009) used a nebulizer to expose a cell culture plate to a suspension of Au, ZnO, and carbon black nanoparticles. However, the mist generated by the nebulizer in this method is exposed, which differs from that of aerosol exposure. Loret et al. (2016) dried the mist generated by a nebulizer with a dryer, set the flow for each well of the culture plate, and exposed cultured human alveolar epithelial cell line A549 to the resulting aerosol. However, the particle mass concentration in the exposure system was 7 mg/m3 or more, which is extremely high compared with the average PM2.5 concentration in Japan (approximately 10 µg/m3) (Kawashima and Haneishi, 2012; Yorifuji et al., 2016) and the Japanese environmental standard (35 µg/m3 or less per day, referred to the Environmental Quality Standards for the PM2.5 from the Ministry of the Environment: https://www.env.go.jp/en/air/aq/aq.html). Currently, there is no air–liquid interface exposure system that can expose human epidermal cells to PM2.5 collected by cyclones, whose concentration matches that in the actual environment.
The aim of this study was to construct a novel air–liquid interface exposure system that can expose cultured human 3D epidermis to the collected PM2.5 as an aerosol. Then, we challenged a human corneal model. Through cyclone technology, PM2.5 was collected from the atmosphere in powdered form, enabling exposure experiments using PM2.5, with known concentrations of its components (Ishihara et al., 2022). In addition, by installing cyclones in various locations and collecting PM2.5 throughout the year, it is possible to investigate the seasonality and regionality of the health effects of PM2.5 (Onishi et al., 2018). Therefore, a novel air–liquid interface exposure system that exposes human cell lines to PM2.5 collected in a cyclone will enable the investigation of the effects of PM2.5 on the skin, lungs, and eyes, reflecting the actual environmental exposure conditions of these organs to PM2.5.
MATERIALS AND METHODS
Collection and analysis of PM2.5
PM2.5 was collected in Yokohama, Japan in winter 2021-2022 (Okuda et al., 2015). PM2.5 was separated using an impactor before putting it into a cyclone device. The cyclone device imparted a centrifugal force on the gas stream within a conical chamber and created a vortex inside the cyclone body.
Water-soluble ions in PM2.5 collected at Yokohama, Japan were measured by ion chromatography according to our previous report (Kurihara et al., 2022). Metal contents in PM2.5 were measured by IDEA Consultants, Inc. (Tokyo, Japan) using inductively coupled plasma‒mass spectrometry. PAHs in PM2.5 were determined using GC‒MS (7890A/5957C, Agilent, Palo Alto, CA, USA) according to our previous report (Tanaka et al., 2023). Endotoxin levels in the PM2.5 were measured using an Endospecy ES-50M set (Seikagaku Co., Tokyo, Japan) according to the manufacturer’s protocol. A control standard endotoxin derived from E. coli O113 (Seikagaku Co., Tokyo, Japan) was used as a standard.
Air–liquid interface exposure system
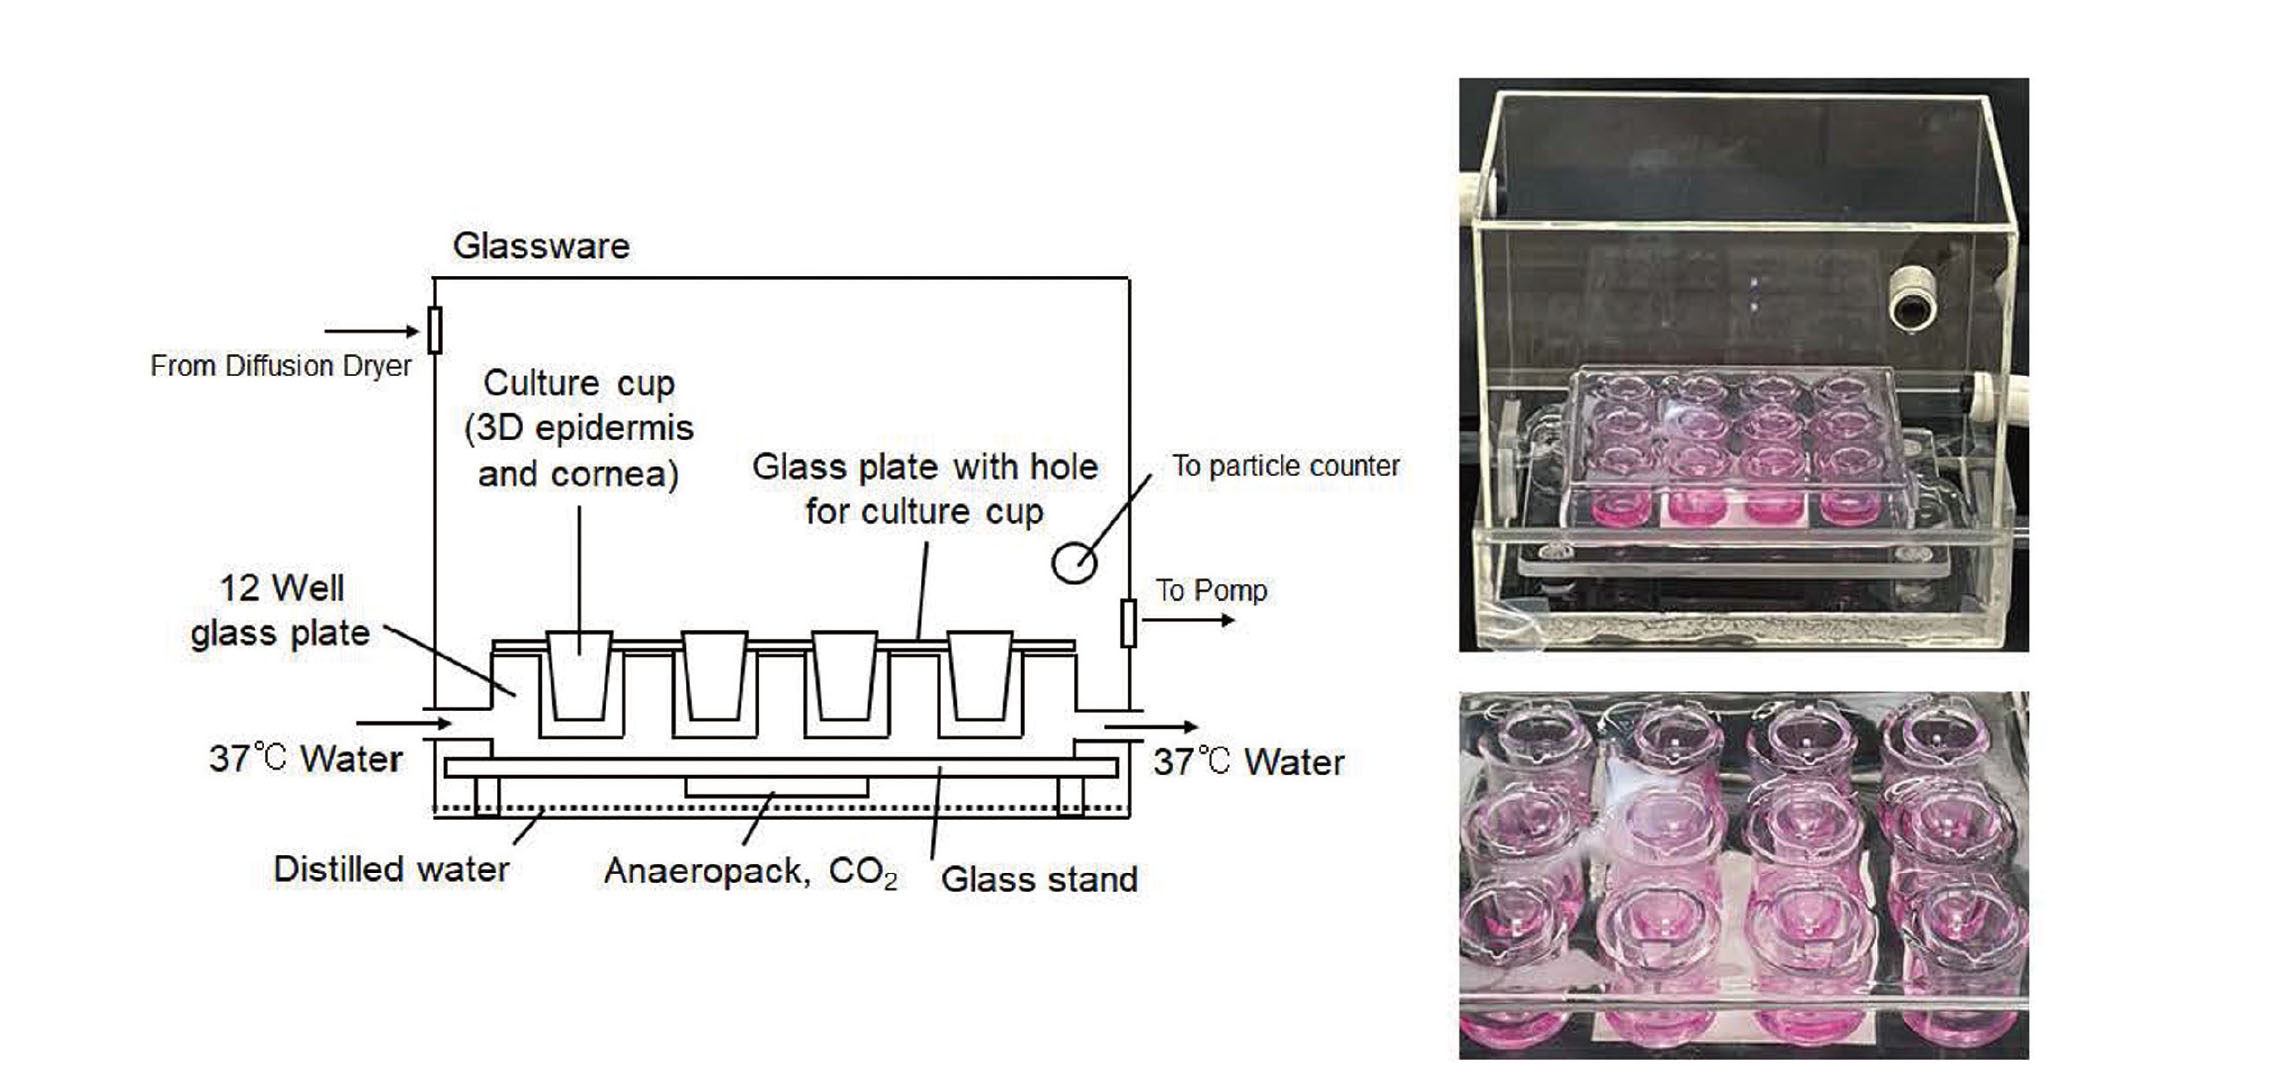
The overall air–liquid interface exposure system is illustrated in Fig. 1. PM2.5 was added to distilled water and sonicated to prepare PM2.5 suspensions with various concentrations. The PM2.5 suspension was added to the nebulizer head, and the delivery cycle of the nebulization controller (NEB-CTRL18910; Emka Technologies, Paris, France) was set to 5%. The PM2.5 suspension was injected into an acrylic chamber (150 × 100 × 150 mm) as a mist. A diffusion dryer was connected between the acrylic chamber and the exposure chamber (150 × 100 × 150 mm). A conductive silicon tube was used to connect the apparatus through which PM2.5 passed. The pump (MP-W5P; Sibata Scientific Technology, Tokyo, Japan) was operated at a rate of 4 L/min to deliver the nebulized mist into the exposure chamber after drying it with the diffusion dryer. A particle counter (Model3889; KANOMAX, Osaka, Japan) was connected to the exposure chamber to monitor the PM mass concentration in the chamber.

A schematic diagram of the exposure chamber is shown in Fig. 2. A 12-well glass plate was placed in the exposure chamber and water at 37°C was circulated inside the 12-well plate using a chiller (Neslab RTE7; Thermo Fisher Scientific, Waltham, MA, USA). A flat glass plate for fixing the culture cup was placed on the 12-well plate to block the aerosol from entering the media directly. The bottom of the exposure chamber was filled with distilled water. Anaeropack CO2 (Mitsubishi Gas Chemical Company, Tokyo, Japan) was pasted on the back of the glass stand where the plate was placed. The culture medium was added to the 12-well plate. The 3D epidermis model in the culture cup was fixed on the 12-well plate using the flat glass plate; afterwards, the exposure experiment was initiated.
Calculation of PM mass concentration
A particle counter (Model3889; KANOMAX, Osaka, Japan) was used to count the number of particles with the following diameters: 0.3–0.5 µm, 0.5–1 µm, 1–3 µm, 3–5 µm, and 5–10 µm. The entire volume (VE) of the counted particles was calculated using the geometric mean of particle diameter by approximating all particle shapes as spheres:
VE (μm3) = 4π {(N0.3-0.5)⸱(D0.3-0.5) 3 + (N0.5-1)⸱(D0.5-1) 3 + (N1-3)⸱(D1-3) 3 + (N3-5)⸱(D3-5) 3+ (N5-10)⸱(D5-10) 3}/3
where Np-q is the number of particles with a diameter from p μm to q μm and Dx-y is the geometric mean of x and y.
The particle counter was used to count the number of particles per 0.283 L of air. The density of urban PM2.5 was reported to be 1.60 g/cm3 (Pitz et al., 2008). Therefore, the mass concentration (M) of PM in the chamber was calculated using the equation below.
M (μg/m3) = (1.60 VE/0.283)⸱1000
Human 3D epidermis and corneal tissue models
A reconstructed 3D human epidermis model (LabCyte EPI-MODEL 24) composed of normal human epidermal keratinocytes in a multilayered structure and a reconstructed human corneal epithelial tissue produced using normal human corneal epithelial cells (LabCyte CORNEA-MODEL) were procured from Japan Tissue Engineering Corporation (Aichi, Japan) and maintained according to the instructions of the manufacturer.
Assay for cell viability
Cell viability was measured using a Lactate Assay Kit-WST (Dojindo Laboratories, Kumamoto, Japan), according to the instructions of the manufacturer. The 3D epidermis model treated with 0.1% Triton X-100 was used as the control to induce 100% cell death.
Determination of interleukin-8 (IL-8) concentrations in the media
The collected conditioned media was stored at −80°C before use. The IL-8 concentration in the media was determined using a LEGEND MAX™ Human IL-8 ELISA Kit (BioLegend, San Diego, CA, USA), according to the instructions of the manufacturer.
Statistical analysis
All data were analyzed using GraphPad Prism 9 (GraphPad Software, San Diego, CA, USA). One-way analysis of variance with Dunnett’s corrected multiple comparison test was used to determine significant differences between the means of two or more independent groups. Statistical significance was set at p < 0.05. Error bars were calculated using standard deviation.
RESULTS AND DISCUSSION
Preparation of air–liquid interface exposure system
The nebulizer head used in this study (Fig. 1) atomizes the upper suspension below through the mesh part of the element, and the size of the mist generated is 4–6 µm. Therefore, it is suitable for nebulizing PM2.5. The PM2.5 suspension was nebulized, with the delivery cycle of the nebulizer controller set to 5%. The amount of the suspension consumed was approximately 3 mL/hr. The mist generated within the acrylic chamber was drawn by a pump (rate: 4 L/min) into the diffusion dryer and then entered the glass exposure chamber as aerosol after the water had dried. A particle counter was attached to the exposure chamber to measure the PM concentration in the chamber.
The lower part of the exposure chamber was filled with distilled water to maintain high humidity in the chamber, and the lower surface of the stand was pasted with Anaeropack CO2 to increase the CO2 concentration in the chamber (Fig. 2). A 12-well plate was kept at 37°C by circulating water in it, and the interior air of the chamber was kept at 25°C. A flat glass plate with a culture cup was placed on the 12-well plate so that the PM aerosol in the chamber would not enter the culture medium directly. In this chamber, the stratum corneum side of the 3D epidermis was exposed to PM aerosol.
Exposure of PM2.5 collected by cyclonic separation
PM2.5 collected by a cyclone device at Yokohama, Japan contained several kinds of soluble ions, metals and PAHs (Table S1, S2 and S3). Endotoxin concentration was 4.8 IU/mg PM2.5. When distilled water was added to the nebulizer head, the spatial concentration in the exposure chamber was 4.6 ± 0.5 μg/m3 (Fig. 3A). As the atmospheric PM2.5 concentration measured on the day when the experiments were conducted was 13.4 ± 0.7 μg/m3, it is possible that environmental PM2.5 contaminated the system. Moreover, because the mist was dried using a diffusion dryer, which is filled with silica gel particles, the diffusion dryer might have emitted environmental PM2.5 into the system. In any case, because the mass concentration detected by distilled water nebulization was less than the environmental PM mass concentration and was approximately 1/8 of the environmental standard in Japan, this can be considered as a background level when examining the toxicity of PM2.5 to skin and other tissues.
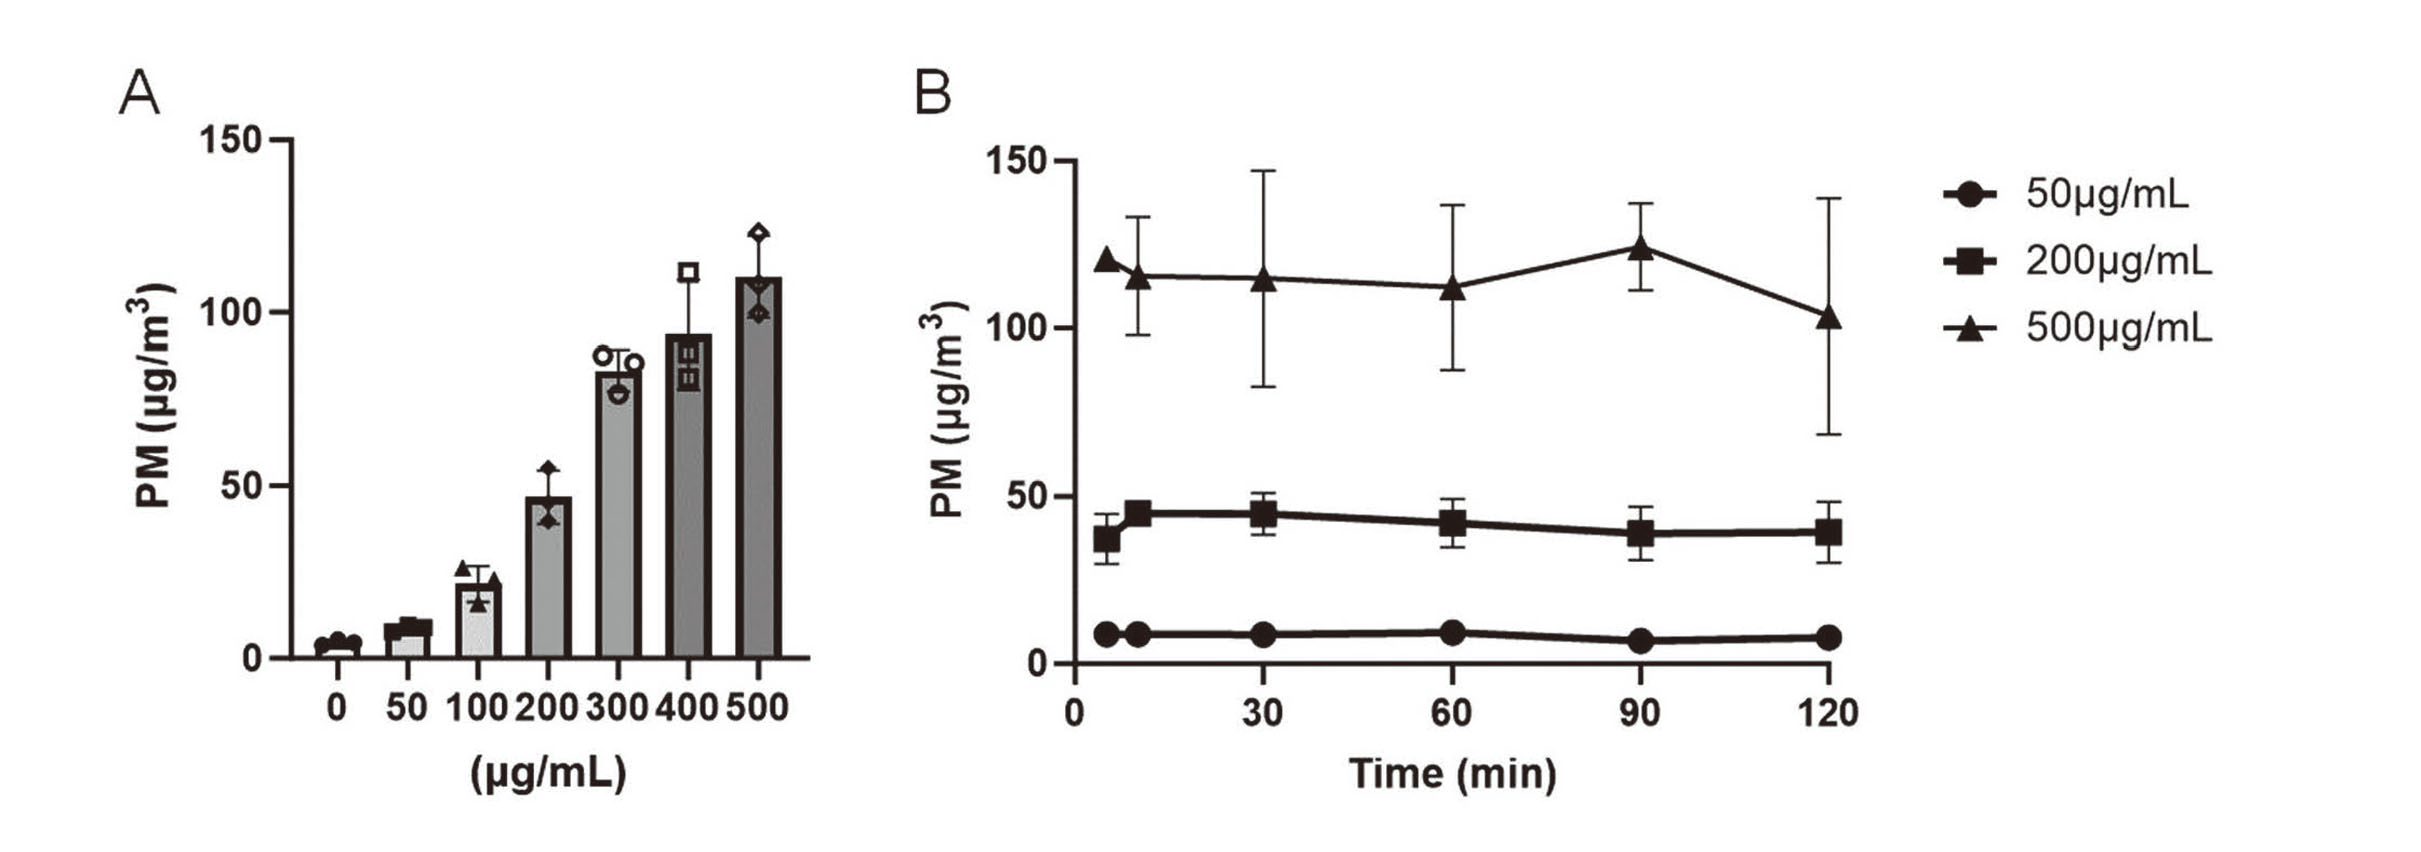
The particle size distribution and spatial mass concentration in the exposure chamber are shown in Table S4 and Fig. 3A, respectively. The spatial mass concentration in the exposure chamber increased as PM2.5 concentration increased (Fig. 3A). In this system, the spatial mass concentration in the exposure chamber kept a plateau from 5 to 120 min after nebulization (Fig. 3B). Therefore, considering more than an hour of exposure, the time required to build up the exposure chamber can be ignored. For long-term exposure, the suspension should be stirred over a long period because a part of PM participates in the mesh part of the nebulizer head. Otherwise, the spatial mass concentration would decrease depending on the nebulization time. Nebulization with continuous pipetting maintained a constant spatial mass concentration (Fig. 3B). When the Milli-Q (Milli-Q Advantage A10, Merck Millipore, Burlington, MA, USA) or distilled water exposed to the atmosphere for a long time was used as a solvent, the PM mass concentration increased in the exposure chamber. Therefore, the use of freshly prepared distilled water is extremely important. When tap water was nebulized, the spatial mass concentration in the chamber was 10 µg/m3 or more. Thus, solvent contamination greatly affects the spatial mass concentration.
The deposition of PM2.5 is difficult to evaluate because it includes various compounds, such as inorganic salts, organic compounds, and metals. Therefore, we demonstrated the relationship between the spatial mass concentration of PM2.5 and the response of the 3D epidermis following PM2.5 exposure. The mean deposition of nanomaterials exposed to nebulizers and dryers approximately ranges from 4% to 20% (Loret et al., 2016). Moreover, it has been demonstrated that the maximum deposition efficiency of air–liquid interface exposure systems for nanomaterial exposure ranges from 1% to 70% (Comouth et al., 2013; Elihn et al., 2013; Kim et al., 2013; Bitterle et al., 2006). The deposition rate of PM varies depending on the measurement method and/or exposure system used. Thus, PM deposition in an air–liquid interface exposure system should be further verified in detail.
Effects of PM2.5 air–liquid interface exposure on viability and inflammation in 3D cultured epidermis and corneal models
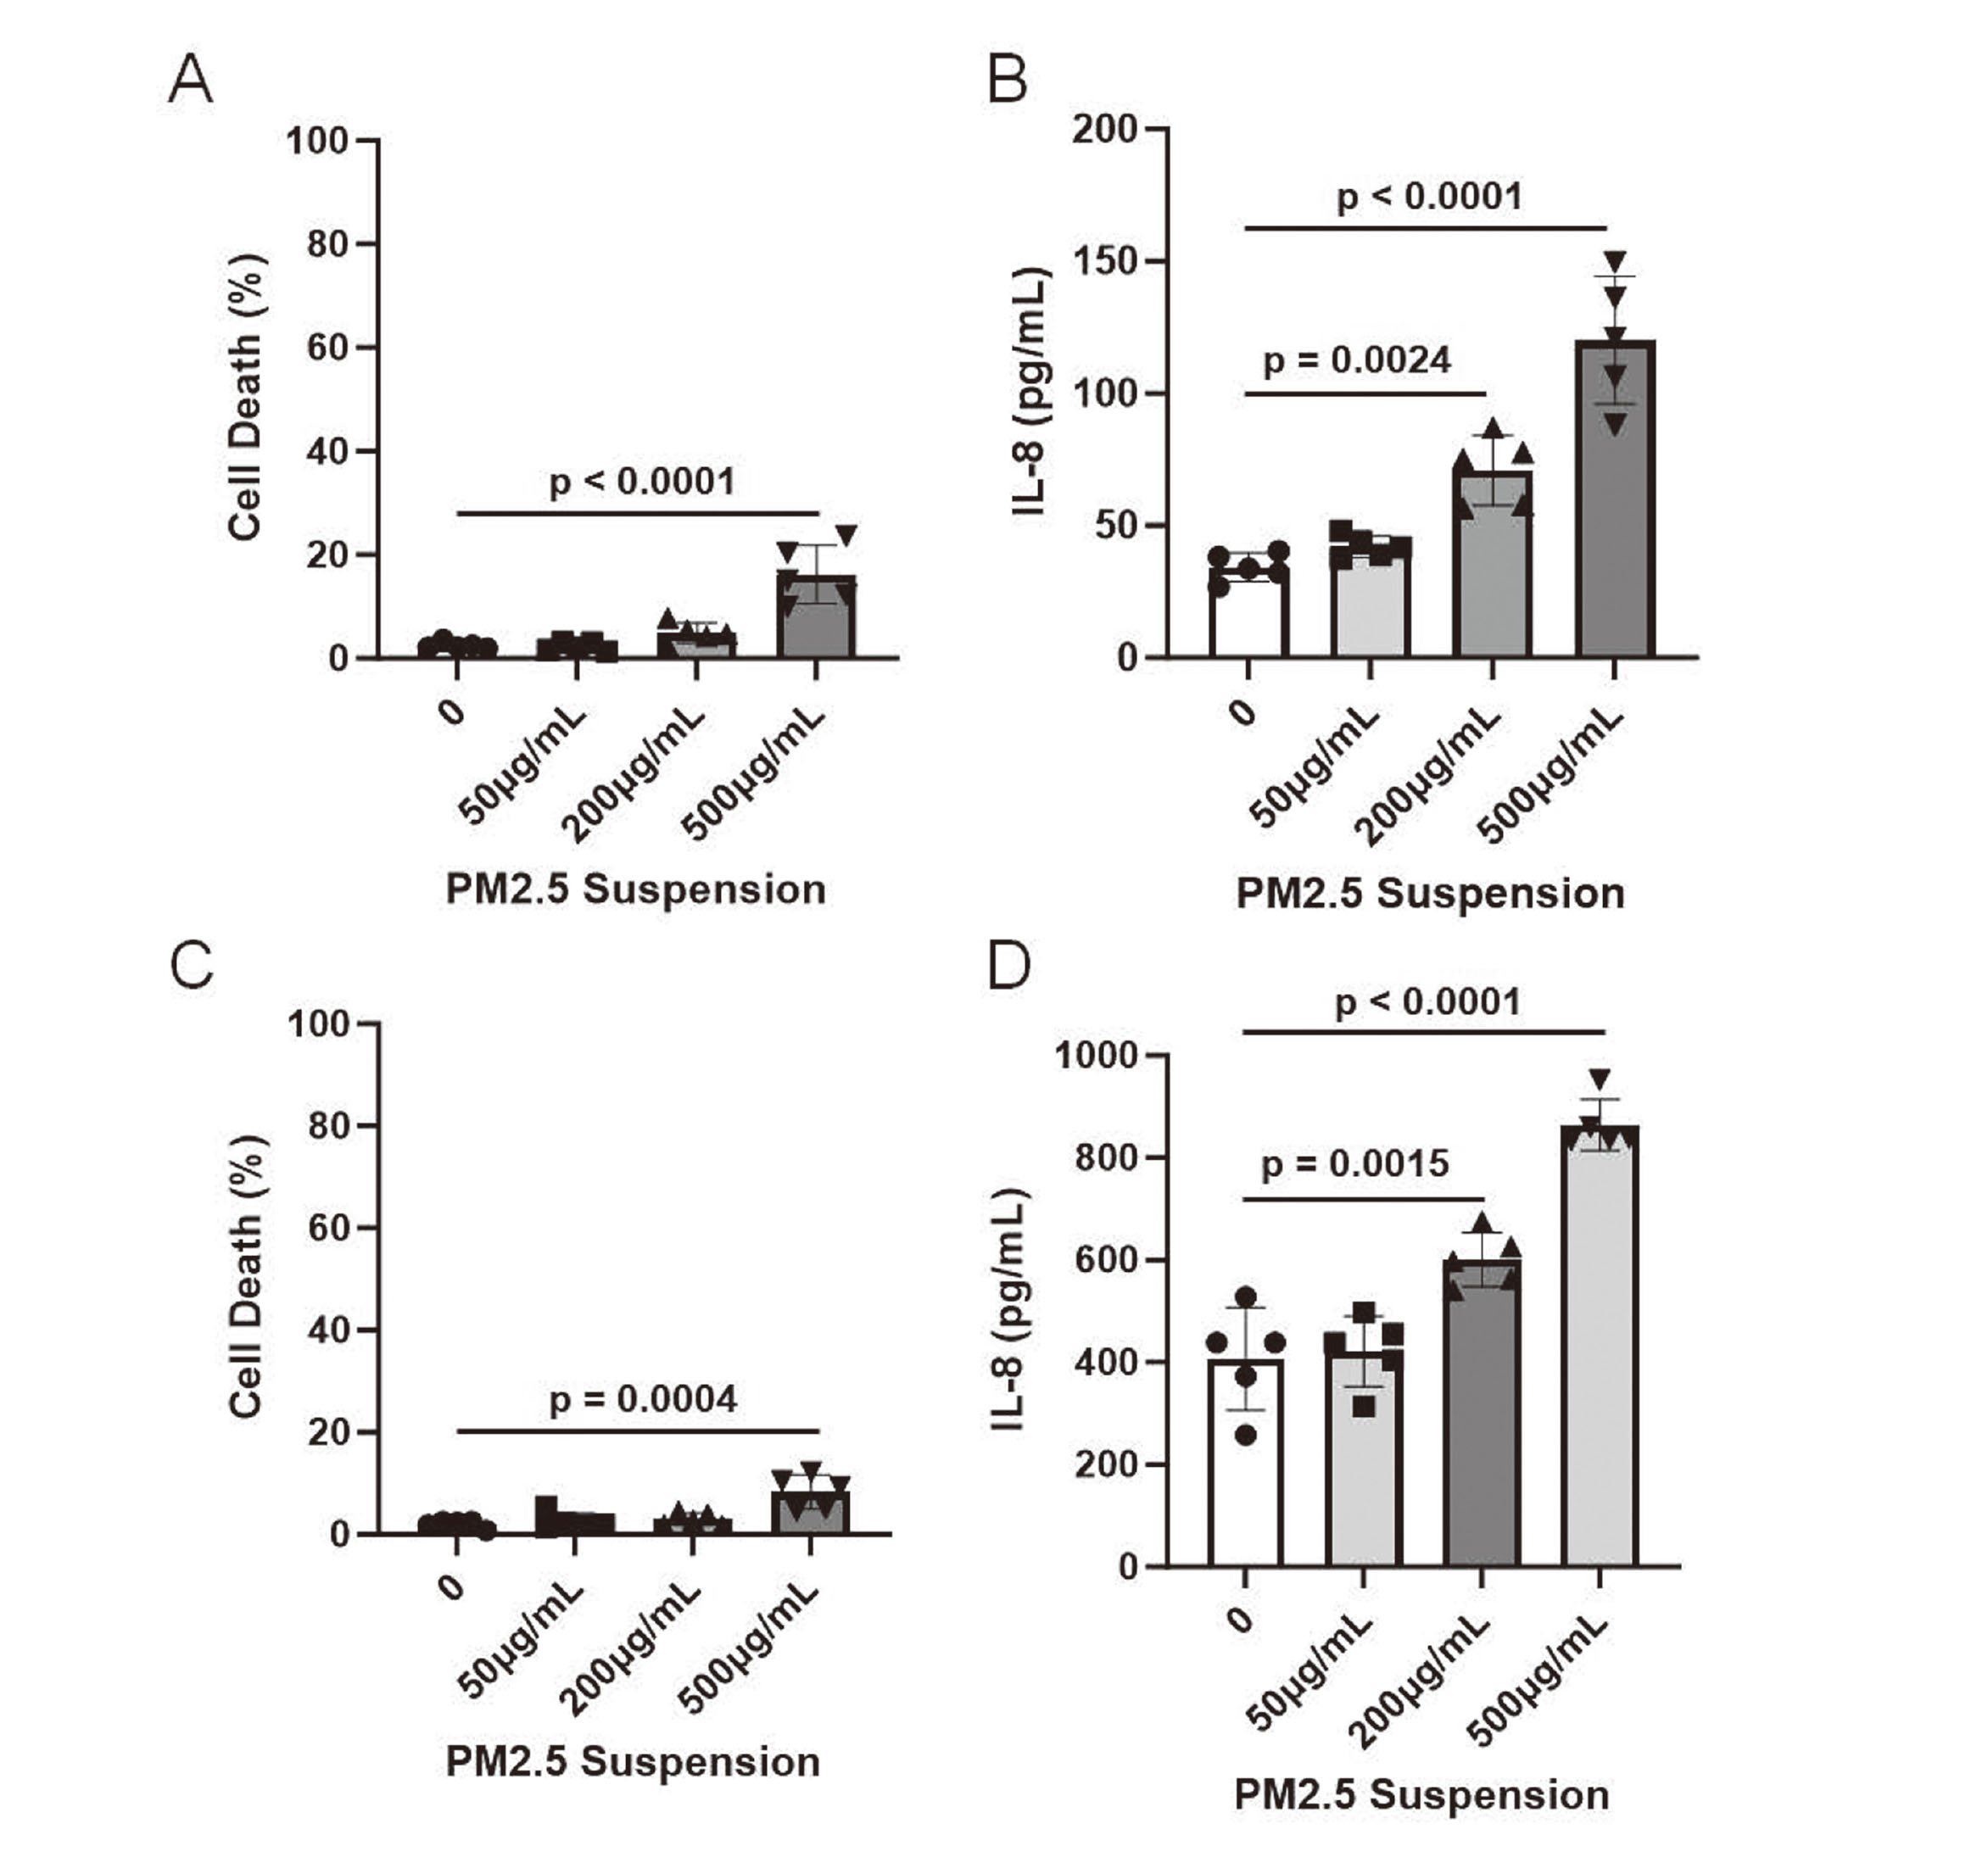
The PM mass concentration in the exposure chamber remained almost unchanged after 2 hr of exposure (Fig. 3B). Exposure of PM2.5 suspension at 50 μg/mL concentration resulted in approximately 10 µg/m3 mass concentration of the exposure chamber, which almost corresponds to the average environmental concentration of PM2.5 in Japan (Kawashima and Haneishi, 2012; Yorifuji et al., 2016). The exposure of 200 μg/mL PM2.5 generated approximately 50 µg/m3 mass concentration, which is higher than the environmental standard in Japan (https://www.env.go.jp/en/air/aq/aq.html); meanwhile exposure of 500 μg/mL PM2.5 produced more than 100 µg/m3 mass concentration, which is extremely high but is an actual PM2.5 concentration in the world (Zhang et al., 2020; Zhang et al., 2023).
The cultured 3D epidermis was exposed to varying PM2.5 concentrations for 2 hr; afterwards, the epidermis was incubated in a CO2 incubator for 22 hr. The exposure to 50 μg/mL PM2.5 suspension had no effect on the cell viability and IL-8 release from the 3D epidermis, whereas exposure to 200 μg/mL PM2.5 suspension induced IL-8 release from the 3D epidermis (Fig. 4A, B). Approximately 20% of the cells died after exposure to 500 μg/mL PM2.5 suspension (Fig. 4A). Furthermore, exposure to 500 μg/mL PM2.5 suspension greatly enhanced IL-8 release from the 3D epidermis, which can be partly due to cell death (Fig. 4B). Next, the human corneal epithelial tissue model was exposed to PM2.5 to examine if this system can apply to other tissues than epidermis. The exposure to 50 μg/mL PM2.5 suspension showed no effect on the cell viability and IL-8 release in the human corneal model (Fig. 4C, D). The exposure to 200 μg/mL PM2.5 suspension induced IL-8 release, and the exposure to 500 μg/mL PM2.5 suspension induced cell death and IL-8 release from the corneal model (Fig. 4C, D). These results indicate that intermediate PM mass concentrations induce IL-8 release, and high PM concentrations cause cell death in addition to IL-8 release in the human corneal model as well as 3D epidermis.
Several systems wherein the nebulizer-generated mist is dried using a dryer before exposure have been reported (Kim et al., 2013; Loret et al., 2016). However, all these systems have been utilized for aerosol exposure of nanomaterials, and no system has been applied for the exposure of environmental PM2.5. The system we developed is novel for exposing environmental PM2.5 as aerosol. Because PM2.5 was suspended in distilled water, misted with a nebulizer, and then dried to form an aerosol in the system, the existing form of substances in the exposed aerosol may differ from that in the actual atmosphere. Fortunately, our system has the advantage of adjusting the aerosol concentration in the exposure chamber according to the concentration of the PM2.5 suspension. The concentration-dependent changes in the same PM2.5-derived aerosols were examined. In addition, by using PM2.5 collected from various regions and seasons, it is possible to investigate the response of PM2.5, considering its regional and seasonal characteristics. Several procedures can be applied to our system to determine the health impacts of PM2.5.
In this study, we successfully developed a novel air–liquid interface exposure system to determine the effects of PM2.5 collected through cyclonic separation on human 3D cultured epidermis and corneal models. We found that 50 µg/mL PM2.5 concentration corresponds to the actual environmental concentration of PM2.5 in Japan, and it did not induce toxic effects on the human 3D epidermis and corneal models. In contrast, 500 µg/mL PM2.5 concentration is extremely high and induced cell death. The system we developed can mimic human skin and cornea exposure to PM2.5; hence, it can be used for the development of drugs and new materials for drugs and cosmetics and safety evaluation. Further verification of this system as an alternative to experiments involving actual human or animals should be conducted.
ACKNOWLEDGMENTS
The authors thank Dr. Yoko Iwamoto for kind discussion during the course of this study. This study was supported by KAKENHI grants from the Japan Society for the Promotion of Science (grant number 20H04341 to YI) and the Environment Research and Technology Development Funds of the Environmental Restoration and Conservation Agency of Japan (JPMEERF20215003 and JPMEERF20205007 to YI).
Conflict of interest
The authors declare that there is no conflict of interest.
REFERENCES
- Bitterle, E., Karg, E., Schroeppel, A., Kreyling, W.G., Tippe, A., Ferron, G.A., Schmid, O., Heyder, J., Maier, K.L. and Hofer, T. (2006): Dose-controlled exposure of A549 epithelial cells at the air-liquid interface to airborne ultrafine carbonaceous particles. Chemosphere, 65, 1784-1790.
- Comouth, A., Saathoff, H., Naumann, K., Muelhopt, S., Paur, H. and Leisner, T. (2013): Modelling and measurement of particle deposition for cell exposure at the air-liquid interface. J. Aerosol Sci., 63, 103-114.
- Dockery, D.W., Pope, C.A. 3rd, Xu, X., Spengler, J.D., Ware, J.H., Fay, M.E., Ferris, B.G. Jr. and Speizer, F.E. (1993): An association between air pollution and mortality in six U.S. cities. N. Engl. J. Med., 329, 1753-1759.
- Dong, L., Hu, R., Yang, D., Zhao, J., Kan, H., Tan, J., Guan, M., Kang, Z. and Xu, F. (2020): Fine Particulate Matter (PM2.5) upregulates expression of Inflammasome NLRP1 via ROS/NF-κB signaling in HaCaT Cells. Int. J. Med. Sci., 17, 2200-2206.
- Elihn, K., Cronholm, P., Karlsson, H.L., Midander, K., Odnevall Wallinder, I. and Möller, L. (2013): Cellular dose of partly soluble Cu particle aerosols at the air-liquid interface using an in vitro lung cell exposure system. J. Aerosol Med. Pulm. Drug Deliv., 26, 84-93.
- Ghosh, R., Rossner, P., Honkova, K., Dostal, M., Sram, R.J. and Hertz-Picciotto, I. (2016): Air pollution and childhood bronchitis: interaction with xenobiotic, immune regulatory and DNA repair genes. Environ. Int., 87, 94-100.
- Ishihara, N., Okuda, T., Hagino, H., Oguro, A., Tani, Y., Okochi, H., Tokoro, C., Fujii-Kuriyama, Y., Itoh, K., Vogel, C.F. and Ishihara, Y. (2022): Involvement of polycyclic aromatic hydrocarbons and endotoxin in macrophage expression of interleukin-33 induced by exposure to particulate matter. J. Toxicol. Sci., 47, 201-210.
- Kawashima, H. and Haneishi, Y. (2012): Effects of combustion emissions from the Eurasian continent in winter on seasonal δC of elemental carbon in aerosols in Japan. Atmos. Environ., 46, 568-579.
- Kim, J.S., Peters, T.M., O’Shaughnessy, P.T., Adamcakova-Dodd, A. and Thorne, P.S. (2013): Validation of an in vitro exposure system for toxicity assessment of air-delivered nanomaterials. Toxicol. In Vitro, 27, 164-173.
- Kono, M., Okuda, T., Ishihara, N., Hagino, H., Tani, Y., Okochi, H., Tokoro, C., Takaishi, M., Ikeda, H. and Ishihara, Y. (2023): Chemokine expression in human 3-dimensional cultured epidermis exposed to PM2.5 collected by cyclonic separation. Toxicol. Res., 39, 1-13.
- Kono, M., Okuda, T., Takaishi, M., Ikeda, H., Ishihara, N. and Ishihara, Y. (2022): Leaf extracts from the Camellia sinensis and the Argania spinosa suppressed oxidative stress and chemokine release in human 3-dimensional cultured epidermis exposed to PM2.5 collected with cyclonic separation. Fundam. Toxicol. Sci., 9, 117-122.
- Kurihara, K., Iwata, A., Horwitz, S.G., Ogane, K., Sugioka, T., Matsuki, A. and Okuda, T. (2022): Contribution of Physical and Chemical Properties to Dithiothreitol-Measured Oxidative Potentials of Atmospheric Aerosol Particles at Urban and Rural Sites in Japan. Atmosphere (Basel), 13, 319.
- Liao, Z., Nie, J. and Sun, P. (2019): The impact of particulate matter (PM2.5) on skin barrier revealed by transcriptome analysis: focusing on cholesterol metabolism. Toxicol. Rep., 7, 1-9.
- Loret, T., Peyret, E., Dubreuil, M., Aguerre-Chariol, O., Bressot, C., le Bihan, O., Amodeo, T., Trouiller, B., Braun, A., Egles, C. and Lacroix, G. (2016): Air-liquid interface exposure to aerosols of poorly soluble nanomaterials induces different biological activation levels compared to exposure to suspensions. Part. Fibre Toxicol., 13, 58.
- Mirabelli, M.C., Vaidyanathan, A., Flanders, W.D., Qin, X. and Garbe, P. (2016): Outdoor PM2.5, Ambient Air Temperature, and Asthma Symptoms in the Past 14 Days among Adults with Active Asthma. Environ. Health Perspect., 124, 1882-1890.
- Okuda, T., Isobe, R., Nagai, Y., Okahisa, S., Funato, K. and Inoue, K. (2015): Development of a High-Volume PM2.5 Particle Sampler Using Impactor and Cyclone Techniques. Aerosol Air Qual. Res., 15, 759-767.
- Onishi, T., Honda, A., Tanaka, M., Chowdhury, P.H., Okano, H., Okuda, T., Shishido, D., Terui, Y., Hasegawa, S., Kameda, T., Tohno, S., Hayashi, M., Nishita-Hara, C., Hara, K., Inoue, K., Yasuda, M., Hirano, S. and Takano, H. (2018): Ambient fine and coarse particles in Japan affect nasal and bronchial epithelial cells differently and elicit varying immune response. Environ. Pollut., 242 (Pt B), 1693-1701.
- Park, T.H., Park, S., Cho, M.K. and Kim, S. (2022): Associations of particulate matter with atopic dermatitis and chronic inflammatory skin diseases in South Korea. Clin. Exp. Dermatol., 47, 325-334.
- Piao, M.J., Ahn, M.J., Kang, K.A., Ryu, Y.S., Hyun, Y.J., Shilnikova, K., Zhen, A.X., Jeong, J.W., Choi, Y.H., Kang, H.K., Koh, Y.S. and Hyun, J.W. (2018): Particulate matter 2.5 damages skin cells by inducing oxidative stress, subcellular organelle dysfunction, and apoptosis. Arch. Toxicol., 92, 2077-2091.
- Pitz, M., Schmid, O., Heinrich, J., Birmili, W., Maguhn, J., Zimmermann, R., Wichmann, H.E., Peters, A. and Cyrys, J. (2008): Seasonal and diurnal variation of PM2.5 apparent particle density in urban air in Augsburg, Germany. Environ. Sci. Technol., 42, 5087-5093.
- Tanaka, M., Okuda, T., Itoh, K., Ishihara, N., Oguro, A., Fujii-Kuriyama, Y., Nabetani, Y., Yamamoto, M., Vogel, C.F. and Ishihara, Y. (2023): Polycyclic aromatic hydrocarbons in urban particle matter exacerbate movement disorder after ischemic stroke via potentiation of neuroinflammation. Part. Fibre Toxicol., 20, 6.
- Yorifuji, T., Kashima, S. and Doi, H. (2016): Acute exposure to fine and coarse particulate matter and infant mortality in Tokyo, Japan (2002-2013). Sci. Total Environ., 551-552, 66-72.
- Zhang, L., Wilson, J.P., MacDonald, B., Zhang, W. and Yu, T. (2020): The changing PM2.5 dynamics of global megacities based on long-term remotely sensed observations. Environ. Int., 142, 105862.
- Zhang, Y., Wu, W., Li, Y. and Li, Y. (2023): An investigation of PM2.5 concentration changes in Mid-Eastern China before and after COVID-19 outbreak. Environ. Int., 175, 107941.