Abstract
A Cu-Ni alloy in which the nickel content was included up to approximately 5 mass% was melted in a graphite crucible with a high frequency induction furnace to prepare the Cu-Ni-Csat (saturated carbon) alloy. Solubility of carbon into Cu-Ni alloy increased with the nickel content and with the melting temperature. The relation between the activity coefficient of carbon for Cu-Ni-Csat and the temperature could be expressed by numerical formulas. This work proposed that the interaction parameter, $\omega_{\rm C}^{\rm Ni}$, for Cu-Ni-Csat was −16.1. The precipitated particles from the melt were graphite. Vickers hardness of Cu-Ni-Csat system increased with C content. The Cu-Ni-Csat alloy prepared in this study was hardened by precipitation hardening of the graphite particles and solution hardening of Ni.
1. Introduction
Graphite-dispersed copper composites have been known to have good thermal and electrical conductivities, self-lubricating and low thermal expansions coefficient.1,2) The former two properties and the latter two properties were mainly originated from copper and graphite respectively. Therefore, this composite is used for a sliding contact which an electric current flows in and friction acts on. One of the applications of this material is a brush for a direct current (DC) motor and a generator.3,4) The brushes determine the lifetime of a DC motor and a generator. Because the brush is worn by the friction, the brush is replaced as needed.
Generally, the graphite dispersed copper composites have been prepared with the sintering.5) The most important thing is that copper does not wet graphite. Therefore, surface modification of graphite and/or alloying a copper with the element such as Ti and Cr so as to improve the wetting.6,7) Generally, a metal can wet a solid which formed endogenously. If graphite is precipitated in a molten copper as graphite from cast iron, this problem of the wetting between copper and graphite will be able to be solved. The phase diagram shows that the solubility of carbon in liquid copper at the temperature below approximately 2000 K is below approximately 50 mass ppm.8) Then, in our previous work9), copper in a graphite crucible was heated up to approximately 2300 K so as to study the solubility of graphite into molten copper at a higher temperature. The saturated content of carbon in molten copper steeply increased when the temperature exceeded approximately 2100 K. The saturated content of carbon in molten copper at 2273 K was 300 mass ppm. In addition, spheres and flakes of graphite were precipitated at the final solidification place of the copper saturated with carbon. However, the saturated carbon content was too small that quantity of the precipitated graphite was a few. Then, in this work, it was attempted to increase the solubility of carbon by addition of alloying element in copper. Because the carbon can dissolves in a nickel, it is anticipated that the solubility of carbon in Cu-Ni alloy increases with an increase in nickel content in the alloy. J. R. Anderson and M. B. Bever investigated the solubility of carbon in copper-nickel alloy at temperature of 1748 K.10) Until now, there is no research on carbon solubility in molten copper-nickel alloy above 1748 K. In addition, whereas Ni3C has been known as carbide of nickel, it can be estimated from Gibbs energy that the Ni3C does not form in the Cu-Ni-Csat alloy.11) A nickel is chosen as an alloying element from these two reasons. Then, as a series of fundamental study of preparation of graphite dispersed copper composite, influence of nickel content in molten Cu-Ni alloy on the solubility of carbon was investigated. In addition, The Vickers hardness of the solidified alloy was measured to clear the effects of the dissolved carbon, precipitated graphite and nickel content on the hardness.
2. Experimental
2.1 Cu-Ni alloy preparation
Copper (the purity: 99.9 mass%) and nickel (99.9 mass%) were used for preparation of Cu-Ni alloy. The Cu-Ni alloy of approximately 300 g in a magnesia crucible was melted under argon (99.9995 vol%) gas flow with an high frequency induction furnace. Immediately after the molten alloy was sucked through a silica tube with an inner diameter of 8 mm, the molten alloy in silica tube was put into water to cool it rapidly. The content of nickel in the solidified rod-like sample was measured with a spot analysis of an energy dispersive X-ray spectroscopy (EDS). Nickel content in the center of the rod-like sample was low, and it increased slightly in the direction from center to the side surface. However, the nickel content at each radial distance from the center did not change with the position in the longitudinal direction of the rod-like sample. This meant that central segregation occurred in the solidified sample. However this also meant that the total composition of the sample cut in round slice from the sample was unchanged. Therefore, the sample for measurement of solubility of carbon was prepared in such slice. The sliced sample was approximately 1.24 g in weight. The nickel contents in the sliced sample were 1.35 ± 0.10 mass%, 3.13 ± 0.11 mass% and 5.02 ± 0.10 mass% respectively. Nickel content was measured with an ICP-OES and an area analysis of EDS. The area analysis was performed at the randomly chosen ten places of a sample. Both two analytical values almost accorded in the range of scattering of the analytical values. Therefore nickel content was mainly measured with an EDS.
2.2 Experiment for measurement of carbon solubility
Figure 1 showed the experimental apparatus for measurement of the solubility of carbon. High frequency induction furnace (130 kHz, 30 kW) was used in this experiment. The graphite crucible (99.5 mass%) for melting the alloy was 11.5 mm in inner diameter, and the height of the crucible was adjusted so that the distance between the graphite lid and the surface of the molten alloy in the crucible was 1 mm or less. The graphite lid which was put on the crucible was hollowed 3 mm in depth from the upper top. These graphite crucible and lid were burned in argon gas at approximately 2000 K before experiment. The temperature of the hollowed part of the lid was measured with a two color thermometer. It was confirmed that the temperature measured with a two color thermometer accorded with the temperature by the crucible with a thermocouple (Pt-20 mass% Rh, Pt-40 mass% Rh). Several graphite crucibles were placed in a large graphite crucible which was heated with the induction furnace.

The sliced Cu-Ni alloy was placed in the graphite crucible. Subsequently, argon gas with a flow rate of 2.0 × 10⁻⁵ m3s−1 (293 K, 101.3 kPa (NTP)) was introduced into the furnace to displace the air and prevent oxidation during experiment. Then, the alloy was heated under argon gas flow. It took around one hour to heat the crucible at the desired temperature. The temperature was controlled at desired temperature with ±10 K manually. After keeping the temperature of the crucible constant for designed time, the alloy was cooled in the furnace.
A certain cooled alloy adhered strongly on the graphite crucible. This strong adhesion was observed for the sample whose nickel content was around 1.35 mass%, 3.13 mass% and 5.02 mass% prepared over the temperature of 1973 K, 2073 K and 2143 K respectively. This indicated the molten alloy wetted well on the graphite on these conditions. Adhered graphite was removed by filing. Carbon and sulfur contents in the sample were measured with combustion–infrared absorbing method. As described later, precipitated graphite particles did not existed uniformly in the sample. The sample was cut in half with a wire cutter. Both two pieces were analyzed. The carbon and sulfur contents were determined in consideration of the analytical values and the weights for both two pieces of the samples. The samples for observation and analysis of nickel composition were also prepared in the same way in addition to the samples for analysis of carbon and sulfur contents. The sample in the resin was polished by an emery paper, alumina powder and colloidal silica in this order, and was observed by an optical microscope and a scanning electron microscope (SEM) equipped with and EDS. The nickel content in the sample was measured with an EDS, as described earlier.
Vickers hardness of the alloy was measured with the test force of 980 mN and holding time of 10 s. Specimens which were prepared at 1673 K, 1873 K and 2073 K were heat treated at the temperature of 873 K for 2 hours. The hardness was measured for the center and upper part of the specimen. The hardness was measured for 7 different locations of each part. The scattering of the measured hardness was ±50 MPa.
3. Results and Discussion
3.1 Solubility of carbon in Cu-Ni alloy
3.1.1 Saturated carbon content
Figure 2 showed an example of change in carbon content in molten Cu-Ni with time. The carbon content in the molten Cu-Ni alloy became constant one hour later from keeping the temperature at desired temperature, irrespective to nickel content and temperature. In addition, any product except graphite and any nickel rich phase were not observed and detected at the interface between molten alloy and graphite crucible. Therefore, the carbon was saturated in the molten ally one hour later, and it was equilibrated with graphite. The sulfur content in the alloys were below 50 ppm. Nickel content in the alloy two hours later were listed in Table 1. It increased from the initial nickel content, because the vapor pressure of pure copper was approximately 20 times larger than that of pure nickel.12)
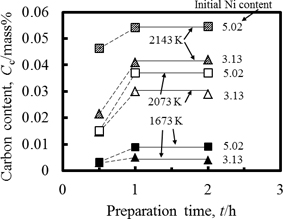
Table 1
Ni and C contents before and after experiment (two hours later), activity coefficient
$\gamma_{\rm C}$ and interaction parameter
$\omega_{\rm C}^{\rm Ni}$.
Temp.
T/K |
Ni content, CNi/mass% |
C content after
experiment, CC/mass% |
$\gamma_{\rm C}$ |
$\omega_{\rm C}^{\rm Ni}$ |
| Before |
After |
| 1673 K |
1.35 |
1.66 |
3.38 × 10⁻³ |
5.60 × 10³ |
−19.7 |
| 1673 K |
3.13 |
3.64 |
5.00 × 10⁻³ |
3.79 × 10³ |
| 1673 K |
5.02 |
5.18 |
8.93 × 10⁻³ |
2.10 × 10³ |
| 1873 K |
1.35 |
1.76 |
3.98 × 10⁻³ |
4.76 × 10³ |
−13.7 |
| 1873 K |
3.13 |
3.51 |
7.33 × 10⁻³ |
2.59 × 10³ |
| 1873 K |
5.02 |
5.28 |
9.07 × 10⁻³ |
2.10 × 10³ |
| 1973 K |
1.35 |
1.54 |
7.07 × 10⁻³ |
2.68 × 10³ |
−12.3 |
| 1973 K |
3.13 |
3.72 |
8.33 × 10⁻³ |
2.28 × 10³ |
| 1973 K |
5.02 |
5.39 |
1.31 × 10⁻² |
1.45 × 10³ |
| 2073 K |
1.35 |
1.69 |
8.54 × 10⁻³ |
2.22 × 10³ |
−19.9 |
| 2073 K |
3.13 |
3.25 |
2.89 × 10⁻² |
0.66 × 10³ |
| 2073 K |
5.02 |
5.09 |
3.70 × 10⁻² |
0.51 × 10³ |
| 2143 K |
1.35 |
1.37 |
1.68 × 10⁻² |
1.13 × 10³ |
−16.4 |
| 2143 K |
3.13 |
3.49 |
4.09 × 10⁻² |
0.46 × 10³ |
| 2143 K |
5.02 |
5.37 |
5.41 × 10⁻² |
0.35 × 10³ |
| 1748 K10) |
1.01 |
- |
2.00 × 10⁻³ |
9.46 × 10³ |
−20.7 |
| 1748 K10) |
1.99 |
- |
4.00 × 10⁻³ |
4.73 × 10³ |
| 1748 K10) |
4.08 |
- |
7.50 × 10⁻³ |
2.53 × 10³ |
| 1748 K10) |
5.28 |
- |
1.30 × 10⁻² |
1.46 × 10³ |
| 1748 K10) |
9.94 |
- |
5.30 × 10⁻² |
0.36 × 10³ |
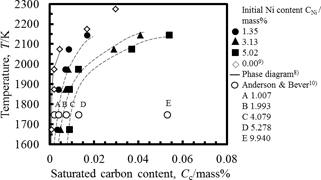
Influence of the temperature on the solubility of carbon was shown in Fig. 3. The carbon content was plotted as a phase diagram. The saturated carbon content for each nickel content in the molten alloy increased with an increase in the temperature. The solubility of carbon in pure copper was also shown in this figure. The saturated carbon content for each temperature increased with an increase in nickel content. Anderson and Bever10) studied the carbon solubility of molten Cu-Ni alloy with the nickel content up 90.672 mass% at 1748 K. Their solubility was also shown in Fig. 3. The relation between the saturated carbon content and the nickel content which was predicted from work agreed well with their work. In addition, the saturated carbon content of 5.02 mass% at 2143 K was almost the same as that for nickel content of 9.94 mass% at 1748 K given by their work. It was indicated from our and their works that the saturated carbon content can be controlled by the temperature and the nickel content of Cu-Ni alloy.
It was convenient to express the solubility as a function of temperature, T. The solubility could be expressed by the following expression:
Nickel content, CNi: 1.54 mass%~1.69 mass%
| \[
\begin{split}
\ln [{\rm mass\%C}] = {}& 2.6878 \times 10^{-9} T^3 - 1.2885 \times 10^{-5} T^2 \\
& + 0.0245T - 23.728
\end{split}
\] | (1) |
CNi: 3.51 mass%~3.72 mass%
| \[
\begin{split}
\ln [{\rm mass\%C}] = {}& {-}1.1636 \times 10^{-8} T^3 + 7.0623 \times 10^{-5} T^2 \\
& - 0.1371T + 80.6944
\end{split}
\] | (2) |
CNi: 5.18 mass%~5.39 mass%
| \[
\begin{split}
\ln [{\rm mass\%C}] = {}& 9.4479 \times 10^{-9} T^3 - 4.5006 \times 10^{-5} T^2 \\
& + 0.0724T - 44.2706
\end{split}
\] | (3) |
CNi: 0.00 mass%9)
| \[
\begin{split}
\ln [{\rm mass\%C}] = {}& 4.4683 \times 10^{-9} T^3 - 1.7962 \times 10^{-5} T^2 \\
& + 0.0242T - 18.104
\end{split}
\] | (4) |
Solubility values calculated using the above expression was shown in Fig. 3. The values calculated using eqs. (1)–(3) agreed well with the experimentally obtained values.
3.1.2 Activity coefficient of carbon
Activity of carbon, $a_{\rm c}$ which based on pure substance as standard state could be expressed with using activity coefficient of carbon, $\gamma_c$ and molar fraction of carbon, $x_c$ could be expressed as:
| \[a_{\rm c} = \gamma_{\rm c} x_{\rm c}\] | (5) |
Because the molten Cu-Ni alloy was equilibrated with graphite, the carbon activity was equal to one. Therefore, the activity coefficient of carbon could be calculated from the following equation.
| \[\gamma_{\rm c} = 1/x_{\rm c}\] | (6) |
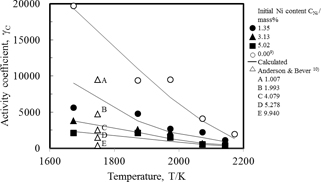
Figure 4 showed the relation between the activity coefficient of carbon and the temperature. In this figure, the data given by Anderson & Bever were also shown. It is shown that activity coefficient using eq. (6), agreed with the experimentally obtained values. The activity coefficient decreased with the temperature rise, and with an increase in the nickel content.
Interaction parameter, $\omega_{\rm C}^{\rm Ni}$, of Cu-Ni-Csat system could be given as:
| \[\omega_{\rm C}^{\rm Ni} = \partial \ln \gamma_{\rm C}/\partial x_{\rm Ni}\] | (7) |
Figure 5 showed the relation between natural logarithm of the activity coefficient of carbon and molar fraction of nickel. The solid lines were given by the regression analysis. There was the good linear relation between them for each temperature. The data by Anderson and Bever10) were also shown as a dotted line in this figure. There was also good linear relation between them. These linear relation indicated adaptability of eq. (3). The gradient of each solid line gave the interaction parameter, $\omega_{\rm C}^{\rm Ni}$ according to eq. (3). The interaction parameters were listed in Table 1. The interaction parameters obtained in this work were larger than the parameter given by Anderson and Bever10). There was no dependency of the interaction parameter on the temperature. Then assuming that the parameter was not influenced by the temperature, the interaction parameter was determined by averaging the experimentally obtained interaction parameters. The averaged interaction parameter was −17.1, as listed in Table 1. The broken lines in Fig. 5 were drawn by using the averaged interaction parameter. These broken lines could also express the data.

The precipitated particles in the solidified Cu-Ni-Csat alloy were shown in Fig. 6. Even if the black particles were analyzed with the spot analysis of the EDS, the elements except carbon could not almost be detected. Therefore, the black particles were judged to be graphite. As shown in Fig. 6, the particles were classified into the particles of approximately 5 μm or more in size and the particles of approximately 0.5 μm in size. Many of the relatively large graphite particles were observed on the alloys which were prepared at a higher temperature and/or nickel content, which indicated the higher carbon content. Whereas the particles had a variety of shapes, they were angular more or less.

Figure 7 showed the distribution of graphite particles. In comparison of Fig. 7 (a) and Fig. 7 (b), many graphite particles were observed in the sample which was prepared at higher the temperature and the Ni content, which meant that the saturated carbon content in the sample was higher. The particles were in every place of the whole sample as shown in Fig. 7 (b) and Fig. 7 (c). However, the particles did not exist uniformly. Many graphite particles were at some place and a few particles were at other place in the sample. The large particles with the size of 5 μm or more could be observed in Fig. 7, but the particles with the size of approximately 0.5 μm did not existed uniformly. Cu-Ni alloy system was all proportional solid solution. nickel rich phase in which carbon content was high crystallized out from the melt even in Cu-Ni-C system. Whereas a nickel rich phase could not be distinguished from a nickel poor phase, it could be said that many graphite particles precipitated from the nickel rich phase.

The Vickers hardness was mainly measured for the annealed samples which were prepared at the temperatures of 1673 K, 1873 K and 2073 K. The Vickers hardness increased linearly with the increase in the saturated carbon content. The phase diagram of Cu-C system indicated that carbon could not dissolve into solid copper. In addition, judging from the carbon solubility in the molten Cu-Ni-Csat in this work, carbon did not dissolve into solid Cu-Ni system. Therefore, this increase in the Vickers hardness with the saturated carbon content did not resulted from dissolved carbon but from the precipitated graphite particles. The hardness also increased with the increase in the nickel content, as shown in Fig. 8. Consequently, carbon saturated Cu-Ni alloy which was prepared in this work was hardened by precipitation hardening of the graphite particles and solution hardening of nickel.
4. Conclusions
Cu-Ni alloy which included nickel content up to approximately 5 mass% was melted in the graphite crucible to prepare graphite dispersed Cu-Ni alloy. Solubility of carbon in the Cu-Ni alloy and Vickers hardness were measured in this study. Main results and conclusion were summarized as follows:
(1) The solubility of carbon in the molten Cu-Ni alloy increased with the temperature rise and with the nickel content. The relation between solubility of carbon in molten Cu-Ni alloy and temperature, T (1673 K~2143 K) could be given by eqs. (1)~(3).
(2) It was proposed that the interaction parameter, $\omega_{\rm C}^{\rm Ni}$, for Cu-Ni-Csat (saturated carbon) was −17.1.
(3) Graphite particles were precipitated from the molten Cu-Ni-Csat. Vickers hardness of Cu-Ni-Csat system increased with C content and Ni content. The Cu-Ni-Csat alloy was hardened by precipitation hardening of the graphite particles and solution hardening of nickel.
REFERENCES
- 1) P. Jenei, J. Gubicza, E.Y. Yoon, H.S. Kim and J.L. Lábár: Compos., Part A Appl. Sci. Manuf. 51 (2013) 71–79. 10.1016/j.compositesa.2013.04.007
- 2) Y. Feng and S.L. Burkett: Comput. Mater. Sci. 97 (2015) 1–5. 10.1016/j.commatsci.2014.10.014
- 3) D. Kuhlmann-Wilsdorf: Components, Packag. Manuf. Technol. Part A, IEEE Trans. 19 (1996) 360–375. 10.1109/95.536838
- 4) Z.L. Hu, Z.H. Chen and J.T. Xia: Wear 264 (2008) 11–17. 10.1016/j.wear.2007.01.034
- 5) K. Rajkumar and S. Aravindan: J. Mater. Process. Technol. 209 (2009) 5601–5605. 10.1016/j.jmatprotec.2009.05.017
- 6) L. Yang, P. Shen, Q. Lin, F. Qiu and Q. Jiang: Appl. Surf. Sci. 257 (2011) 6276–6281. 10.1016/j.apsusc.2011.02.060
- 7) P.B. Abel, A.L. Korenyi-Both, F.S. Honecy and S.V. Pepper: J. Mater. Res. 9 (1994) 617–624. 10.1557/JMR.1994.0617
- 8) P.R. Subramanian and D.E. Laughlin: Phase diagrams of binary alloys. Monograph series on alloy phase diagrams, (Materials Park, OH: ASM International 10, 1994) p.109.
- 9) S. Yokoyama, Y. Takashima, M. Nor, Y. Murata, H. Kanematsu, J. Sasano and M. Izaki: AMPT Sept (2012) 1–8.
- 10) P.B. Anderson and M.B. Bever: Met. Technol. 14 (1947) 2151.
- 11) E. T. Turkdogan: Physical chemistry of the high temperature technology, Academic Press (1980) p.17.
- 12) Y. Kawai and Y. Shiraishi: Handbook of Physico-chemical Properties at High Temperature, (ISIJ, 1988) p.74.