Abstract
Three cup thermal analysis is a good method for predicting chill depth, tensile strength and graphite type in gray cast iron. However, it cannot be used in ductile cast iron due to several reasons. For this reason, we have developed a method for investigating the graphite eutectic temperature (hereafter TEG) and cementite eutectic temperature (hereafter TEG) in ductile cast iron, from the chemical composition of the molten metal, as follows;
TEG = 1149.1(℃) + 4.7Si% − 4.0Mn% − 44P% + 2.7Cu% + 1.0Ni% + 1.8Co% + 13.9Al% − 17.7Mo% − 10.5Cr% − 9.3Sn% − 5.2Sb% − 6.1W% − 3.7Nb% − 14.8V% − 80.3B%
TEC = 1142.6(℃) − 11.6Si% − 0.75Mn% − 46.2P% − 1.4Cu% − 1.1Ni% − 0.7Co% − 1.8Al% − 14.5Mo% + 5.9Cr% − 6.0Sn% − 5.1Sb% − 2.8W% + 0Nb% + 3.3V% − 26.0B
Using the cooling curve of 1 cup and the above equations, we calculated eutectic graphitization ability (hereafter EGA). We investigated if this one cup thermal analysis can be used to predict the quality of molten metal (graphite nodule count and shrinkage tendency) correctly even in ductile cast iron, before it is poured.
The graphite nodule count (N) of CE cup T.P. is determined by EGA(= ΔT1 × 100/ΔTE) as follow; N = 6.13 × (ΔT1 × 100/ΔTE) − 126 In addition, when EGA exceeds 90%, the shrinkage tendency parameter (θ) becomes low near 55° which is that of gray cast iron. Consequently, one cup thermal analysis is a good system for predicting the quality of molten metal (graphite nodule count and shrinkage tendency) correctly in ductile cast iron before pouring.
This Paper was Originally Published in Japanese in J. JFS 89 (2017) 332–337.
1. Introduction
In order to predict the quality of molten metal of gray cast iron, many methods have been proposed. These methods may be divided into two groups; (a) chill test1–3) and (b) cooling curve4–9). However, there are many problems, as follows. The chill test method is unreliable, because the chill depth changes largely depending on the pouring condition. As for the prediction with cooling curve, although many tests and calculations have been reported, there is a lack of quantitative data.
T. Kanno10) suggests 3 cup thermal analysis. The principle and the measuring method are as follows. The quality of molten metal (to be A-type graphite, or to be D-type graphite, or to be chill) is determined where it is solidified between the graphite eutectic temperature (hereafter TEG) and the cementite eutectic temperature (hereafter TEC). The three cups thermal analysis consists of 3 cups ((A) 1.2 mass% inoculated cup, (B) Base melt cup, (C) 0.3 mass% Tellurium added cup). From the inoculated cup (A), TEG is measured. From cup (B), the minimum eutectic temperature at recalescence (hereafter TSC) is measured. From the tellurium added cup (C), TEC is obtained. With using these three temperatures, we calculate $\Delta {\rm T}_{\rm E}$ and $\Delta {\rm T}_{1}$. From the ratio between $\Delta{\rm T}_{1}$ and $\Delta{\rm T}_{\rm E}$, the eutectic graphite ability (hereafter EGA) can be calculated as follow;
| \[
\Delta{\rm T}_{\rm E} = {\rm T}_{\rm EG} - {\rm T}_{\rm EC}
\] | (1) |
| \[
\Delta{\rm T}_{1} = {\rm T}_{\rm SC} - {\rm T}_{\rm EC}
\] | (2) |
| \[
{\rm EGA} = \Delta{\rm T}_{1} \times 100/\Delta{\rm T}_{\rm E}
\] | (3) |
Zero EGA means to become all chill (0 point degree molten metal) and hundred EGA means to become all A type graphite (100 point degree molten metal)
Figure 1 shows the relationship between EGA and chilling depth (D)10). As shown in eq. (4), there is a good correlation between EGA and chilling depth (r = 0.98). It can be said that chilling tendency is predicted correctly with 3 cups thermal analysis in gray cast iron.
| \[
{\rm D} = - 0.27
\times
(\Delta {\bf T}_{\bf 1} \times 100/\Delta {\bf T}_{\bf E})
+ 26\ ({\rm r} = 0.98)
\] | (4) |
In addition, there is also a good correlation between EGA and tensile strength
11).
The three cups thermal analysis is very useful for predicting the quality of molten metal of gray cast iron. However, it cannot be used in ductile cast iron due to the following reasons.
First, in the ductile iron, as austenite solidifies ahead of graphite, the highest eutectic temperature (Tmax) does not reach to TEG even in the inoculated cup (A).
Secondly, as Te is at the same family with S and O on the periodic table, the added Te in the cup bonds Mg to make MgTe. That is, it cannot work for making chill and TEC cannot be shown.
Thirdly, it is possible to make the molten metal to gray cast iron's melt with adding Fe-S alloy, and to measure TEG and TEC. However, the influence of S on eutectic temperature is too strong. In addition, we have to prepare an extra cup every times.
Fourthly, we could not find the influence of Mg on eutectic temperature.
2. Principle of One Cup Thermal Analysis System in Ductile Iron
Figure 2 shows the influence of Si amount on TEG and TEC in gray iron12). TEG increases 4.7℃ with adding 1 percent Si and TEC decreases 11.6℃ with adding 1 percent Si.
Table 1 shows the influence of each element on TEG and TEC12). From these data, TEG and TEC can be calculated, as shown in eqs. (5) and (6).
| \[
\begin{split}
{\bf T}_{\bf EG}
&=
1149.1 (^\circ{\rm C}) + 4.7{\rm Si\%} - 4.0{\rm Mn\%} - 44{\rm P\%}\\
&\quad
+
2.7{\rm Cu\%} + 1.0{\rm Ni\%} + 1.8{\rm Co\%} + 13.9{\rm Al\%}\\
&\quad
-
17.7{\rm Mo\%} - 10.5{\rm Cr\%} - 9.3{\rm Sn\%} - 5.2{\rm Sb\%}\\
&\quad
- 6.1{\rm W\%} - 3.7{\rm Nb\%} - 14.8{\rm V\%} - 80.3{\rm B\%}
\end{split}
\] | (5) |
| \[
\begin{split}
{\bf T}_{\bf EC}
&=
1142.6(^\circ{\rm C}) - 11.6{\rm Si\%} - 0.75{\rm Mn\%} - 46.2{\rm P\%}\\
&\quad
- 1.4{\rm Cu\%} - 1.1{\rm Ni\%} - 0.7{\rm Co\%} - 1.8{\rm Al\%}\\
&\quad
- 14.5{\rm Mo\%} + 5.9{\rm Cr\%} - 6.0{\rm Sn\%} - 5.1{\rm Sb\%}\\
&\quad
- 2.8{\rm W\%} + 0{\rm Nb\%} + 3.3{\rm V\%} - 26.0{\rm B\%}
\end{split}
\] | (6) |
In the case of gray cast iron, Mn bonds S to makes MnS. This MnS does not affect T
EG and T
EC. Therefore, soluble Mn and soluble S should be calculated and be used. The calculation method for soluble Mn and soluble S in gray cast iron is reported by T. Kanno
13).
Table 1
Influence of each elements on T
EG and T
EC.
| |
TEG, ℃/% |
TEC, ℃/% |
Range, % |
| Si |
4.7 |
−11.6 |
0.28–2.44 |
| Al |
13.9 |
− 1.8 |
0–0.49 |
| (C) |
10.2 |
5.7 |
CE < 3.5 |
| Cu |
2.7 |
− 1.4 |
0.08–2.63 |
| Co |
1.8 |
− 0.7 |
0–3.18 |
| P |
−44.0 |
−46.2 |
0.07–0.35 |
| Ni |
1.0 |
− 1.1 |
0.15–2.57 |
| C |
0.0 |
0.0 |
CE > 3.5 |
| Sb |
− 5.2 |
− 5.1 |
0–2.40 |
| Mo |
−17.7 |
−14.5 |
0.06–1.87 |
| Mn |
− 4.0 |
− 0.75 |
0.44–2.69 |
| W |
− 6.1 |
− 2.8 |
0.22–2.11 |
| Sn |
− 9.3 |
− 6.0 |
0–2.86 |
| Nb |
− 3.7 |
0.0 |
0.38–1.37 |
| (S) |
−20.5 |
−10.3 |
0.16–0.44 |
| Cr |
−10.5 |
5.9 |
0.11–1.69 |
| V |
−14.8 |
3.3 |
0–1.29 |
| S |
−50.0 |
−18.0 |
0.45–0.65 |
| B |
−80.3 |
−26.0 |
0–0.50 |
This equation can be applied to ductile cast iron. In ductile cast iron, all S bonds Mg to makes MgS, so we do not consider S effect. Mg amount is small enough to be ignored. All Mn should be treated as soluble one, because Mn does not bond S and remains as soluble Mn.
Figure 3 shows the EGA measuring method with one cup thermal analysis. With the cooling curve of one cup (no addition cup), the minimum eutectic temperature at recalescence (TSC) can be searched. As explained above, we can calculate TEG and TEC from the influence of each elements on TEG and TEC. From these results, EGA can be calculated as follow; EGA = ΔT1 × 100/ΔTE.
Mg forms MgS, MgO and Mg3N2 in the molten metal of ductile iron. If the amount of S, O and N are S0.01%, O20 ppm and N52 ppm, 0.024% Mg might be used for making these compounds. If the residual Mg amount is 0.045% after spheroidizing treatment, the soluble Mg amount decreases to 0.021%. Therefore, compared with the influence of Si on TEG and TEC, that of Mg on TEG and TEC is very small enough to be ignored.
3. Experimental Method, Its Result and Consideration for One Cup Thermal Analysis in Ductile Cast Iron
3.1 Predicting graphite nodule count with one cup thermal analysis
Melting was carried out in a silica lined high frequency induction furnace of 60 kg, 3000 Hz. The basic composition was as follows: 3.7 mass%C, 2.15%Si, 0.3%Mn, 0.02%P, 0.01%S, Sb0.040% and Mg0.06%. After graphite spheroidizing treatment with sandwich method, the molten metal was returned to the furnace and was held at 1350℃. We added various kinds of inoculants (Graphite type, Ba type, Ce type, Ca-Si type and Bi type) into the molten metals, and then cast them at various fading time (0, 1, 2.5, 5.0, 7.5, 10, 15 and 20 min) into one cup (ϕ30 × H50 mm, 250 g).
Table 2 shows the chemical composition of inoculants used in the pouring test. Table 3 shows the chemical composition of spheroidizer used in the pouring test. We analyzed graphite nodule count for one cup T.P. In order to prevent dust's mixing into graphite nodule count, we cut down particles smaller than 10 micrometer. Using the cooling curve of one cup (TSC) and above equations ((5) and (6)), we calculated EGA and investigated the relationship between EGA and the graphite nodule count of ductile cast iron.
Table 2
Chemical composition of inoculants used in pouring test (mass%).
| Kinds |
C |
Si |
Ca |
Ce |
Ba |
Bi |
Al |
| Ca type |
- |
74.5 |
1.22 |
- |
0.71 |
- |
1.11 |
| Ba type |
- |
73.6 |
1.85 |
- |
2.74 |
- |
1.14 |
Graphite
type |
99.9 |
0.01 |
- |
- |
- |
- |
- |
| Ce type |
- |
72.5 |
1.40 |
1.87 |
- |
- |
0.99 |
| Bi type |
- |
71.1 |
1.37 |
- |
- |
1.80 |
0.80 |
Table 3
Chemical composition of spheroidizer used in the pouring test (mass%).
| Si |
Mg |
Ca |
RE |
Fe |
| 45 |
4.0 |
0.25 |
0.25 |
bal. |
Figure 4 shows the relationship between supercooling degree (ΔT) and the graphite nodule count (N) of CE cup. T.P. Here, Tmax means the highest eutectic temperature, and ΔT means the difference between Tmax and TSC, as shown in Fig. 3. In general, it is considered that N decreases with increasing ΔT. However, as for Ba type and Ca type inoculant, they show reverse tendency; graphite nodule count increases with increasing ΔT. As for the Bi type inoculant, it shows the same tendency with the general consideration. That is, graphite nodule count increases with decreasing ΔT.
Figure 5 shows the examples of cooling curves after fading. TSC, Tmax and the difference between them decrease with fading. As like this figure, there are two problems in ductile iron molten metal as follows; (a) Tmax does not reach to TEG, (b) TEG does not show the parallel line during the eutectic solidification.
Figure 6 shows the relationship between EGA and the graphite nodule count (N) of CE cup. T.P. As shown in eq. (7), the correlation between EGA and N is very high. Therefore, it can be said that the graphite nodule count is predicted correctly with one cup thermal analysis.
| \[
{\rm N} = 6.13 \times (\Delta {\bf T}_{\bf 1} \times 100/\Delta{\bf T}_{\bf E}) - 126
\ ({\rm r} = 0.97)
\] | (7) |
Figure 7 shows the principle of investigating shrinkage tendency (θ), with one cup thermal analysis. With differentiating one cup temperature cooling curve, a cooling rate curve is obtained. We can explain the relationship between the cooling rate curve and solidification process in one cup as follows.
At the initial stage of the eutectic solidification (①), there is an exothermic reaction due to the eutectic reaction in which graphite and austenite form from the molten metal. As this exothermic heat exceeds the radiation heat of CE cup, the cooling rate turns from minus to plus value.
The crystallized spheroidized graphite is engulfed with austenite just after the eutectic reaction. After that, the spheroidized graphite grows up with carbon diffusion through the austenite. As carbon should diffuse through the solid phase, the cooling rate becomes slow. Therefore, at the middle stage (②), as the exothermic heat becomes less than the radiation heat of CE cup, the cooling rate turns to minus value.
At the final stage (③), the eutectic cells contact each other, the remained molten metal between cells is crystallized to eutectic solid, and the eutectic solidification finishes. In this stage, as the crystallized eutectic volume is very small, the cooling rate becomes large suddenly.
At the post eutectic solidification stage (④), as sand mold has been heated during eutectic solidification, the cooling rate becomes slow. Therefore, θ shape is shown on the differentiated cooling rate curve.
When shrinkage cavity forms inside the CE cup T.P.(CE cup shown in Fig. 3, ϕ30 × H50 mm, 250 g), thermal conductivity of T.P. becomes small, because the thermal conductivity of gas is smaller than that of solid. Then, cooling speed becomes slower and the tendency (θ) becomes larger. That is, the larger the shrinkage is, the larger the θ is.
With investigating the shrinkage tendency (θ), we can predict the quality of molten metal of ductile iron. We call the angle (θ) as the shrinkage tendency parameter from the above reason (hereafter θ).
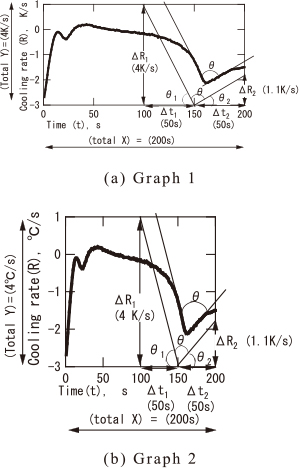
As shown in Fig. 8 (a) and (b), the shrinkage tendency parameter (θ) changes depending on the printed grape size. In order to prevent this problem, we introduced a ratio coefficient (L) between X axis and Y axis. With introducing (L), the inside value of $tan^{-1}$ ( ) becomes non-dimensional value. Therefore, the calculated (θ) of Fig. 8 (a) graph 1 shows the same value (56°) with that of Fig. 8 (b) graph 2, even though their graph sizes are different.
| \[
\begin{split}
\theta
&=
180^{\circ} - \theta_{1} - \theta_{2}=
180^{\circ} - tan^{-1}
[{\rm L} \times (\Delta {\bf R}_{\bf 1}/\Delta \boldsymbol{t}_{\bf 1})]\\
&\quad
- tan^{-1}[{\rm L} \times (\Delta{\bf R}_{2}/\Delta\boldsymbol{t}_{\bf 2})]
\end{split}
\] | (8) |
| \[
\begin{split}
&
{\rm L} = ({\rm total\ X})/({\rm total\ Y})\\
&
(s^{2}/{\rm K})
= (200\,{\rm s})/(4^{\circ}{\rm C}/{\rm s})
= 50(s^{2}/{\rm K})
\end{split}
\] | (9) |
| \[
\begin{split}
\theta
&=
180^{\circ} - tan^{-1} [{\rm L} \times (\Delta{\bf R}_{\bf 1}/\Delta\boldsymbol{t}_{\bf 1})]\\
&\quad
- tan^{-1}[{\rm L} \times (\Delta{\bf R}_{\bf 2}/\Delta\boldsymbol{t}_{\bf 2})]\\
&=
180^{\circ} - tan^{-1} [50 \times (4/50)] - tan^{-1}[50 \times (1.1/50)]\\
&=
180^{\circ} - tan^{-1}(4) - tan^{-1} (1.1)\\
&=
180^{\circ} - 76^{\circ} - 48^{\circ} = 56^{\circ}
\end{split}
\] | (10) |
With investigating θ, we predicted the quality of molten metal of ductile cast iron. We poured spheroidized molten metal into a cone type mold (Fig. 9(a)) and the above one cup T.P., at the same time. The cone type T.P. has been being used as the shrinkage investigating T.P. However, halving the T.P. and measuring the volume of shrinkage with filling water is not easy and shows large scattering. It is desirable that we quit shrinkage T.P. and use one cup thermal analysis. As mentioned later, in one cup thermal analysis, halving the T.P. is simple and its shrinkage size can be evaluated with measuring shrinkage formed area.
The composition of molten metal, inoculants and spheroidizer are the same with that of the graphite nodule count test.
We measured shrinkage volume from the cone T.P., and measured θ and EGA with one cup thermal analysis, and investigated the correlation between them.
Figure 10 shows the relationship between shrinkage volume of cone type T.P. and θ of one cup T.P. in ductile cast iron. A good correlation is shown. For the reference, θ in gray cast iron is also plotted in the graph. In the gray cast iron, shrinkage does not form and θ is $55\pm 10^{\circ}$. It is considered that shrinkage does not form even in the ductile cast iron, if θ is as small as $55 \pm 10^{\circ}$.
Figure 11 shows the relationship between nodule count, EGA and θ in one cup. Figure 12 shows the relationship between EGA, θ, nodule count and shrinkage shape, when investigating the vertical section of CE cup (ϕ30 × H50 mm, 250 g). It is possible to predict the shrinkage with using CE cup, not with large cone type T.P. That is, the shrinkage does not form in the CE cup on the following conditions; (a) more than 90% EGA, (b) smaller than 55°θ and (c) more than 450/mm2 graphite nodule count.
It is possible to measure EGA, graphite nodule count and shrinkage tendency parameter (θ) with one cup thermal analysis. Therefore it can be said that one cup thermal analysis is a good method to predict the quality of molten metal (graphite nodule count and shrinkage tendency parameter (θ)) correctly before pouring.
4. Conclusion
We have developed one cup thermal analysis and investigated if we can predict the quality of molten metal in ductile cast iron. The results are as follows.
-
(1)
With calculating TEG and TEC from chemical composition, and with measuring TSC from one cup cooling curve, it is possible to measure EGA even in ductile cast iron.
-
(2)
A good correlation is shown between EGA and graphite nodule count (N).
-
(3)
There is a good correlation between EGA and shrinkage tendency parameter (θ) in cone type shrinkage T.P.
-
(4)
As for CE cup T.P., if EGA exceeds 70%, θ begins to decreases suddenly. And if EGA exceeds 90%, it becomes low near 55° which is that of gray cast iron.
-
(5)
As for CE cup, there is also a good correlation between actual shrinkage volume and θ.
-
(6)
One cup thermal analysis a good method for predicting the quality of molten metal (graphite nodule count and shrinkage tendency (θ)) even in ductile cast iron before pouring.
REFERENCES
- 1) K. Taniguchi: Tetsu-to-Hagané 19 (1932) 952–980. 10.2355/tetsutohagane1915.18.9_952
- 2) Cast iron board of JFES: IMONO 41 (1969) 1003.
- 3) S. Okada, Y. Maehashi, S. Wakamatsu and Y. Ishida: IMONO 44 (1972) 107–118.
- 4) K. Abe:Sougoimono (1975) 25
- 5) C.R.Loper, R.W.Heine and M.D. Chaudhari: Proceedings of the Second International Symposium on the Metallurgy of Cast Iron, Geneva,Switzerland, May 29–31, (1974) pp. 639–657.
- 6) E.F. Ryntz, Jr., J.F. Janowak, A.W. Hochstein and C.A. Wargel: AFS Transaction 79 (1971) 79.
- 7) W. Oldfield: B.C.I.R.A. Journal 10 (1962) 17–27.
- 8) K. Kishitake, T. Owadano and K. Miyamoto: IMONO 53 (1981) 295–299.
- 9) K. Nakamura: Sokeizai 27 (1986) 26.
- 10) T. Kanno, Y. Fukuda, I. Kang, M. Morinaka and H. Nakae: J. JFS 70 (1998) 773–778.
- 11) T. Kanno and H. Nakae: J. JFS 72 (2000) 175–180.
- 12) T. Kanno, Y. Fukuda, M. Morinaka and H. Nakae: J. JFS 70 (1998) 465–470.
- 13) T. Kanno, I. Kang, T. Mizuki and H. Nakae: J. JFS 73 (2001) 441–446.