3. Results and Discussion
3.1 Chemical composition and initial retained austenite in weld metal
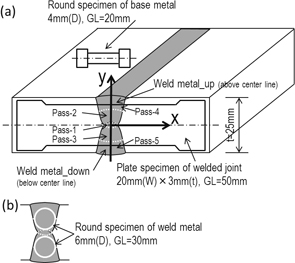
The weld metal is composed of five passes. Because the dilution ratio of the base metal is different for each pass (the first pass, i.e., the center of the weld metal, has the largest dilution ratio), the chemical composition is not uniform. The chemical composition of five places was measured. The five locations are on the y axis (cf. Fig. 1(a)). The center of the weld metal (half the thickness of the weld metal) is taken as the origin of the y axis. The coordinates of the five locations and the corresponding chemical composition are given in Table 2. Table 2 demonstrates that the chemical composition along the thickness direction, especially Ni and Cr, is not uniform. The Ni and Cr contents at the center (y = 0) are the lowest.
Table 2
Chemical composition distribution in multi-pass weld metal (in mass%).
| y (mm) |
C |
Si |
Mn |
Ni |
Cr |
Mo |
| 10 |
0.054 |
0.74 |
0.83 |
6.43 |
14.33 |
0.036 |
| 5 |
0.066 |
0.67 |
0.95 |
5.27 |
11.67 |
0.13 |
| 0 |
0.080 |
0.61 |
1.03 |
4.46 |
9.87 |
0.20 |
| −5 |
0.065 |
0.70 |
0.89 |
5.70 |
12.69 |
0.094 |
| −10 |
0.055 |
0.72 |
0.85 |
6.25 |
13.85 |
0.052 |
Two plate tensile specimens (specimen 1 and specimen 2 shown in Table 3) were used to evaluate the mechanical stability of retained austenite within the elastic region and plastic region, respectively. The initial amounts of retained austenite of five points on the y-axis (cf. Fig. 5 and Fig. 7) were measured. The results are given in Table 3. The locations near the center of the weld metal (specimen 1: y = 2.0 mm and y = −1.3 mm; specimen 2: y = 1.3 mm and y = −1.7 mm) have low amount of retained austenite. It has been shown that the amount of retained austenite is related to the chemical composition, especially Ni and Cr contents: low Ni and Cr contents corresponding low amount of retained austenite.6) This is because Cr and Ni are the elements elevating the stability of austenite. Elevated thermal stability by increasing the amount of Cr and Ni inhibits the phase transformation from austenite to martensite. Low Ni and Cr contents cause the center of the weld metal to have the lowest amount of retained austenite.
Table 3
Initial amounts of retained austenite in multi-pass weld metal.
| y (mm) |
initial RA
in Specimen 1 (%) |
|
y (mm) |
initial RA
in specimen 2 (%) |
| 6.7 |
13.9 |
|
7.6 |
18.9 |
| 2.0 |
5.5 |
|
3.8 |
16.9 |
| −1.3 |
4.9 |
|
1.3 |
7.0 |
| −4.2 |
27.4 |
|
−1.7 |
6.8 |
| −7.4 |
17.0 |
|
−7.3 |
21.6 |
RA, retained austenite
Specimen 1, for elastic region measurement; specimen 2, for plastic region measurement
The mechanical stability of retained austenite in a welded joint is dependent not only on the retained austenite itself, but also on the deformation performance of the welded joint. The deformation of the welded joint used in this study has been investigated in detail elsewhere by tension test.13) The obtained results in Ref. 13) directly correlate with the variation in the amount of retained austenite in the weld metal. The results are briefly stated as follows.
The tensile properties of the base metal and weld metal were evaluated, and the nominal stress versus nominal strain curves (S-S curves) are shown in Fig. 2. The 0.2% proof stress ($ \sigma_{0.2}$), tensile strength (TS), ratio of $ \sigma_{0.2}$ to TS ($ R = \sigma_{0.2}/{\rm TS}$), and uniform elongation are summarized in Table 4. There is great difference between the base metal and the weld metal in the shape of the S-S curve. The weld metal has a much larger gradient than the base metal within the range from the yielding point (denoting as ${\sigma _{0.2}}$ in this study) to the maximum stress point. It also has smaller R values than the base metal. The gradient and R value are parameters reflecting the work-hardening ability―the higher the gradient (or the smaller the R value), the stronger the work-hardening ability. The larger gradient and smaller R values indicate that the weld metal has a much stronger work-hardening ability than the base metal. The increased work-hardening ability is attributed to the stress- or strain-induced martensite transformation from the retained austenite.7)
Table 4
Tensile properties.
13)
| material |
σ0.2 (MPa) |
TS (MPa) |
R = σ0.2/TS |
uniform
elongation (%) |
| base metal |
1035 |
1059 |
0.977 |
5.4 |
| weld metal (up) |
419 |
1202 |
0.349 |
5.5 |
| weld metal (down) |
461 |
1216 |
0.379 |
5.5 |
| welded joint |
889 |
1043 |
0.852 |
5.4 |
σ0.2, 0.2% proof stress; TS, tensile strength; R, ratio of σ0.2 to TS
Table 4 shows that the weld metal and base metal have different yield and tensile strengths. If classifying the welded joint used according to the tensile strength level, it is an over-matching welded joint (i.e., TS of the base metal < TS of the weld metal).
The welded joint is composed of the base metal (BM), heat-affected zone (HAZ) and weld metal (WM). Previous research13) shows that the HAZ has the lowest strength. The difference in strength levels in the three parts determines that the deformation performance of the whole welded joint is dependent on the combination of the three parts instead of single part. Tension test on the welded joint was performed, and the stress versus strain curve is also shown in Fig. 2. The strain is an average value over the gage length of 50 mm (including the BM, HAZ and WM) measured by an extensometer.
Necking occurred in the base metal. As necking proceeded, the plate tensile specimen fractured in that location. It is noted that the extensometer used was taken off before the final failure in order to prevent it from the shock of the fracture, and thus, the S-S curve of the welded joint in Fig. 2 is only part of the whole tension process. The $ \sigma_{0.2}$, TS, R and uniform elongation of the welded joint are also summarized in Table 4. The $ \sigma_{0.2}$ and R of the welded joint are larger than those of the weld metal, and smaller than those of the base metal. Apparently, this is the result of the compromise of the BM, HAZ and WM. Necking and final failure in the base metal make the base metal control the tensile strength of the welded joint, which has been verified from the fact that the TS of the welded joint is almost the same as that of the BM. The difference in the fracture elongation between the welded joint and the BM shouldn't be great. However, Fig. 2 shows that the ductility of the welded joint seems to be much inferior to that of BM. This misleading is caused by the two facts: ① the S-S curve of the welded joint does not cover the whole tension process; ② the S-S curve of the welded joint was obtained from the plate specimen while that of the BM was from the round specimen.
The nominal strain used for the S-S curve of the welded joint in Fig. 2 reflects the combination of the BM, HAZ and WM. It does not reveal the strain evolution in each part. Local strains in the three parts were investigated by two-dimensional digital image correlation (2D-DIC) in Ref. 13), and the results are given in Fig. 3. There are five circles: circles 1 and 2 are, respectively, in the left and right sides of the BM; circles 3 and 4 are in the center and down parts of the WM, respectively; circle 5 is in the HAZ. Average strains measured with 2D-DIC within the five circles are compared with the average strain over the gage length of 50 mm evaluated by an extensometer. The ordinate and abscissa represent the local strain in a specific place and the whole strain across the welded joint (BM, HAZ and WM), respectively. The data above the diagonal line (dotted line) mean that the local strains are larger than the average strain of the welded joint. In other words, strain concentrations occurred in these local sites. Figure 3 indicates that only the BM in the right side (i.e. circle 2) has no strain concentration during the whole tension process. Strain concentration in the HAZ (circle 5) is the most serious. At low strain levels, the strain concentration occurred in the center of the WM (circle 3); above ~0.02, the strain in this region is the lowest in the welded joint.
Figure 3 also shows a tendency that when the engineering strain of the welded joint (abscissa) exceeds 0.07, the local strains of circles 1–5 remain constant. As mentioned before, necking occurred in the base metal. After necking, deformation began to concentrate in that position, and other parts stopped continuing deformation. This causes the local strains in Fig. 3 keep constant above the strain of 0.07. Because the necking position is beyond the area of 2D-DIC measurement, strain concentration in that region is not reflected in Fig. 3.
3.3 Mechanical stability of retained austenite
3.3.1 Stress-induced martensite transformation below yield strength
The mechanical stability of retained austenite in the weld metal of a welded joint can be assessed using two types of tensile specimen―a pure weld metal specimen or a welded joint specimen (cf. Fig. 1). The former type is machined only from the weld metal. The deformation in it is determined only by the weld metal itself. The effect of mismatching the BM, HAZ and WM is not involved. For this reason, the variation in the amount of retained austenite in the tension process reflects the mechanical stability of retained austenite only in the weld metal, not in a welded joint. In Refs. 7) and 14), this type of specimen was used to evaluate the mechanical stability of retained austenite in the Cr-Ni weld metal. In this study, our focus is on the performance of retained austenite in a welded joint under a service load, and thus a plate tensile specimen of the welded joint shown in Fig. 1(a) was used.
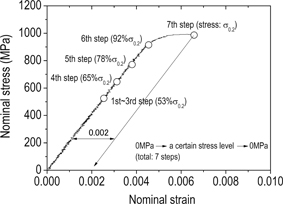
Suppose the service load is not fixed: it varies within the range of 0 to 0.2% proof stress of the welded joint ($ \sigma_{0.2}$). Figure 4 shows the loading history.
The plate specimen was tensioned to a certain stress level from the initial state and then unloaded. In the tension process, the retained austenite partially transformed into martensite. Because the plastic deformation was extremely minor, this phase transformation is regarded as the stress-induced martensite transformation. The amount of retained austenite after this tension process was measured by XRD. This process was repeated seven times. The whole experimental process is briefly as follows (cf. Fig. 4): (step 1) the specimen was tensioned to the stress level of $0.53 \sigma_{0.2}$ from the initial state, followed by unloading and XRD measurement (i.e., 0 MPa → $0.53 \sigma_{0.2}$ → 0 MPa → XRD measurement); (step 2) 0 MPa → $0.53 \sigma_{0.2}$ → 0 MPa → XRD measurement; (step 3) 0 MPa → $0.53 \sigma_{0.2}$ → 0 MPa → XRD measurement; (step 4) 0 MPa → $0.65 \sigma_{0.2}$ → 0 MPa → XRD measurement; (step 5) 0 MPa → $0.78 \sigma_{0.2}$ → 0 MPa → XRD measurement; (step 6) 0 MPa → $0.92 \sigma_{0.2}$ → 0 MPa → XRD measurement; (step 7) 0 MPa → ${\sigma _{0.2}}$ → 0 MPa → XRD measurement.
The initial amount of retained austenite on the five locations (points A–E in Fig. 5) is given in Table 3 (Specimen 1). The amount of retained austenite against the maximum stress level of each step is given in Fig. 5. It should be noted that the amount of retained austenite is the average value over a horizontal line passing the corresponding point (A–E) with a length of 1 mm.
The initial amount of retained austenite (applied stress = 0) along the y axis is not uniform. The center of the weld metal (B and C) has the lowest value (~5%). A, D, and E points have a higher initial amount of retained austenite. As the stress level increases, the retained austenite with a higher volume fraction (A, D, and E) continuously transforms into martensite. However, when volume fraction is low, for example, B and C, there is almost no change in the amount of retained austenite from the initial state to $ \sigma_{0.2}$, indicating that almost no stress-induced martensite transformation occurs. Figure 5 shows that in practical service, when applied stress attains $ \sigma_{0.2}$, a large amount of retained austenite has transformed into martensite, and less than ~12% austenite is retained.
3.3.2 Strain-induced martensite transformation until failure of tensile specimen
After the yield point, plastic deformation becomes dominant, and the untransformed austenite probably continues to transform into martensite by the plastic strain. After failure of the tensile specimen, how much austenite is still retained is our concern.
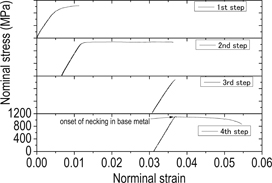
A method similar to that in the above section was applied. The specimen was tensioned four times, and the four steps are illustrated in Fig. 6. In step 4, when stress attained the maximum value, necking began to occur in the base metal (the strain is 0.037 at this point).
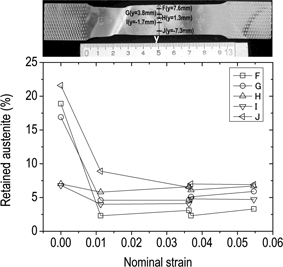
The amount of retained austenite is plotted against the maximum strain in each tension step in Fig. 7. It is noted that the strain is also the whole strain across the BM, HAZ and WM (GL = 50 mm). The five points (F-J) can be classified into two groups according to the initial amount of RA: low initial amount point (H and I, near the center of weld metal) and high initial amount point (F, G, and J, apart from the center of weld metal). For the former, almost no change in the amount of RA during the whole tension process; for the latter, significant variation in the amount of RA only occurred within the strain range of 0 to 0.01, beyond that range almost no change in the amount of RA. The results indicate that the RA with low initial amount is stable and it will not transform into martensite. The same tendency is also shown in Fig. 5. The RA with high initial amount is metastable.
Chemical composition and grain size are known to be correlated with the stability of austenite. Chemical composition in the weld metal is not uniform. Table 2 shows that the contents of Cr and Ni increase as the distance from the center of the weld metal increases. High Cr and high Ni corresponds to the locations with higher amount of RA. High Cr and high Ni should elevate the stability of RA, but the RA in the locations is metastable. Significant difference in grain size for the RA along the thickness of weld metal is not found according to the microstructure observation. Therefore the Cr/Ni contents and the grain size of RA are not responsible for the low mechanical stability of RA with higher initial amount.
Weld metal is composed of martensite and RA. Soft RA is surrounded with hard martensite. Under the applied force, strain or stress prefers to concentrate in the RA than martensite, inducing nonuniform local strain or local stress. The evolution of local strain in the multi-pass weld metal is given in Fig. 3. It can be seen that the local strains along the thickness of WM are not uniform; the local strain in the weld metal apart from the center is almost three times of that in the center of WM (cf. circle 3 and circle 4 in Fig. 3). In the strain range of 0 to 0.01 (whole strain across the welded joint), the local strain increment is great. When strain exceeds 0.01, there is no local strain change in the center of WM, and the increment becomes small in the WM apart from the center. Within the strain range of 0 to 0.01, the significant strain increment leads to the great decrement in the amount of RA for points F, G and J.
In summary of Figs. 5 and 7, when applied stress attains $ \sigma_{0.2}$, a large amount of retained austenite has transformed into martensite, and at most, ~12% retained austenite is available; after further tensioning, plastic deformation becomes dominant, and strain-induced martensite transformation begins to occur, but the amount of formed martensite is low. After complete failure of the specimen, at most, ~7.5% austenite is retained.
In the present study, the weld joint is an over-matching type. This means that after necking, plastic deformation concentrates in the base metal, and the weld metal ceases to further plastically deform. If the welded joint is an under-matching type (TS of the weld metal < TS of the base metal), because the weld metal has low strength, deformation will concentrate in the weld metal and finally fracture in it. In this case, the retained austenite will experience extremely severe local plastic strain, and it probably completely transforms into martensite. Previous research7) has confirmed that when severe plastic strain imposes on the retained austenite in the Cr-Ni weld metal, it will completely transform into martensite. Obviously, over-matching type is beneficial to maintain the RA.