Relationship among Elongation, Work Hardening Behavior and Dislocation Characteristics of Al–Mg–Si Series Alloys
2019 年 60 巻 1 号 p. 68-73

詳細
2019 年 60 巻 1 号 p. 68-73
Dislocation multiplication and dynamic recovery in the tensile deformed Al–Mg–Si–Cu alloys were characterized by transmission electron microscope (TEM), to reveal the correlation between the dislocation characteristics and the elongation behaviors. 6016 (Al–0.4%Mg–1.0%Si–0.2%Cu (mass%)) and 6014 (Al–0.6%Mg–0.7%Si–0.1%Cu) alloys were aged at 363 K for 18 ks after solution treated and quenched into water. The maximum n-value of 6016 alloy was found higher than that in the 6014 alloy. The n-value reduction rate after reaching its maximum of 6016 alloy was found smaller than that of 6014 alloy. Furthermore, the dislocation multiplication on {111} plane and the formation of dislocation band were formed in 6016 alloy with more than 10% of tensile deformation. Therefore, the slip lines observed by scanning electron microscope (SEM) are finely formed. The homogeneous dispersion of slip lines are probably the cause of higher elongation of 6016 alloy than that of 6014 alloy. It is believed that suppression of the cross slip dislocation may contribute to a higher elongation.
This Paper was Originally Published in Japanese in J. JILM 68 (2018) 201–205. In order to explain tensile properties clearly, Tables 2 and 3 were added. In order to explain the previous studies more precisely, references 1, 2, 7, 13, 14, 17, 18 and 19) were added.
In recent years, 6000 series aluminum alloys have intensively been applied for automobile to meet the demand of minimizing the environmental impact by improving the fuel efficiencies with reduction in the body weight.1) It is still difficult to replace all steel parts of automobiles due to the press formability of aluminum alloys inferior to that of steel, thus it is necessary to improve their ductility and work hardenability having strong correlation with multiplication and dynamic recovery of dislocations during the plastic deformation.2)
There have been several researches with respect to the dislocation characteristics during the tensile deformation for Al–Mg–Si alloys.3–7) For example, Al–0.5%Mg–x%Si (0.5 ≦ x ≦ 1.5) alloys with high Si concentration exhibit low reduction rate of work hardening index (n-value) and formation of the microbands which indicates the dynamic recovery of dislocations was suppressed in the late stage of tensile deformation.3) Uchida et al. investigated 8% tensile-deformed Al–Mg–Si alloys and showed that the ductility of Al–0.5%Mg–1.6%Si alloy was found higher than that of Al–0.5%Mg–0.5%Si alloy due to the homogeneous distribution of dislocation and the suppression of forming microbands by extra addition of Si.4) In addition, it has also been reported by several researchers that the addition of Mn to Al–Mg–Si alloys caused the reduction of ductility due to the formation of microbands from Al–Mn dispersoids during the tensile deformation.3,5) Therefore, fine distribution of microbands and improved ductility were observed in Al–Mg–Si–Mn alloys with small grains and Al–Mn dispersoids processed by rapid solidification, which suggested that a fine dispersion of dispersoids might suppress the local aggregation of dislocations.5)
In the case of age hardened Al–Mg–Si alloys,6–8) obvious dislocation cell structures were observed in the as-quenched (non-aged) condition with yield stress of 62 MPa and elongation of 31% at the TEM image of the 10% tensile strained specimen. On the other hand, dislocations entangled with β′′ phase particles were observed in the aged alloy with yield stress of 325 MPa and elongation of 15%.6)
To investigate dislocations by TEM is one of the effective methods so that to understand the ductility and work hardening behavior of aluminum alloys. On the other hand, the relationship between dislocation characteristics and ductility depends on the strength and the strain of specimens at which TEM observation is conducted. No previous study has compared Al–Mg–Si alloys with only different in elongation.
In this study, multiplication and dynamic recovery behavior of dislocations in Al–Mg–Si alloys were observed by TEM. In fact, Al–Mg–Si alloys with the same strength and different elongation were investigated in order to clarify the relationship between the dislocation characteristics and the formability, such as ductility and work hardenability.
Two alloys with different Mg/Si ratio, 6016 and 6014 alloys, whose chemical compositions of the alloys are listed in Table 1, were examined. Both alloys were manufactured through casting, homogenized, hot-rolled and cold-rolled down to a thickness of 1.0 mm. Tensile specimens (JIS Z2241 Type 13B), prepared with the tensile direction parallel to the rolling direction, were solution treated in 823 K for 1.8 ks and quenched into water at room temperature. The repeatability of the tensile properties may be deteriorated by the temperature and the holding time before tensile test because the formation of solute clusters starts soon after a solution heat treatment.9) Such variation of tensile properties can be suppressed by an age treatment soon after solution heat treatment called pre-aging.9) For that reason, specimens were aged at 363 K for 18 ks soon after the solution heat treatment followed by water quenching before the tensile test to ensure the sufficient repeatability of tensile properties. Tensile tests were carried out under room temperature using AG-50kNIS (SHIMADZU, Japan) with an initial strain rate of 0.1/min. Nominal stress-strain curves were approximated by quartic equation to identify the accurate values of uniform and local elongation. The strain at the maximum nominal stress was defined as uniform elongation, whereas the elongation obtained by subtracting the uniform elongation from the total elongation was defined as the local elongation. The true stress-strain curves were also approximated by a quartic equation and then n-values (work hardening index) were calculated by 2 point method for every plot of true stress-strain curves quasi approximation to investigate the variation of n-value during the tensile deformation.10) Tensile deformed specimens with true strains of 2%, 5%, 10%, and 18% were observed by TEM to clarify the dislocation characteristics during tensile deformation. Specimens near the end of uniform deformation, as true strain of 18% for 6014 alloy and 20% for 6016 alloy, were subjected to field emission scanning electron microscope (FE-SEM) observation. TEM observation was carried out using an aberration correcting transmission electron microscope JEM-ARM 200 F (JEOL Ltd., Japan) with an acceleration voltage of 200 kV. The incident direction of TEM was ⟨110⟩ to define the {111} planes from the electron diffraction image. FE-SEM observation was carried out using JSM-7000F (JEOL Ltd., Japan). A cross section parallel to the rolling (tensile) direction (ND-RD cross section) was observed at an acceleration voltage of 5 kV. Grain size and distribution of crystal orientations were investigated by electron backscatter diffraction (SEM/EBSD) method. SEM/EBSD was carried out using JSM-7100F (JEOL Ltd., Japan), with a step size of 1 µm from the cross-section in the rolling direction (ND-TD cross section), and analyzed by OIM (TSL, Japan) Ver. 7.2.
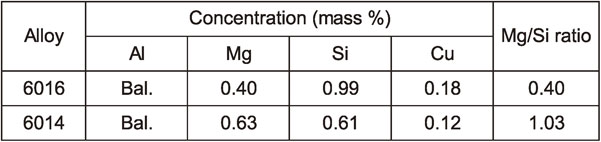
Figure 1 shows the stress-strain curves of 6016 and 6014 alloys. Table 2 shows tensile properties. Yield stress of both alloys is almost the same. 6016 alloy shows higher ductility than 6014 alloy.
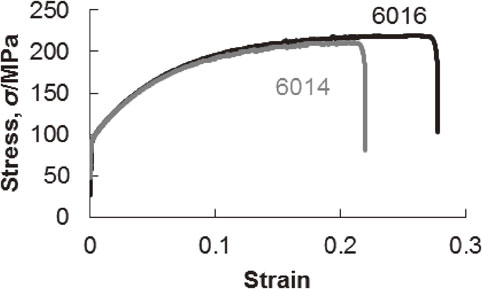
Stress-strain curves of 6016 and 6014 aluminum alloys.

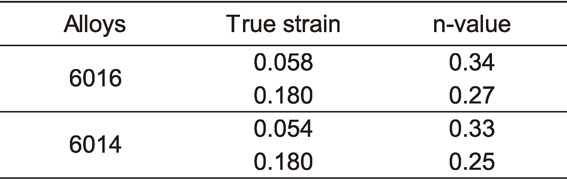
Table 3 and Fig. 2 show the variation of n-value in the alloys calculated from the true stress and the true strain. Both alloys showed the same variation behavior of n-value, such the n-value initially increases until the true strain of about 5% and then decreases. The reduction of n-value from the maximum to the n-value at the true strain of 18% calculated by the eq. (1) below is 21.7% for 6016 alloy and 25.3% for 6014 alloy. These results indicate that the reduction of n-value after the maximum in 6016 alloy is gentler than that in 6014 alloy.
| \begin{equation} (\text{nmax} - \text{n0.18})/\text{nmax} \times 100 \end{equation} | (1) |
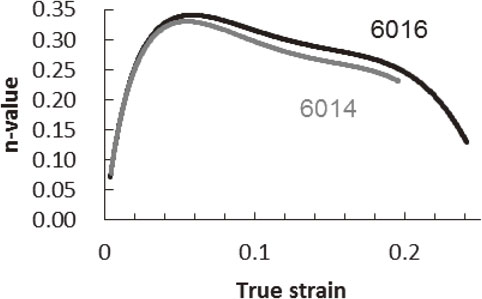
n-value variation during the tensile deformation in 6016 and 6014 aluminum alloys.
Figure 3 shows the IPF maps of 6016 and 6014 alloys analyzed by SEM/EBSD. The distribution of grain size is shown in Fig. 4. The average grain size of the alloys is almost the same, as 26.7 µm for 6016 alloy and 25.3 µm for 6014 alloy. Also, little difference is found in the grain size distribution between the alloys.
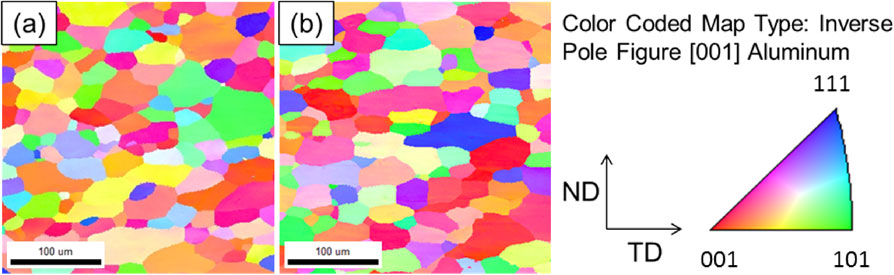
Inverse pole figure maps of (a) 6016 and (b) 6014 aluminum alloys.
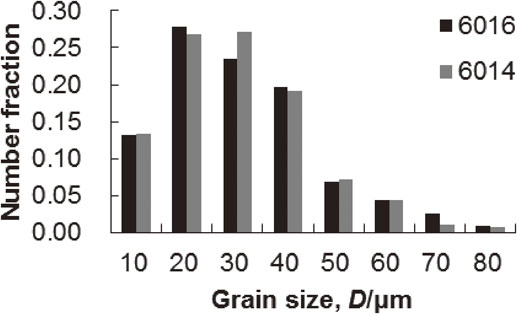
Grain size distribution of 6016 and 6014 aluminum alloys.
Figure 5 shows distribution of textures in the alloys calculated by the crystallite orientation distribution function (ODF) method. Here, six types of main textures, Goss ({011} ⟨100⟩), Brass ({011} $\langle 2\bar{1}1\rangle $, Cube ({001} ⟨100⟩), S ({132} $\langle 6\bar{4}3\rangle $), Cu ({112} $\langle \bar{1}\bar{1}1\rangle $) and Rotated-Cube ({001} $\langle 15\bar{7}0\rangle $), were selected, and intensities of each texture were extracted with the boundary of 15° from the ideal orientation. The intensity of the Cube texture is the highest in both alloys and the value is almost equal in both alloys. Among the other textures, the intensity of the Cu texture in 6016 alloy is 3.5% lower by than that in 6014 alloy.
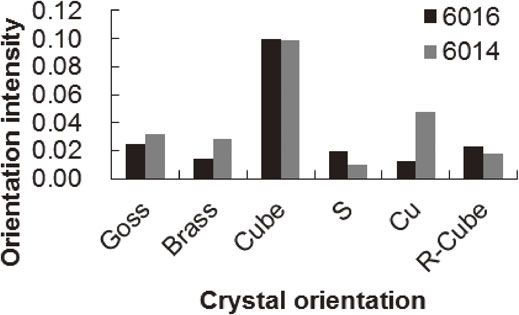
Crystal orientation distribution of 6016 and 6014 aluminum alloys.
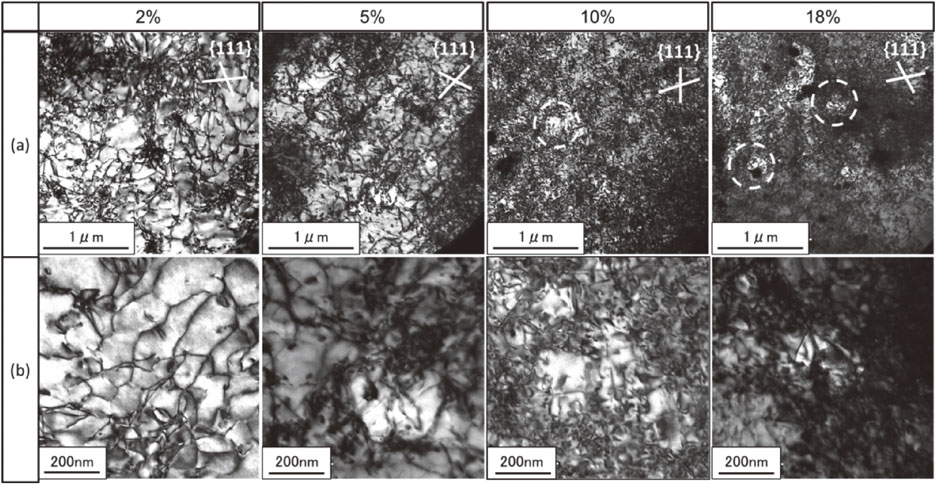
Figures 6 and 7 show TEM bright field images of 2%, 5%, 10% and 18% strained 6016 and 6014 alloys respectively. The electron beam incident direction was maintained at ⟨110⟩, so that the crossing lines written on the right upper corner of the images indicate {111} planes. In the case of 6016 alloy, linear dislocations along the {111} plane were observed when the tensile strain applied was between 2% and 5%. The band shaped dislocation structures along {111} planes are indicated by the arrows in the Fig. 6(a). These band shaped structures appear when the tensile strain was 10% or more. On the other hand, in the case of 6014 alloy, intersection and curvature of the dislocations are observed frequently from the 2% tensile strained condition. These structures observed in 6014 alloy are considered to be the cross slips and resulting entanglement of the dislocations. Moreover, dislocation cell structures surrounded by dotted circles in the Fig. 7, as well as overall multiplication of the dislocations were observed when the tensile strain was 10% or more in 6014 alloy. Figures 8 and 9 show FE-SEM images of the central portion of the thickness in 20% tensile strained 6016 alloy and 18% tensile strained 6014 alloy, respectively. Homogeneous dispersion of the slip lines having a width of 0.5 µm are observed in 6016 alloy at the strain near the end of the uniform deformation. On the other hand, not such fine slip lines but coarse deformation structures having a width of 1.5 µm are observed in some areas in 6014 alloy, which are considered to be the slip lines coarsened according to the progress of deformation.
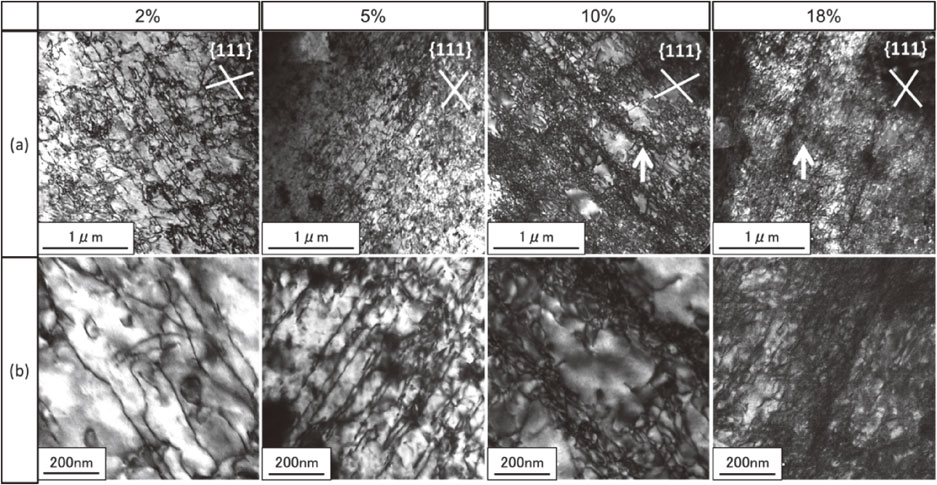
TEM bright field images of 2%, 5%, 10% and 18% strained 6016 aluminum alloy ((a) Low and (b) high magnification).
TEM bright field images of 2%, 5%, 10% and 18% strained 6014 aluminum alloy ((a) Low and (b) high magnification).
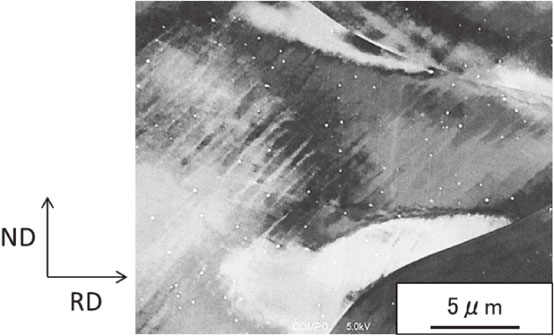
SEM image of 20% tensiled 6016 aluminum alloy.
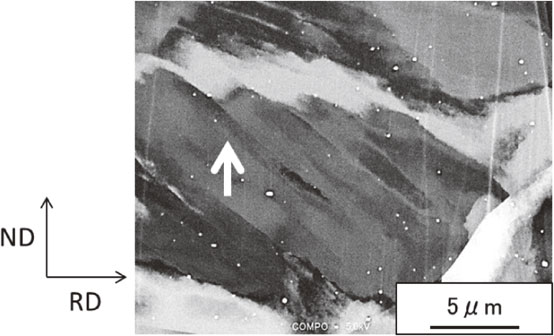
SEM image of 18% tensiled 6014 aluminum alloy.
Numbers of researches have been conducted to study the relationship between the grain size and the tensile properties.11–14) Ikeno et al.11) investigated the Al–Mg–Si alloys with the average grain size of 60 µm to 200 µm. They revealed that as the average grain size is smaller, the intergranular fracture is suppressed, so ductility increases. They also revealed that the coarsening of crystal grains increases the width and height of the slip bands.
Moreover, large numbers of studies has also been carried out to investigate the relationship between the crystal orientation and the mechanical properties.15–19) It was revealed that the increase of the Cube texture intensity suppresses the formation of shear bands during the bending deformation, resulting in good bendability in the Al–Mg–Si alloy.15) Furthermore, Matsuda et al.16) suggests that the intergranular fractures during tensile deformation occur at the grain boundaries of adjacent grains with greatly different Schmid factors.
Namely, the elongation and work hardenability of aluminum alloys are considered to be influenced by the microstructures, such as grain size and crystal orientation. However, in this study, the average grain size and the distribution of grain size in 6016 and 6014 alloys are almost the same as shown in Fig. 4. Therefore, it is considered that the difference in elongation of both alloys is not due to the difference in the grain size. As for the crystal orientation, the intensity of the Cu texture is lower in 6016 alloy than that in 6014 alloy as shown in Fig. 5. However, it is impossible to determine whether the areal fraction of 3.5% is significant difference or not because no present study investigated the effects of the intensity of only Cu texture on the tensile properties in Al–Mg–Si alloy. So, the relationship between the crystal orientation and the tensile properties in 6016 and 6014 alloys is future issue to be examined.
4.2 Transition of dislocation structure during the tensile deformationIn the variation behavior of the n-value in 6016 and 6014 alloys during tensile deformation, it is revealed that the maximum n-value is higher and the reduction rate of the n-value after the peak is smaller in 6016 alloy than those in 6014 alloy (Table 3 and Fig. 2). From these results, it is considered that the amount of work hardening from the low strain level is large and dynamic recovery progresses slowly in 6016 alloy compared to those in 6014 alloy.
Furthermore, the results of TEM observation in tensile strained specimens suggest that the cross slips of dislocations are not frequent in 6016 alloy with comparison to 6014 alloy. Moreover, FE-SEM observation revealed that uniform and fine slip lines are observed in 6016 alloy at the strain near the end of the uniform deformation. Ito et al.20) investigated the relationship between the tensile properties and deformation structures in Al–4.4%Zn–1.4%Mg alloy using SEM and TEM. In that study, it was revealed that the distribution of the slip lines is homogeneous and fine in the 1% Cu added alloy with high ductility.20) Therefore, in this study, it is assumed that 6016 alloy shows higher tensile elongation than 6014 alloy because the slip lines observed in the FE-SEM image of 6016 alloy is homogeneous and fine.
In the present study on the Stainless alloys,21) the dislocations were observed by TEM in the tensile strained samples. It was revealed that the dislocations concentrate on some specific slip planes in the Fe–18%Cr–14%Ni alloy exhibiting high work hardenability and elongation with comparison to the Fe–42%Ni alloy. From this also, it is considered that the suppression of the cross slips of dislocations contributes to the suppression of the dynamic recovery of dislocations, resulting in high ductility. In that study,21) the stacking fault energy (SFE) differs in both alloys, as 120 mJ/m2 for Fe–42%Ni alloy and 20 mJ/m2 for Fe–18%Cr–14%Ni alloy. Therefore, they suggest that the cross slips of dislocations easily occur in the Fe–42%Ni alloy due to its high SFE. It is known as results of first principle calculation that the solid solution of Mg and Si decreases the SFE of aluminum.22,23) And it is also revealed that the reduction amount of SFE by solid solution is larger in Si than Mg. For example the SFE of pure aluminum, Al–2.08%Mg and Al–2.08%Si are 146 mJ/m2, 145 mJ/m2 and 139 mJ/m2 respectively.23) For this study, comparing the alloy compositions, the Mg/Si ratio of 6016 alloy is lower than that of 6014 alloy whereas the total solute concentration is almost the same in both alloys. Therefore, the SFE of 6016 alloy is supposed to lower than that of 6014 alloy. Consequently, one of the reasons why the cross slips of dislocations are suppressed in 6016 alloy is its low SFE compared to 6014 alloy due to its composition of low Mg/Si ratio. In this study, solute clusters should be formed in both 6016 and 6014 alloys because an age treatment at 363 K for 18 ks was conducted after solution heat treatment. In the case of Al–0.6%Mg–1.0%Si alloy aged at 363 k for 18 ks after the solution heat treatment, 3DAP analysis revealed that the ratio of solute atoms spent on the formation of solute clusters are 14% for Si and 21% for Mg.24) For this study also, about 80% of Mg and Si atoms in 6016 and 6014 alloys are supposed to be in solid solute condition in the matrix. It is considered that the effect of SFE due to the alloy composition on the dislocation activity is important. On the other hand, previous studies suggest that the dislocation activity is varied by the dispersion condition of solute clusters in Al–Mg–Si alloys.6,7) One of the future issues to be examined is to divide the effects of solid solute atoms in the matrix and solute clusters on ductility and work hardenability and to clarify their mechanisms.
The variation of work hardening incident (n-value) and dislocation characteristics during tensile deformation were compared in 6016 and 6014 aluminum alloys which exhibit same yield stress and different elongation. The conclusions are below.