Development of Electrodeposition Process Based on Chloride Electrolytes for Bulk Pure Fe with Plastic Deformability
2019 年 60 巻 1 号 p. 130-135

詳細
2019 年 60 巻 1 号 p. 130-135
Contamination with sulfur causes deterioration of the mechanical properties of electrodeposited nanocrystalline iron (Fe) and its alloys. However, it is difficult to avoid this contamination for electrodeposition from a sulfate bath. In this study, we explored the processing parameters required to produce thick plates of electrodeposited Fe from a chloride bath containing no sulfur and examined the resulting mechanical properties. In a simple bath consisting only of iron chloride, the long electrodeposition required to produce bulk samples could not be performed due to the precipitation of hydroxide, which caused the voltage to increase beyond the limits of the equipment. The addition of ammonium chloride inhibited the generation of hydroxide and stabilized the voltage during the electrodeposition. In addition, a higher bath temperature suppressed the formation of micro-cracks on the surface of the electrodeposits. Furthermore, the appearance of voids on the surface was reduced by increasing the concentration of the iron source and decreasing the current density. On the basis of these results, we prepared a bulk sample of electrodeposited Fe with a body-centered cubic structure and average grain size of ∼5 µm. The electrodeposited bulk Fe exhibited a tensile strength of 649 MPa and good elongation of 13.9%.
Electrodeposition processes have been developed to produce nanocrystalline metals and alloys over the past three decades.1) Adjusting the bath composition and deposition conditions decreases the grain size down to several nanometers2,3) and produces dense bulk samples4) that are suitable for mechanical testing. Previous studies on bulk electrodeposited nanocrystalline metals and alloys have led to the production of materials with both high strength and good ductility5–7) and have also provided a deeper understanding of the Hall–Petch effect8,9) and solid-solution strengthening effect10,11) in the nanocrystalline regime. In addition, detailed microstructure observations and molecular dynamic simulations have revealed grain boundary (GB)-mediated deformation such as dislocation emission from GBs,12) GB sliding,13) grain rotation,14) and GB migration.15) A deformation mechanism map has been reported in several papers but is limited to fcc metals.16–18) Even in the latest review,18) in-depth descriptions of the deformation mechanisms of nanocrystalline metals with body-centered cubic (bcc) and hexagonal close-packed (hcp) structures have not been provided. One reason for this lack of information is that the mechanical properties of electrodeposited bcc or hcp metals have been less thoroughly investigated compared with those of fcc metals. Evaluation of the mechanical properties has mainly been performed for face-centered cubic (fcc) metals such as Ni, Cu, and its alloys.4,7,19–21)
The electrodeposition of iron (Fe), which is a typical metallic material with a bcc structure, was first reported in the first half of the 1900s. The processes and electroformed products were used during World War I and II.22) Fe electrodeposition was then applied to the production of Fe strips, electrowinning, rolls, and molds.22) Thus, the basic Fe electrodeposition technology appeared well established. In addition, Fe is inexpensive and abundant compared with Ni and Cu. Regardless of these factors, there have been few reports23–25) on the use of Fe electrodeposition for the fabrication of nanocrystalline α-Fe or the evaluation of its microstructure and mechanical properties. We suggest the following two reasons for the unpopular use of Fe electrodeposition. First, Fe electrodeposition has the disadvantage of air oxidation of Fe(II) ion.26) Fe(III) ions generated by air oxidation in the deposition bath reduce the deposition rate and produce brittle, stressed, and pitted deposits. A second disadvantage of this technique is the sulfur contamination caused by the reagents constituting the electrodeposition bath. Sulfur is a GB embrittlement element for Fe.27) In electrodeposited Fe alloys, degradation in mechanical properties due to sulfur contamination has been reported.28–30)
Therefore, the aim of this study was to develop an electrodeposition process for producing bulk α-Fe. A chloride bath without sulfur was selected, and the effects of the bath compositions and electrodeposition conditions were examined. We report the connection between the growth mode during electrodeposition and the resulting oriented structure as well as the enhanced tensile elongation of the resulting electrodeposited bulk Fe sample.
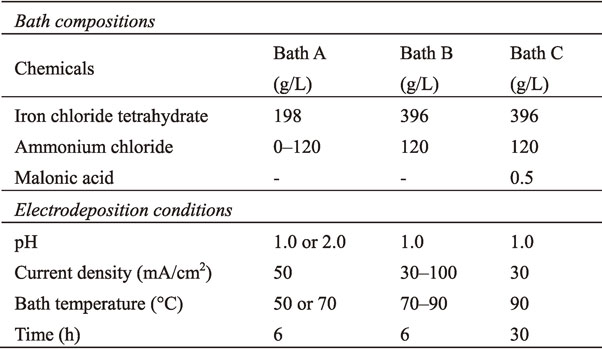
Thick and bulk samples of Fe with thicknesses of approximately 200 and 500 µm were electrodeposited. Three types of deposition bath (A, B, and C) that primarily consisted of iron chloride and ammonium chloride were prepared; the details of the bath compositions are provided in Table 1. All the samples were deposited onto substrates of commercial tough-pitch Cu using a counter electrode of a titanium basket with Fe plate (99.9%). Current was applied in constant current mode, and the current densities ranged from 30 to 100 mA/cm2. The bath temperature varied from 50 to 90°C. To maintain the bath temperature, an oil bath was tuned using a proportional-integral-differential controller. The pH value was kept constant at 1.0 or 2.0 through adjustment using an HCl solution before and during electrodeposition. Details of this setup can be found elsewhere.20,31,32)
After electrodeposition, the weight of the electrodeposited Fe was measured by weighing the samples before and after electrodeposition. From this weight, the current efficiency based on Faraday’s electrolysis law was calculated. The surface condition of the samples was examined using a scanning electron microscope (SEM, Hitachi S-4800). For the bulk samples, the following analysis was further performed. Energy-dispersive X-ray spectroscopy (EDS) coupled with SEM was used to verify the Cl and S contamination. The C and N contents were quantified using infrared absorption after combustion in a high-frequency induction furnace and using an inert gas fusion thermal conductivity method, respectively. The phase was identified using X-ray diffraction (XRD, Rigaku Ultima IV) with Cu Kα radiation. The grain size of the bulk samples was characterized using an electron backscatter diffraction (EBSD) system (TSL MSC-2200) attached to a scanning electron microscope (JEOL 7001F). EBSD was conducted at 10 kV with a 0.10-µm measurement step. Tensile specimens with a gauge length of 10 mm, width of 4.0 mm, and thickness of 0.5 mm were machined using electrical discharge machining (EDM). The copper substrate and layer affected by EDM were removed by mechanical polishing. Tensile tests were performed at room temperature and a strain rate of 1 × 10⁻³ s−1. The total elongation of the tensile specimen after fracture was measured from the change in the gauge length.
As mentioned in the introduction, air oxidation causes the transformation of Fe(II) ions into Fe(III) ions. This transformation can be observed by monitoring the solution color: air oxidation changes the color from transparent green to dark and often leads to the formation of precipitates. Generally, the air oxidation of Fe(II) ions is suppressed by maintaining a low pH.22) In practice, in the electrodeposition of Fe alloys, the pH of the solution is maintained at approximately 2.0.33–35) In this study, for pure Fe electrodeposition, bath A at pH of 2.0 tended to be reddish-brown and sludgy after stirring for 6 h, as shown in Fig. 1(a). Note that the current was not applied. In contrast, decreasing the pH value to 1.0 resulted in a transparent green solution during stirring for 6 h, as shown in Fig. 1(b).
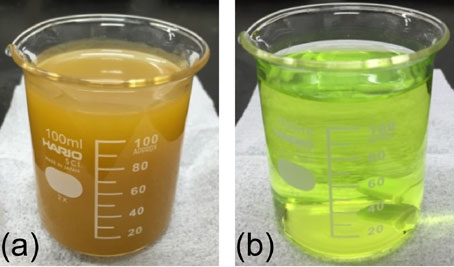
Representative photographs showing the color of the solution (a) with and (b) without the formation of Fe oxides.
We conducted the electrodeposition using bath A at pH of 1.0 for 6 h. In the simple bath consisting only of iron chloride, the formation of a reddish-brown precipitate similar to that shown in Fig. 1(a) occurred 2–3 h after the start of electrodeposition. In addition, an irregular increase was observed in the voltage during the electrodeposition. There were two causes: one is that the current efficiency of the deposition bath was low. Undesirable side reactions such as generation of gas36) inhibit the deposition of iron. The other was that the pH change was relatively severe. Generally, in the electrodeposition process, a buffer agent is used to maintain the pH of the deposition bath. Therefore, we added ammonium chloride to bath A, which improved current efficiency and provided buffer properties.37) The addition of ammonium chloride prevented the formation of oxides and stabilized the voltage. After electrodeposition for 6 h, the solution of bath A remained transparent green, as shown in Fig. 1(b). From the results of the preliminary experiment based on the color change of the solution, we selected a pH of 1.0 and ammonium chloride concentration of 120 g/L as appropriate conditions.
3.2 Effects of iron chloride concentration, bath temperature, and current density on growth modeWe conducted electrodeposition using bath A and B under total seven conditions to optimize the electrodeposition parameters for producing bulk samples. Figure 2 shows the current efficiency of bath A and B as a function of bath temperature. The increase in bath temperature from 50 to 70°C increased the current efficiency of deposition bath with 1.0 mol/L iron chloride from 61% to 78%. The higher concentration of iron chloride increased the current efficiency to 88%. Further increase of the bath temperature to 80–90°C resulted in a high current efficiency of 93%–94%. Decreasing and increasing the current density to 30 and 100 mA/cm2, respectively, led to a decrease in the efficiency by several percent. These results indicate that a higher bath temperature and iron chloride concentration were appropriate for preparing bulk specimens.
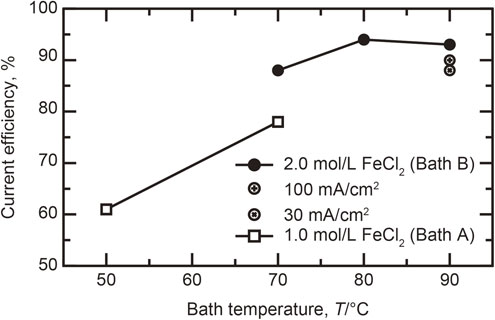
Current efficiency of bath A and B as a function of bath temperature under different conditions.
SEM images of the surface condition of the electrodeposits are presented in Fig. 3. Micro-cracks were formed at the surface for the bath temperature of 50°C, as shown in Fig. 3(a). The higher temperature of 70°C suppressed the formation of micro-cracks, as observed in Fig. 3(b); however, numerous voids remained. Figure 3(c) shows that increasing the concentration of iron chloride in the deposition bath from 1.0 to 2.0 mol/L reduced these voids. Even under conditions of high current efficiency, voids remained on the surface, as observed in Fig. 3(d) and (e). Increasing the current density to 100 mA/cm2 promoted void formation (Fig. 3(g)), whereas decreasing the current density to 30 mA/cm2 resulted in the least defective surface. The surface conditions were improved by increasing the current efficiency of the deposition bath, which indicates that a higher current efficiency results in the reduction of side reactions, and then, growth inhibitors were decreased during electrodeposition. To obtain a more in-depth understanding of this point, the growth behavior will be discussed in detail in a later section.
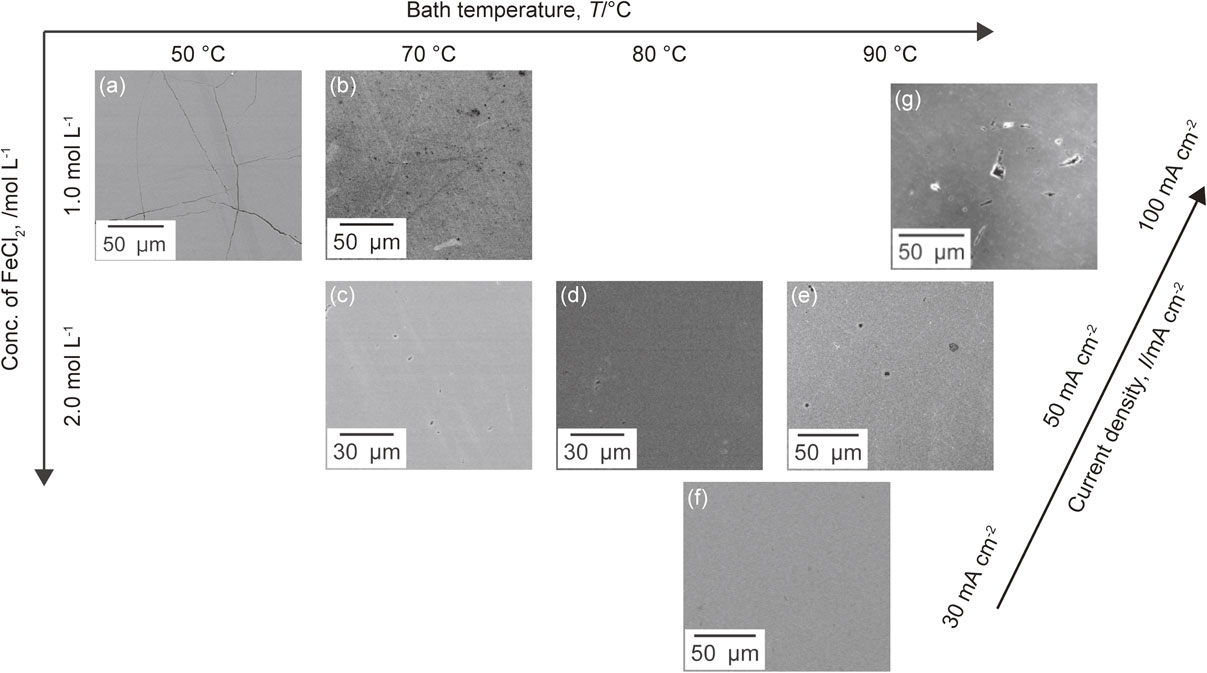
SEM images showing the surface condition for thick samples electrodeposited from bath A and B under different conditions. (a)–(e) are on the same plane, and the applied current density was 50 mA/cm2. (f) and (g) are located at different positions with respect to (e) along the axis perpendicular to the page.
Figure 4 shows the XRD pattern of thick samples electrodeposited from bath A and B under different conditions. All the patterns show a single bcc structure with strong (110) (211) texture. Comparison of Fig. 4(a) with Fig. 4(b) reveals that increasing the bath temperature from 50 to 70°C reduced the intensity of the (211) peak. The higher concentration of iron chloride did not have a strong effect on the texture, as observed in Fig. 4(c). Figures 4(d) and (e) show that further increasing the bath temperature from 70 to 90°C enhanced the intensity of the (211) peak. Decreasing the current density to 30 mA/cm2 led to the appearance of the (200) peak (Fig. 4(f)), whereas increasing the density from 50 to 100 mA/cm2 had no effect (Fig. 4(g)).
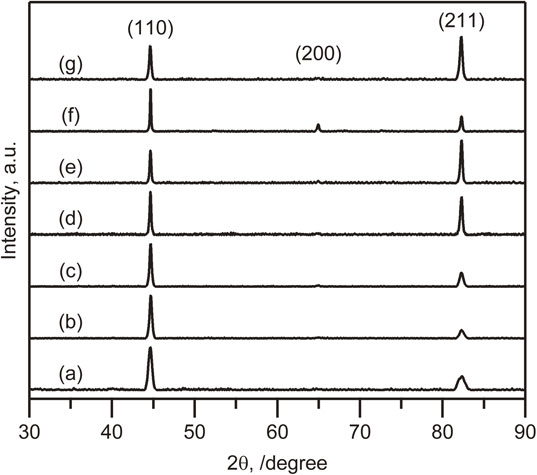
XRD pattern of thick samples electrodeposited from bath A and B. All the samples showed peaks assigned to the bcc structure. The inset labels (a) to (g) correspond to the labels of the SEM images in Fig. 3.
The thickness is important in evaluating the mechanical properties of electrodeposits. In fact, Brooks et al.4) pointed to that thin samples can not sufficiently evaluate the elongation of materials. Thus, high current efficiency of deposition bath is required to efficiently produce bulk sample suitable for mechanical testing. In addition, low current efficiency results in undesirable side reactions and often generates the gaseous hydrogen. Hydrogen dissolution in the deposits and its subsequent release is assumed to be the origin of the occurrence of internal stress.38) Improvements of current efficiency are effective way in suppressing formation of micro-cracks, as shown in Fig. 3, in electrodeposits. However, our previous studies point out that high current efficiency alone is insufficient to obtain defect-free electrodeposits.32,39)
In electrodeposition process, there are three types of growth modes: free-lateral, inhibited-lateral, and inhibited-out growth.40) Hydrogen gas and adsorbed hydrogen are the main growth inhibitors in the inhibited-lateral and inhibited-out growth modes, respectively.40) Even if the current efficiency is high, the samples obtained from the inhibited growth modes contain defects due to the inhibitor and do not show ductility.39) Thus, the free-lateral growth mode, which can ignore the presence of inhibitors, is desired to produce bulk samples for mechanical testing. Also, each growth mode introduces a specific oriented texture on the electrodeposits.32,39,41,42) XRD analysis of the electrodeposits allows identification of the growth mode during electrodeposition. Although the connection between the growth mode and resulting oriented texture for fcc metals has been clarified,39,40) that for bcc metals has not yet been reported. Thus, we will connect the growth mode with the oriented texture obtained from XRD analysis for Fe electrodeposition. In the case of Ni and Ni alloys with fcc structures, a free-lateral growth mode introduces a strong (200) texture on the surface direction. From this, we assumed that the electrodeposits will grow such that the atoms are closest packed when the growth is uninhibited. In this situation, for bcc metals, the closest packed surface, such as the (110) plane, is located in a direction perpendicular to the substrate, and the (200) plane is located on the surface of the sample. However, when the growth is inhibited by hydrogen gas and/or adsorbed hydrogen, the plane in which the inhibitor can exist more stably will appear in the growth direction. These inhibited growth modes result in the (110)- or (211)-oriented structures for Fe electrodeposition.
In this study, the sample with the (200) peak appearing in the XRD pattern was electrodeposited only at a current density of 30 mA/cm2 and a bath temperature of 90°C, as shown in Fig. 4. This sample is also the most defect-free sample in surface comparison as shown in Fig. 3. The results and discussion indicated the importance to select electrodeposition conditions that produce a strong (200) texture as done for fcc metals and alloys7,39) in order to reduce processing defects for electrodeposited Fe.
3.3 Characteristics of bulk Fe electrodeposited from bath CThe previous results provided the appropriate conditions (iron chloride concentration of 2.0 mol/L, pH of 1.0, bath temperature of 90°C, and current density of 30 mA/cm2) to effectively produce bulk samples and reduce processing defects. Using these optimal conditions, we conducted the electrodeposition for 30 h using bath C. Bath C was prepared by adding malonic acid to bath B. When using bath B, electrodeposition for 30 h could not be performed without the formation of precipitates, as shown in Fig. 1(a). To prevent the formation of precipitates, malonic acid was added. Although malonic acid has been experimentally known to exhibit a precipitation inhibiting effect,35,43) the mechanism is unclear. Bath C at the appropriate conditions also exhibited a high current efficiency of 88%, comparable to that of bath B and led to the production of bulk samples with thicknesses of approximately 0.5 mm. In the EDX analysis of the bulk sample, the Cl and S peaks were not detected, which are the main component of the deposition bath and a harmful element, respectively. The main impurities of the bulk sample were 0.03 mass% C and 0.002 mass% N. These inclusions originated form the malonic acid44) and ammonium chloride, respectively.
Figure 5(a) and (b) present the XRD and EBSD analysis results for the bulk sample. The XRD patterns of the bulk Fe sample (Fig. 5(a)) indicated a single bcc structure, which is the same structure as that of the thick sample obtained from bath B (Fig. 4(f)). Increasing the electrodeposition time did not have a strong effect on the texture determined from XRD analysis. The EBSD image (Fig. 5(b)) shows the microstructure of the electrodeposited Fe; the average grain size was 5.0 µm. Among electrodeposited metals, this grain size is relatively large. In fact, most electrodeposited metals and alloys have a nanocrystalline structure with a grain size of less than 100 nm.10,39,45) The nano-grained structures result in and are stabilized by a large number of impurities or solutes.10,39) The micro-order grains for the electrodeposited Fe indicate that it contained little impurities that pin the GB motion.

(a) XRD pattern of bulk sample of Fe electrodeposited from bath C. (b) EBSD image showing the microstructure of the bulk sample of Fe electrodeposited from bath C. Grains were detected using a grain detection angle of 15°, which indicated that the average grain size of bulk sample was 5.0 µm.
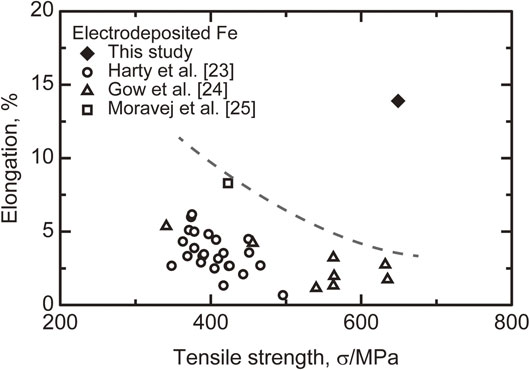
A stress–strain curve of the bulk Fe sample is presented in Fig. 6. The bulk Fe sample exhibited a tensile strength of 649 MPa and elongation after fracture of 13.9%. To compare the balance between the strength and elongation, the tensile properties of electrodeposited Fe are summarized in Fig. 7. Electrodeposited Fe has been reported to have a tensile strength of approximately 350–630 MPa and elongation of less than 10%.23–25) Compared with these data, our developed process enhanced both the tensile strength and elongation. Harty et al.23) and Gow et al.24) mentioned that the low elongation of their electrodeposited Fe was caused by the internal stress. A high internal stress introduces the large number of defects on the electrodeposits.38) Although the Fe foils electrodeposited by Moravej et al.25) had the similar grain size as that produced in this study, both the strength and the elongation were low. Comparison of the XRD pattern shows that the intensity of (200) peak for the Fe foils produced by Moravej et al.25) is the weaker compared to that for this study. This means that the inhibited growth mode, resulting in the defects on electrodeposits, was more dominant during electrodeposition. Thus, it was concluded that the improvement for this study was due to the reduction of processing defects by adjusting growth mode, as discussed above. This study developed the basic techniques of electrodeposition for producing bulk pure Fe with plastic deformability. We are currently developing an electrodeposition process for Fe alloys to reduce the grain size to the nanometer range.
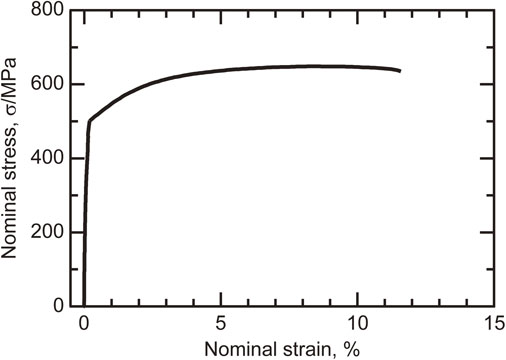
Stress–strain curve of bulk sample of Fe electrodeposited from bath C. The minor elongation up to 0.2% was measured by a strain gauge adhered to the parallel part of the tensile specimen. Further elongation was determined by the machine crosshead motion.
We conducted electrodeposition of Fe using a chloride bath under different conditions to determine the appropriate conditions for producing a bulk sample for mechanical testing. The long electrodeposition necessary for producing a bulk sample could be achieved by decreasing the pH to 1.0 and adding ammonium chloride and malonic acid, which suppressed the formation of Fe oxides. At a bath temperature of 90°C and a current density of 30 mA/cm2, the formation of defects on the surface area was also suppressed. This suppression was attributed to the change of the growth mode from an inhibited to an uninhibited mode. In addition, XRD analysis indicated that the free-lateral growth mode introduced a strong (200) texture in the Fe electrodeposition. The bulk electrodeposited Fe exhibited enhanced tensile properties compared with those previously reported for electrodeposited Fe.
This work was supported by a Grant-in-Aid for Scientific Research (C) (Grant number JP25390031) from the Japan Society for the Promotion of Science (JSPS).