Change in Slip Mode with Temperature in Ti–0.49 mass%O
2019 年 60 巻 1 号 p. 80-85
詳細
2019 年 60 巻 1 号 p. 80-85
The temperature dependence of 0.2% proof stress was investigated in Ti–0.49 mass%O with an α single phase. The 0.2% proof stress decreased as the temperature increased from 77 to 573 K. The athermal stress, which was defined as the average of the stress values for which the temperature dependence was absent above 573 K, was found to be 70 MPa. The temperature dependence of the effective stress indicates that the temperature dependence of the effective stress changed at around 400 K. To study the thermally activated process that controls the yielding in Ti, the temperature dependence of the activation volume was also measured. An inverse temperature dependence of the activation volume was found at between 325 and 400 K, suggesting that the thermally activated process of dislocation glide changed at this temperature. Prismatic slip with ⟨a⟩ dislocations was dominant at low temperatures, whereas other slips were activated at high temperatures. The activation enthalpy for the dislocation glide was also measured between 77 and 573 K.
Titanium alloys are used as structural materials for components such as aircraft engines because these alloys show excellent specific strength. The mechanical properties of titanium alloys can be enhanced using several methods such as grain refining1,2) and solid solution hardening (especially using oxygen).3) For instance, Ti–6Al–4V is a titanium alloy with superior mechanical properties. The mechanism behind the outstanding mechanical properties of titanium alloys is complicated, because they contain α (hcp) and β (bcc) phases, whose mechanical properties are different. The mechanical properties of such alloys combine the properties of the α and β phases. Therefore, an understanding of the mechanical properties of each phase is essential to better understanding the overall mechanical properties of titanium alloys.
Naka et al.4) demonstrated the temperature dependence of α-Ti single crystals with oxygen. They showed that the temperature dependence of α-Ti depends strongly on the oxygen concentration. The critical resolved shear stress (CRSS) of α-Ti with 6960 at. ppm O is approximately 270 MPa at 77 K, whereas that of α-Ti with 1530 at. ppm O is approximately 70 MPa at 77 K. This indicates that the thermally activated process for dislocation glide involves overcoming the interaction of dislocations with oxygen atoms; this process plays an important role in the temperature dependence of yield stress in α-Ti. The thermal activation of dislocation glide was also investigated by Tanaka and Conrad.5) They measured the activation enthalpy for dislocation glide in single crystalline α-Ti and found that the activation enthalpy for dislocation glide is proportional to the temperature, as seen in bcc crystals.6,7) Because commercially used titanium alloys are polycrystals, an understanding of the temperature dependence of polycrystalline α-Ti is also essential for further understanding the mechanical properties of Ti alloys.
Accordingly, in the present study, the temperature dependence of several physical properties related to a thermally activated process was investigated in polycrystalline α-Ti with a relatively high oxygen concentration. The thermally activated process of dislocation glide was evaluated by measuring the temperature dependence of the effective stress and activation volume through tensile tests. In addition, activated slip systems were assessed by measuring the change in the c-axis direction inside a grain after deformation.
A casted ingot was forged at 1273 K, followed by hot rolling at 923 K. The rolled plate, which had a thickness of 1.6 mm, was kept at 973 K for 1.8 ks in a vacuum furnace, then air cooled. The chemical composition of the materials after the heat treatment is listed in Table 1. The employed materials had α single phases, and 0.49 mass%O was the major impurity after the heat treatment. The specimen thickness was 1.0 mm. The width and length of the parallel portion of the specimen were set to 2 and 8 mm, respectively. The temperature dependence of 0.2% proof stress was also measured between 77 and 673 K. The initial strain rate was set to 4.17 × 10⁻⁴ s−1, which was calculated from the crosshead speed and gauge length. The tensile direction was parallel to the rolling direction (RD). Strain rate jump tests were also performed, in which the strain rate was increased by a factor of 10 at a strain of approximately 0.01.

Figures 1(a) and (b) show the orientation maps of grains on the normal plane. The orientations shown the figures indicate the crystallographic orientation parallel to the normal direction (ND) and RD, respectively, as observed from the ND. The mean grain size is approximately 50 µm, as measured by an intercept method. Figure 1(c) shows the pole figures with respect to (0001), $\{ 10\bar{1}0\} $, and $\{ 11\bar{2}0\} $; these figures indicate that the specimens have a texture in which the basal planes are facing a direction that is nearly parallel to the ND. The tensile directions are parallel to the RD; therefore, basal slip and deformation twinning are expected to be prohibited in the used specimens.

Orientation map of grains in normal plane of specimen for (a) ND and (b) RD. Tensile directions are parallel to the RD. (c) Pole figures with respect to (0001), $\{ 10\bar{1}0\} $, and $\{ 11\bar{2}0\} $ for the same area shown in (a) and (b).
Figure 2(a) shows the nominal stress–nominal strain curves obtained at 77, 293, and 573 K. The specimen tested at 77 K is fractured during uniform deformation. As the temperature decreases, 0.2% proof stress increases and total elongation decreases. Figure 2(b) shows the true stress–true strain curves of the specimens overlapped with the work-hardening rate, dσ/dε, where σ and ε are the true stress and true strain, respectively; the curves are shown until dσ/dε is equal to the flow stress, except for the result obtained at 77 K. The rapid decrease in dσ/dε at the beginning of the plastic deformation is due to the fact that some grains continued elastic deformation, and to the low work-hardening rate of titanium. The uniform strains of the specimens deformed at 573, 293, and 77 K are 0.12, 0.15, and 0.06 in terms of true strain, respectively. The uniform strain is largest for the specimen tested at 293 K because of the high work-hardening rate. A strong temperature dependence of 0.2% proof stress is seen, as in the case of bcc crystals, which have high Peierls potentials. It was reported that temperature dependence is weak in pure Ti,8) which indicates that the Peierls potential of pure Ti is relatively low, as in the case of pure fcc crystals. Therefore, the thermally activated process for dislocation glide, which leads the temperature dependence of yielding in Ti with 0.49 mass%O, does not involve overcoming the Peierls potential but rather involves overcoming the interaction of dislocations with oxygen atoms.

(a) Nominal stress–strain curves obtained at 573, 293, and 77 K. The specimen tested at 77 K fractured during the uniform elongation. (b) True stress–true strain curves. The work-hardening rate of each specimen is also shown.
Figure 3 shows the temperature dependence of 0.2% proof stress. The 0.2% proof stress decreases with an increase in the temperature, and the value becomes nearly constant above 573 K. Here, the proof stress is divided into two stress components, effective stress (σe)9) and athermal stress (σath), which are temperature dependent and independent, respectively. Therefore, the proof stress at a certain temperature is given by
| \begin{equation} \sigma_{0.2} = \sigma_{\text{e}} + \sigma_{\text{ath}}. \end{equation} | (1) |

Temperature dependence of 0.2% proof stress.
Figure 3 indicates that above 573 K, the 0.2% proof stress is nearly temperature independent; therefore, in this study, the athermal stress is considered to be 70 MPa, which is the average of the values above 573 K. To examine the origin of the temperature dependence, the temperature dependence of the activation volume was measured next.
The activation volume is one of the parameters governing the thermally activated process. Here, the activation volume is given by the following equation:10)
| \begin{equation} V^{*}\equiv kT\frac{\partial\mathit{ln}\dot{\gamma}}{\partial\tau_{\text{e}}}\approx MkT\frac{\partial\mathit{ln}\dot{\varepsilon}}{\partial\sigma_{\text{e}}}, \end{equation} | (2) |
Figure 4 shows the temperature dependence of the activation volume. In the figure, the vertical axis represents the activation volume divided by the Taylor factor M, considering that the value of M has not been elucidated clearly for hcp metals, especially for materials whose texture is the same as that of the materials employed in this study. The right vertical axis indicates the values normalized with the cube of the Burgers vector of $\frac{a}{3}\langle 11\bar{2}0\rangle $ (2.821 × 10⁻¹⁰ m) of Ti for reference, where a is the lattice parameter. Here, the dependence of the activation volume on temperature is considerably more important than the absolute values. If the activation volume simply increases with the temperature, the thermally activated process of dislocation glide is considered to be dominated by a single process. However, Fig. 4 indicates an inverse temperature dependence of the activation volume between approximately 325 and 400 K, which suggests a change in the thermally activated process of dislocation glide in this temperature range. The stress associated with the thermally activated process is effective stress. Therefore, the temperature dependence of the effective stress was obtained next.

Temperature dependence of activation volume divided by Taylor factor M. The right vertical axis is normalized with the cube of the Burgers vector of the a axis (2.821 × 10⁻¹⁰ m) of Ti for reference.
Figure 5 shows the temperature dependence of the effective stress obtained from Fig. 3 and eq. (1). Two different curves convex down can be separately fit on the data points below 390 K (black solid line) and above 390 K (red dotted line), indicating that the temperature dependence changes at 390 K, where the inverse temperature dependence of the activation volume is observed (Fig. 4). The inverse temperature dependence of the activation volume was also reported in Ti single crystals.4,8,11) It is speculated here that the change in the temperature dependence of the effective stress (Fig. 5) and the inverse temperature dependence of the activation volume (Fig. 4) is due to the change in the activated slip systems. Therefore, the dominant slip system was determined at both low and high temperatures using electron backscattered diffraction (EBSD) analysis. The results of this analysis are discussed in the next section.

Temperature dependence of effective stress. The black square and red circle symbols indicate the difference in the temperature dependence. The same type of symbols is in the same fitting curve.
To investigate the change in the activated slip systems with temperature, tensile tests at 77 and 673 K were terminated at a plastic strain of approximately 0.04, following which the crystal rotation was investigated using EBSD. Figures 6(a)–(d) and (e)–(h) show the images obtained from the specimens deformed at 77 and 673 K, respectively. In the figure, the tensile direction is horizontal. Figures 6(a) and (e) and Figs. 6(b) and (f) show orientation maps in the tensile direction before tensile tests and optical micrographs after tensile tests, respectively, where (a), (b) and (e), (f) are nearly the same areas. Since the prismatic and pyramidal slip traces on the surface are so close, it is not straightforward to determine which slip system was activated. Even from the viewpoint of Schmid’s factor, the prismatic plane with ⟨a⟩ slip and the pyramidal plane with ⟨a+c⟩ slip is nearly the same as Figs. 7(b), (c), (f), and (g) indicate. However, the traces of basal slips are distinguishable from those of prismatic and pyramidal slips. Therefore, the possibility of the basal slips was assessed first.
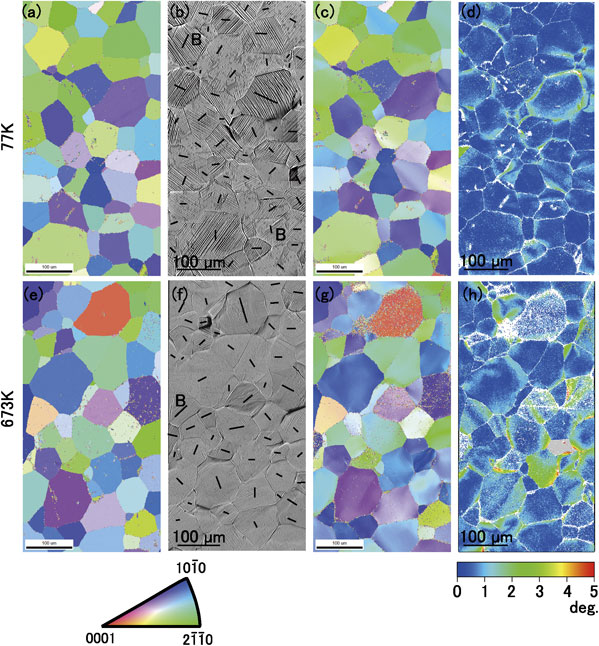
Crystal orientation maps, optical micrographs, and colour maps of specimens before and after tensile tests. (a)–(d) and (e)–(h) are obtained from the specimens tested at 77 and 673 K, respectively. The observed areas are the same in each specimen. (a) and (e) Orientation maps obtained before tensile tests. (b) and (f) Optical micrographs obtained after tensile tests, which were terminated at strain of 0.04. Traces of basal planes are shown as black lines in each grain. (c) and (g) Orientation maps obtained after tensile tests. (d) and (h) Colour maps showing deviation of [0001] direction from average [0001] orientation in each grain. The colour scale is shown at the bottom-right corner.

Colour maps showing Schmid factor of each grain. (a)–(d) and (e)–(h) show the same areas as those in (a) and (e) in Fig. 6, respectively. (a) and (e) Basal slips along $\langle 11\bar{2}0\rangle $. (b) and (f) Prismatic slips along $\langle 11\bar{2}0\rangle $. (c) and (g) Pyramidal slips along $\langle 11\bar{2}3\rangle $. (d) and (h) Pyramidal slips along $\langle 11\bar{2}0\rangle $.
The black lines in Figs. 6(b) and (f) indicate traces of the basal plane with specimen surfaces. Most of the slip bands in Fig. 6(b) are not parallel to the black lines. Only two grains contain slip bands parallel to the black line annotated “B” in Fig. 6(b), one of which contains faint short slip bands. Thus, the dominant active slip plane is not the basal plane at 77 K. The rare activation of the basal planes is understood by the fact that for the specimens employed in this study, most of the grains have small Schmid’s factors of the basal slip (Fig. 7(a)). The possibility of pyramidal and prismatic slips will be discussed in the next paragraph. Figure 6(b) shows a large number of distinct straight slip bands crossing the grain, whereas Fig. 6(f) shows faint slip bands on the specimen surface. That is, the slip traces are not as distinct as those in Fig. 6(b). These results suggest that the number of activated slip systems is limited in the deformation at 77 K, whereas several slip systems are activated in the deformation at 673 K. Here, the activation of basal slips at 673 K is supposed to be rare because the Schmid’s factor of basal slips is as small as that at 77 K, shown in Fig. 7(e).
To assess the slip systems activated during the plastic deformation in the specimens deformed at 77 and 673 K, the crystal rotations in each grain were investigated. First, the average orientation of the [0001] direction in a grain was determined in terms of the specimen coordinates. The angle between the average orientation of the [0001] direction and each measured point in the same grain was measured. The [0001] direction does not deviate only if the prismatic slip with the Burgers vector of $\frac{a}{3}\langle 11\bar{2}0\rangle $ (the Burgers vector is hereafter denoted as ⟨a⟩ dislocation) is active, because the [0001] direction is the rotation axis for the prismatic slip with ⟨a⟩ dislocation. Therefore, the magnitude of deviation of the [0001] direction in the pole figure can be one of the indexes of how much the slip systems which that are not prismatic with ⟨a⟩ dislocations are activated.
Figures 8(a) and (b) show a schematic demonstrating crystal rotation in the case that a prismatic slip with an ⟨a⟩ dislocation is activated, where the activated prismatic slip planes are coloured grey. If the prismatic slip with an ⟨a⟩ dislocation is activated, the rotation axis is parallel to the c-axis. Therefore, the c-axis keeps its initial direction, even if the plastic deformation proceeds in the tensile test. The c-axis does not tilt from the initial direction only in the case that the prismatic slip with the ⟨a⟩ dislocation is activated.

(a) Prismatic slip plane with an ⟨a⟩ dislocation. (b) Schematic showing the rotation axis in case of prismatic slip with ⟨a⟩ dislocation. (c) Pyramidal slip plane with an ⟨a+c⟩ dislocation. (d) Schematic showing the rotation axis in case of pyramidal slip with the ⟨a+c⟩ dislocation.
Figures 8(c) and (d) show a schematic demonstrating a crystal rotation in case that a pyramidal slip with a ⟨a+c⟩ dislocation is activated as an example for the case that the activated slip system is not the prismatic with the ⟨a⟩ dislocation. The activated pyramidal slip planes are coloured grey in the figure. Since the rotation axis is not parallel to the c-axis, the c-axis tilts from the initial direction and the slip proceeds as shown in Fig. 8(d). The tilt angle is denoted as ϕ in the figure. The magnitude of ϕ can be used an indicator of how much the slip system which is not the prismatic with ⟨a⟩ dislocation is activated. Therefore, the tilt angle ϕ is obtained next using EBSD using Euler angles from each data point.
Figures 6(c) and (g) show the orientation maps at 77 and 673 K, respectively, after deformation with a strain of 0.04. The maps show gradations, indicating that the grains rotated during the deformation. Figures 6(d) and (h) show the colour maps obtained from the Euler angles in Figs. 6(c) and (g), respectively. The maps show the magnitude of deviation of the [0001] direction from the average [0001] direction in the grain. The colour scale for Figs. 6(d) and (h) is indicated at the bottom-right corner of the figure in a degree scale. Figures 6(d) and (h) indicate that the deviation of the [0001] direction from the average direction is limited to the grain boundaries in the specimen deformed at 77 K, whereas a wide area of deviation from the average direction is observed inside the grain in the specimen deformed at 673 K. In addition, an area with a deviation angle of 5° or greater is observed in the specimen deformed at 673 K. This suggests that the dominant slip systems activated at 77 K are prismatic with ⟨a⟩ dislocations, whereas that at 673 K are slip systems which that are not the prismatic with ⟨a⟩ dislocations.
Another important physical property related to the thermally activated process is the activation enthalpy for dislocation glide. The enthalpy is given by
| \begin{equation} \Delta H = -kT^{2}\left\{\frac{\partial\mathit{ln}\dot{\gamma}}{\partial\tau_{\text{e}}}\right\}\left(\frac{\partial\tau_{\text{e}}}{\partial T}\right). \end{equation} | (3) |
Figure 9 shows the temperature dependence of the activation enthalpy obtained in this study using solid red plots, which overlap the results obtained for single crystalline α-Ti.5,12,13) The red solid line in the figure is a regression line, which shows a good linear relationship between ΔH and the temperature. The slope of the line is found to be 30.5k. The results obtained in this study are in good agreement with the results of prismatic slips in single crystalline α-Ti obtained by Tanaka and Conrad5) and Brehm and Lehr,13) but the results obtained in this study are completely different from the results of basal slips in single crystalline α-Ti obtained by Levine.12)

Temperature dependence of activation enthalpy. The red plots represent results obtained in this study. The chain line is a regression line for basal slip in single crystals drawn using data after Levine,12) and the dashed line is a regression line for prismatic slip in single crystals drawn using data after Tanaka and Conrad5) and Brehm and Lehr.13)
Figure 6 suggests that a prismatic slip with ⟨a⟩ dislocations is dominant at low temperatures (below 400 K), whereas other slip systems are activated at high temperatures (above 400 K). The fact that the activation enthalpy obtained in this study is close to that of prismatic slip, which was measured in single crystals, below 400 K indicates that the dominant activated slip system in this study was also prismatic in polycrystals below 400 K. The fact that the activation enthalpy obtained in this study is close to that of prismatic slip, which was measured in single crystals, even above 400 K, suggests that the activation enthalpy for the slip which is not prismatic with ⟨a⟩ dislocations in polycrystal is nearly the same as that for prismatic slip in single crystal above 400 K. It is reasonable to infer that the activation enthalpy obtained in this study at this temperature range becomes close to that for prismatic slip. Supposing that the activated slip systems above 400 K are pyramidal slip systems14) with ⟨a+c⟩ dislocation rather than pyramidal slip systems with ⟨a⟩ dislocation, owing to the large value of Schmid’s factor as shown in Figs. 7(c), (d), (g), and (h), the CRSS of pyramidal slip comes close to that of prismatic slip at high temperatures.
In this study, the temperature dependence of effective stress was investigated in Ti–0.49 mass%O. Based on the study results, the following conclusions are drawn:
This work is partly supported by the Structural Materials for Innovation of the Cross Ministerial Strategic Innovation Promotion Program (SIP) of the Japan Science and Technology Agency (JST).