Abstract
We studied the statistical quantitative analysis of the hydrogen-assisted damage evolution behavior from nano- to micro-scale by combining positron annihilation spectroscopy (PAS) and scanning electron microscopy-based damage characterization in a dual-phase steel with a tensile strength of 960 MPa. The total elongation was markedly decreased by hydrogen pre-charging (0.32 mass ppm H) from 17% to 4%. We divided the damage evolution behavior into three stages: damage incubation; arrest; growth, and evaluated the effects of hydrogen pre-charging on each stage. The damage nucleation was caused by martensite fracture and enhanced by hydrogen pre-charging. However, PAS showed no enhancement of vacancy formation by hydrogen. The statistical damage quantitative analysis indicated in the damage arrest stage that the critical damage size corresponding to the blunt limit of the damage tip was decreased from ∼1 µm2 in the uncharged specimen to ∼0.5 µm2 in the hydrogen pre-charged specimen. The damage growth in the third stage was accelerated by hydrogen pre-charging owing to quasi-brittle damage propagation through the ferrite cleavage plane or ferrite/martensite interface. Microstructure observation showed that the cleavage propagation in ferrite was accompanied by the local plastic deformation. To explain this fracture acceleration, we proposed cooperative contribution of the enhancement of the local plastic deformation through adsorption-induced dislocation emission mechanism and the cleavage fracture through hydrogen enhanced decohesion mechanism.
This Paper was Originally Published in Japanese in J. Japan Inst. Met. Mater. 83 (2019) 221–230.
1. Introduction
Plasticity-induced local damages such as cracks and voids grow and coalesce with strain, which causes ductile fracture in metals. As an example, we here note dual-phase (DP) steel which has been developed as an automotive material. DP microstructure consists of soft ferrite and hard martensite phases, which result in a superior ductility–strength balance.1,2) Contrarily, the difference in strength between the two phases causes localization of plastic strain in ferrite and at the ferrite/martensite interface. Furthermore, the heterogeneous morphology and size of martensite increases the degree of the plastic strain localization, which induces early damage formation and growth.3–6) To solve the key problem, the quantification of plasticity-driven damage evolution is required. As a quantification method for damage, the total amount, size, number of damages are measured through microstructure observations on a cross section of a fractured specimen, and then plotted against local strain. The damage–plastic strain relationship has been recognized as effective for the characterization of damage evolution;7) damage parameters have been used for analyzing the microstructure, temperature, strain rate, and hydrogen effects on damage evolution in DP steel.5,8–10)
In particular, hydrogen has a significant effect on mechanical degradation in a corrosive atmosphere. For example, the delayed fracture of steels with a tensile strength over 1.2 GPa is a critical problem in practical use,11) which has recently increased the demand for mechanisms that would explain hydrogen-induced mechanical degradation (i.e., hydrogen embrittlement). The hydrogen embrittlement problem is considered to be complex because of the dual role of hydrogen, which simultaneously enhances decohesion and plastic strain localization.12–15) The dual role of hydrogen is particularly important in DP steels10) because of the presence of the hydrogen-sensitive martensite interface and highly deformable ferrite. Moreover, hydrogen in DP steels has been reported to degrade not only the damage initiation resistance, but also the damage growth resistance.10) To understand the brittle/ductile mixture problem in DP steels, multi-stage analyses on hydrogen-assisted damage evolution are required, namely we must characterize (1) the precursor phenomenon of crack/void formation at an early deformation stage, and (2) the microstructural damage evolution at a late deformation stage. In other words, the two stages correspond to the accumulation of nanometer-scale lattice defects, and the evolution of micrometer-scale cracks and voids. In this context, improving the characterization of hydrogen-assisted damage evolution in DP steels faces the following two challenges. First, atomistic damage characterization must be coupled with microstructure observation-based techniques for damage quantification. Second, further statistical analysis for damage quantification must be developed, because the simple average value of each damage parameter is not sufficient to characterize heterogeneous microstructural damage evolution in DP steels. Here we propose solutions to these two challenges as follows.
Positron annihilation spectroscopy (PAS) is a method for detecting nanometer-scale damage, i.e., vacancy-type lattice defects (vacancy, vacancy cluster, nano-void, dislocation). PAS is a sensitive non-destructive method that selectively provides information about vacancy-type defects such as size and morphology via γ-ray.16–19) Vacancy size/density information is directly correlated with deformation-induced dislocation interaction and annihilation. Therefore, PAS coupled with micrometer-scale damage quantification would uncover the sequential process of plasticity-driven damage evolution from the nanometer to the micrometer scale.
From the viewpoint of micrometer-scale damage quantification, the formation of numerous small damage apparently decreases the average damage size, which is problematic to discovering the evolution behavior of main damage that directly leads to failure. To solve this problem, the statistical distribution of damage size, number, etc. must be presented as a function of plastic strain. In this paper, we present a multi-scale, quantitative, and statistical damage quantification strategy using microscopy-based analysis coupled with PAS. Based on the analysis results, the effects of hydrogen on damage evolution in DP steels are discussed.
2. Experimental Procedure
2.1 Material and specimen
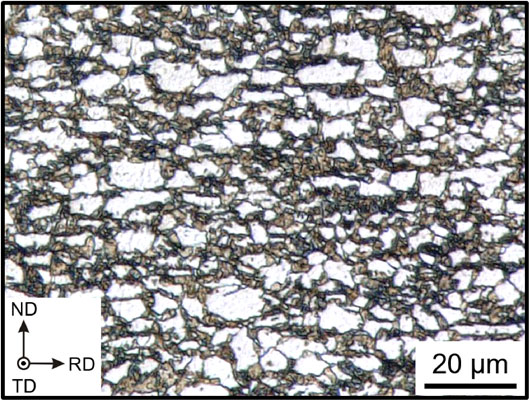
A low-carbon ferrite–martensite DP steel was prepared for this study. Its chemical composition is listed in Table 1. A 50 kg ingot was homogenized at 1250°C for 30 min, followed by hot rolling at a finishing temperature of 860–880°C. Subsequently, the hot-rolled bar was cold rolled to a 67% reduction in thickness, which produced 1 mm thick plates. As a final heat treatment, the plates were annealed at 800°C for 3 min, and then water-quenched, which resulted in a ferrite/martensite DP microstructure.20) Figure 1 shows the heat-treated microstructure before mechanical testing. The white and brown regions indicate ferrite and martensite, respectively. The martensite area fraction is 52%. Assuming ferrite contains no carbon, the carbon content in martensite is approximately 0.2 mass%, and the corresponding tensile strength of martensite is estimated to be 1500 MPa.21,22)
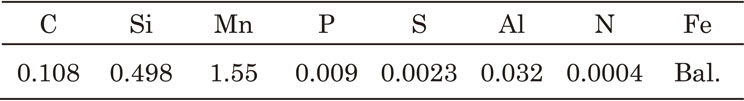
Table 1 Chemical composition (mass%).
Plate tensile specimens with gauge dimensions of 2 mm (width) × 1 mm (thickness) × 8 mm (length) were prepared by electro-discharge machining (Fig. 2(a)). The cutting direction was set parallel to the tensile direction. The gauge part was polished along the tensile direction using #1000 emery paper to remove stress concentration arising from scratches.

Hydrogen was introduced by cathodic charging at 10 A/m2 for 3 h in a 5% H2SO4 + 3 g/L NH4SCN aqueous solution. A platinum wire was used as a counter electrode. Hereafter, specimens with and without hydrogen charging are referred to as H-charged and uncharged specimens, respectively. The diffusible hydrogen content was measured by thermal desorption spectrometry (TDS) from ambient temperature to 200°C at a heating rate of 400°C/h. The specimen configuration for the TDS was 2 mmw × 1 mmt × 8 mml, which was the same as the gauge dimension of the tensile specimens. The surface of the specimens was also polished as done for the tensile specimens. The diffusible hydrogen content of the H-charged and uncharged specimens were 0.32 and 0.02 mass ppm, respectively. Hydrogen uptake was confirmed to be accomplished after 3 h with preliminary measurements of hydrogen content with different charging times, namely hydrogen was homogeneously distributed in the specimen.
Tensile tests were conducted at an initial strain rate of 1.0 × 10⁻⁴ s−1 at 20°C. Because hydrogen can be desorbed significantly even at ambient temperature, the tensile tests and TDS experiments were begun within 30 min of the hydrogen charging.
2.2 Quantification of damage evolution behavior
Damage quantification analyses were performed on the TD plane of the tensile-fractured specimens. Details of the cutting procedure have been included in a literature report.20) The layer of cutting/grinding-induced damage was removed by mechanical polishing using colloidal silica. In addition, the polished surface was etched with 3% Nital to correlate the damage with the microstructural features. Microstructure observation was carried out by secondary electron (SE) imaging. For the damage parameters, damage area fraction Da, number density n, average size dave, and average aspect ratio a/b were used. Here, a and b are damage lengths perpendicular and parallel to the tensile direction. Damage area fraction Da was defined as:
| \begin{equation}
D_{\text{a}} = A_{\text{d}}/A_{\text{a}}
\end{equation}
| (1) |
where
Aa and
Ad are the observation area and the total damage area fraction in the observation region, respectively. Damage number density per area
n was defined as:
| \begin{equation}
n = N/A_{\text{a}}
\end{equation}
| (2) |
where
N is the number of damages in the observation region. Then, average damage size
dave was defined as:
| \begin{equation}
d_{\text{ave}} = D_{\text{a}}/n.
\end{equation}
| (3) |
These damage parameters were plotted against local strain to characterize damage evolution behavior. Local strain in the fractured specimens was obtained by the digital image correlation (DIC) method. The DIC analysis was performed with Vic-2D software on specimen surfaces where an artificial random pattern was formed. The step size and subset were set to 37 µm and 777 × 777 µm
2, respectively.
2.3 Microstructure observation
Microstructure observation around the damaged areas was conducted by scanning electron microscopy-based methods: SE imaging, electron backscatter diffraction (EBSD) analysis, and electron channeling contrast (ECC) imaging. The observation surfaces for the SE imaging were etched by 3% Nital. SE imaging was performed at an acceleration voltage of 15 kV at a working distance (WD) of 13 mm. The etched specimen surface was re-polished by colloidal silica for the EBSD measurement and ECC imaging. The EBSD measurements were conducted at an acceleration voltage of 20 kV, at a WD of 15 mm, with a beam step size of 50 nm. The ECC imaging was operated at 30 kV and at a WD of 2.8 mm.
2.4 PAS
The gauge dimension of the tensile specimen for PAS was 2.8 mmw × 0.3 mmt × 5.4 mml (Fig. 2(b)). The specimens with and without hydrogen charging were deformed by 2% and 4% tensile strain at an initial strain rate of 1.0 × 10⁻⁴ s−1. The strains were determined by measuring the distance between the Vickers indents on the specimen surface (the initial distance was approximately 5 mm).
The PAS was carried out in the central part of the specimens with a Na-22 source covered with Kapton film. The system was a fast-fast coincidence system using a 1.27 MeV γ-ray and two 511 keV annihilation γ-rays. The temporal resolution of the system with a digital oscilloscope was approximately 150 ps and the positron lifetime spectra were collected with a total count of over 3 × 10⁶. The positron lifetime spectra were analyzed using the PALSfit program23) to determine the correlation between vacancy concentration and positron lifetime intensity.
3. Results
3.1 Tensile test
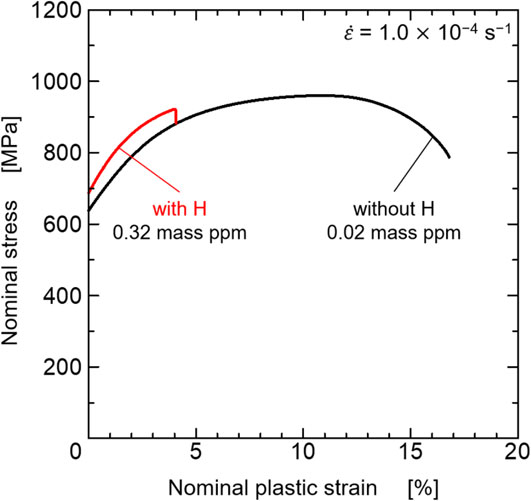
Figure 3 shows nominal stress–strain curves. Hydrogen charging degraded the tensile strength and elongation. In particular, the elongation significantly decreased from 16.8% to 4.1%.
Figure 4 shows the strain distribution in the uncharged and hydrogen-charged specimens immediately before the fracture, obtained by DIC. The uncharged specimen shows a strain localization region associated with necking, while the hydrogen-charged specimen does not. This indicates that hydrogen caused fracture during homogeneous deformation.
3.2 Damage quantification
Figure 5 shows the damage evolution curves. Here, (a) damage area fraction Da, (b) damage number density n, and (c) average damage size dave are plotted against the local strain obtained by DIC. The damage area fraction in the uncharged specimen gradually increases with strain, and subsequently shows a remarkable increase after 66% strain. This trend in damage evolution can be interpreted by considering the behavior of damage initiation and growth. According to Fig. 5(b), damage is initiated at a local strain of 10%, and damage number density increases with increasing local strain. However, the average damage size (Fig. 5(c)) shows an approximately constant value (∼0.5 µm2) from 10% to 66% local strain, indicating that all of damage stop growing once. The average damage size sharply increases when the local strain reaches 66%, which causes a sudden increase in the damage area fraction, as shown in Fig. 5(a). The average damage size curve in Fig. 5(c) can be divided into three stages: (i) damage incubation regime (0–10%), (ii) damage initiation/arrest regime (10–66%), and (iii) damage growth regime (66%–fracture). Hereafter, the damage initiation/arrest regime will be referred to as the damage arrest regime for simplicity. In the following, we present the effects of hydrogen on the three regimes.

First, note (i) the damage incubation regime. Hydrogen accelerates the transition from (i) the damage incubation regime to (ii) the damage arrest regime. Specifically, hydrogen reduces the critical strain in the damage initiation regime to half (from 10% to 4%). Corresponding to the decrease in the critical strain for damage initiation, hydrogen increases the increment rate of damage number density per strain in (ii) the damage arrest regime. As shown in an enlarged image (Fig. 6(b)), the strain range in the damage arrest regime is shortened by hydrogen charging, which indicates that hydrogen reduces the arrestability of microdamage. In (iii) the damage growth regime, the H-charged specimen shows rapid growth in damage compared with the uncharged specimen. Also note that hydrogen alters not only the average size, but also significantly alters the damage configuration. The hydrogen effect on damage configuration is presented in terms of aspect ratio.

Figure 6 shows the average aspect ratio plotted against local strain in the uncharged and H-charged specimens. The aspect ratio a/b was obtained by measuring the damage lengths perpendicular (a) and parallel (b) to the tensile direction. The damage length parallel to the tensile direction b was determined by elliptical approximation of the configuration of each damage configuration. The uncharged specimen showed an average aspect ratio of approximately 1 to 1.7. The aspect ratio began to decrease at a 40% local strain in the damage arrest regime, and then increased when the local strain reached 66% in the damage growth regime. However, the H-charged specimen showed an average aspect ratio of 2.7 to 3.8, namely the damage configuration of the H-charged specimen remained sharp compared with that of the uncharged specimen.
Next, we present the distribution of the number of damage incidents per area-damage size at each local strain. According to the average damage size curves shown in Fig. 5(c), the damage size becomes constant in the damage arrest regime. However, the curve may be insufficient to clarify whether the average trend is intrinsic, namely it could also be assumed that the formation of many tiny damages can apparently make the average size constant, even when main damages grow significantly. Hence, we here present the distribution of the number of damage incidents to understand the statistical characteristics of damage evolution. Figure 7 depicts the analysis results, which clearly indicate the presence of a critical damage size for damage arrest in the damage arrest regime for both uncharged and H-charged specimens. More specifically, the critical sizes in the uncharged and H-charged specimens were ∼1 µm2 and ∼0.5 µm2, respectively. Hence, hydrogen charging decreases the critical damage size for damage arrest.

Figure 8 shows examples of damage in the uncharged and H-charged specimens observed with SE imaging. As seen in Figs. 8(a) and (b), the major damage initiation site in the damage arrest regime was a dumbbell-like martensite grain in both the uncharged and H-charged specimens. After damage initiation, the damage tip was blunted via plastic deformation of neighboring ferrite grains. Particularly in the uncharged specimen, damages were largely elongated in the tensile direction in the damage growth regime. (Fig. 8(c)). Note that the number fraction of largely elongated damages is not large, and thus the average damage aspect ratio exceeds 1 (Fig. 6). In contrast, as shown in Fig. 8(d), the H-charged specimen showed two types of damage even in the damage growth regime: (1) elongated damages (yellow arrow), and (2) damages that propagated perpendicular to the tensile direction (red arrow).
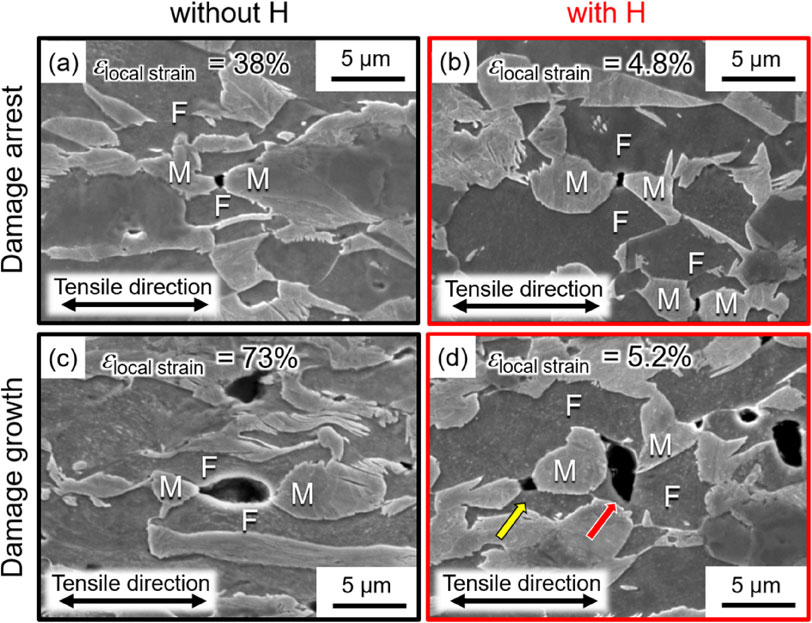
Figure 9 shows the EBSD results and ECC images taken around a damage in the H-charged specimen. The damage was initiated at the dumbbell-like martensite and propagated into the ferrite grain interior. The red lines in Fig. 9(a) indicate {100} traces in ferrite, namely the damage growth path corresponded to a {100} cleavage plane. In addition, a corresponding kernel average misorientation (KAM) map is exhibited in Fig. 9(c). KAM values were observed to be high in martensite that acted as a damage initiation site, and in ferrite where the crack tip was located. Specifically, high KAM regions in ferrite were aligned at a 45° orientation to the tensile direction, as indicated by the white arrow. The grain reference orientation deviations (GRODs) in Fig. 9(d) were also observed to be high near the damage. More specifically, the high KAM regions in Fig. 9(c) are located at the boundary between low and high GROD regions. Hence, the brittle-like damage growth involves plastic deformation. The ECC image in Fig. 9(e) also shows the contrast gradient indicated by the yellow dashed line, which is a feature similar to that in the GROD map. The contrast variation in ECC images can arise from the elastic strain gradient and the plasticity-induced accumulation of dislocations. As seen in Fig. 9(f), the white contrast remains even after a 2° tilt of the specimen, which implies that the change in contrast originates from the dislocation accumulation associated with plastic strain evolution, rather than the elastic strain gradient.

Figure 10 shows the fractographs of the uncharged and H-charged specimens. The fracture surface of the uncharged specimen was fully covered with dimples. In contrast, the center of the fracture surface of the hydrogen-charged specimen was full of quasi-cleavage features (Fig. 10(d)), and the fractographic characteristics gradually changed to a mixture of quasi-cleavage features and dimples when the observation position reaches the edge of the fracture surface. Accordingly, the predominant fractographic feature appeared to be dimples. It is also noteworthy that striation marks with a spacing of approximately 20 µm were observed on the flat surface, as exhibited in Fig. 10(e′).
3.4 PAS
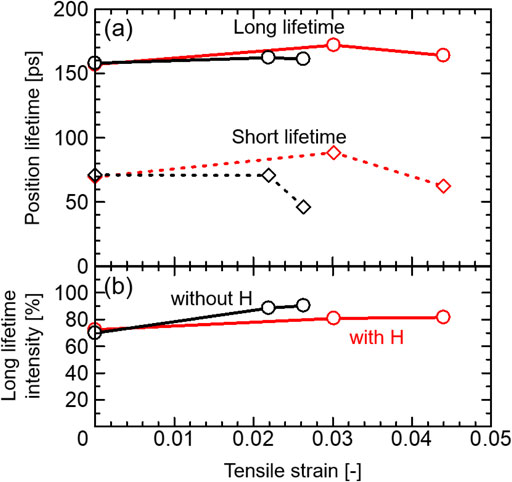
Damage initiation in the hydrogen-charged specimen occurred at a local strain of 4.1% (Fig. 6(b)). Figure 11 shows the results of PAS to examine the lattice defect density associated with damage initiation, namely the PAS was carried out on undeformed and 2–4.5% deformed specimens. As shown in Fig. 11(a), the long lifetime was observed to be 157–170 ps, which corresponds to a value of a mixture of dislocations (117 ps24)) and vacancies (181 ps,24) (including vacancies trapped at dislocation cores24))). Because the experimentally obtained lifetime was close to that for vacancies, the long lifetime of positrons mainly corresponded to vacancy concentration. According to Fig. 11(b), the positron long lifetime increased with increasing strain, regardless of whether hydrogen charging had been conducted. The primary factors that increased vacancy concentration were the dislocation–dislocation interaction, and dislocation annihilation that occurred during plastic deformation.25) In this context, hydrogen has been reported to assist in increasing the vacancy concentration,26,27) but the increasing rate of vacancy concentration per strain in the hydrogen-charged specimen was rather lower than that of the uncharged specimen in the present experiment. This fact indicates that hydrogen charging in the present condition did not cause an acceleration of vacancy formation. However, it should be noted that the positron lifetime is a result of the average behavior of vacancy evolution, therefore the effect of local vacancy formation at a crack tip during crack growth may not be reflected in the present result.
4. Discussion
4.1 Damage incubation regime
The damage incubation regime corresponds to a stage where strain induces the precursors of micrometer-scale damage. According to Figs. 8(a) and (b), the predominant damage initiation site in both the uncharged and H-charged specimens was martensite. In particular, micro-damages were preferentially observed in the necked part of the dumbbell-like martensite, which acted as a stress concentration source. In addition, the stress concentration arising from plastic deformation of the neighboring ferrite can act as a factor to assist damage evolution at the ferrite/martensite interface.4,28) The two types of stress concentrations associated with the martensite shape and strain incompatibility may be the primary cause of damage initiation in martensite. That is, damage initiation is sensitive to microstructure morphology in both the uncharged and H-charged specimens. The effect of hydrogen charging halved strain range of the damage incubation regime (in Fig. 5(c)), namely the critical strain for damage initiation in martensite decreases with hydrogen uptake. Possible hydrogen-related factors that accelerate the damage initiation are a reduction in the cohesive energy of the microstructural interface, and the promotion of vacancy formation near the microstructural interface, which stems from local dislocation accumulation. The former and latter factors contributed to a hydrogen-enhanced decohesion (HEDE) mechanism29,30) and a hydrogen-enhanced strain-induced vacancy (HESIV) mechanism,31,32) respectively. As shown in Fig. 11, the vacancy formation rate per strain in the H-charged specimen is lower than that in the uncharged specimen. Hence, the effect of HESIV was minor in the reduction of the critical strain for damage initiation. Therefore, the other factor, i.e., the hydrogen-reduced cohesive energy that causes HEDE, was considered to be the primary factor accelerating the damage initiation. Previous works have reported the occurrence of HEDE-related martensite cracking in DP steels, specifically, the prior austenite grain boundary and block/lath boundaries act as crack initiation sites,10,33) to which the damage initiation mechanism in the present study may be comparable. In this regard, the plastic strain required for damage initiation played two roles in martensite cracking: (1) increasing the internal stress in martensite grains via work hardening, and (2) increasing local stress at the ferrite/martensite interface associated with the plastic deformation of ferrite.
4.2 Damage arrest regime
In the damage arrest regime, the damage number density increased, but the average damage size was approximately constant with the strain. That is, the damages formed intermittently and subsequently grew; however, the damage growth once stopped (damage was arrested). As an advanced analysis from previous works,8,10) we here present statistical characteristics of the damage evolution. As indicated with Fig. 7, there is a critical damage size for damage arrest, regardless of whether hydrogen-charging was performed (uncharged: ∼1 µm2, H-charged: ∼0.5 µm2). The difference in the critical damage size can be explained in the context of microstructural features. As shown in Figs. 8(a) and (b), the damage initiation site was a necked portion of the martensite. The damage was arrested by blunting the damage tip via the plastic deformation of neighboring ferrite grains. The damage opening to the tensile axis increases average damage size. However, the formation of new micro-damage decreased the average damage size. That is, a balance between the effects of damage blunting and new damage formation brought about an approximately constant value in the average damage size. This behavior in damage evolution was observed in both the uncharged and H-charged specimens. In this context, the difference in the critical damage size for damage arrest as shown in Fig. 7 can be explained from the viewpoint of the hydrogen effect on the aspect ratio of the damage (Fig. 6). As mentioned above, hydrogen charging did not alter the primary damage initiation site, i.e., a necked portion of dumbbell-like martensite. Hence, the average damage length along the tensile axis in the damage arrest regime did not depend on whether hydrogen charging was performed. Accordingly, the increase in the average damage size was attributed to the displacement of the damage opening. Because the aspect ratio a/b was obtained from the damage lengths perpendicular and parallel to the tensile axis a and b, the damage aspect ratio decreased with a damage opening that increased b. Correspondingly, in the uncharged specimen where damages were largely blunted, the damage aspect ratio was approximately 1. In contrast, the damage aspect ratio in the H-charged specimen was 1, which is significantly lower than that of the uncharged specimen. In other words, the smaller critical damage size for damage arrest in the H-charged specimen indicated a reduction in the limit of damage tip blunting by hydrogen uptake.
The damage aspect ratio, namely the damage morphology, significantly affected the ease of damage growth as well. The damage growth mechanism is discussed in the next section.
4.3 Damage growth regime
In the damage growth regime, the local strain reaches a critical value, which causes a sudden increase in the average damage size and the fracture of the specimens (Fig. 5). Hydrogen charging caused a significant difference in the damage growth mechanism. Damages in the uncharged specimen are largely elongated along the tensile direction by the plastic deformation of ferrite (Fig. 8(c)), which indicates that damage evolution is significantly suppressed by damage tip blunting, even in the damage growth regime. In contrast, a damage tip in the H-charged specimen remains sharp during damage growth perpendicular to the tensile direction (Fig. 8(d)). The damage growth path is along the cleavage plane of the ferrite grains and the ferrite/martensite interface. In addition, hydrogen-assisted damage growth involves a significant contribution of plastic deformation, as shown in Fig. 9. To interpret these facts, we must consider two factors: (1) the stress increase at the crack tip associated with plastic deformation, (2) hydrogen-reduced cohesive energy, and (3) hydrogen-altered plastic deformation behavior. First, we note a relationship between plastic deformation and crack tip stress, which was denoted above as factor (1). Plastic deformation at the crack tip decreases local stress via crack blunting; however, progress in work hardening and an increase in stress triaxiality cause an increase in crack tip stress. Accordingly, crack tip stress can satisfy the critical stress for cleavage cracking after plastic deformation. This factor is intrinsically important, even in a case without hydrogen charging, but it is not the reason why the brittle behavior appeared only in the H-charged specimen, because the tensile strength in the H-charged specimen was lower than that in the uncharged specimen, as shown in Fig. 3. Therefore, we next consider factors (2) and (3). Regarding the cleavage plane strength, the hydrogen in iron reduces surface and cohesive energies,29,30) namely the HEDE mechanism can contributes to cleavage cracking in hydrogen-assisted crack growth. Furthermore, as a model for the hydrogen effects on plasticity-driven crack growth, we note the adsorption-induced dislocation emission (AIDE) mechanism.34,35) In this mechanism, hydrogen adsorbed on crack surfaces causes a dislocation emission in the interior of the material, which assists local plastic deformation and subsequent micro-void formation/coalescence at the crack tip. In this context, Chen et al. reported that hydrogen-assisted crack growth in a single crystalline Fe–3 mass%Si alloy under constant load was attributed to micro-cleavage cracking that involved the effect of AIDE-related plastic deformation.36) The crack growth rate at room temperature under a hydrogen atmosphere was approximately 60 nm/s.36) To estimate the significance of the AIDE mechanism in the present study, we here note the crack in Fig. 9, which propagated from martensite to the ferrite grains up to a length of 2a = 6900 nm. Assuming that the crack propagated at a growth rate of 60 nm/s, the crack propagation to reach the crack length shown in Fig. 9 took 58 s. Because the time required from damage initiation to failure was approximately 80 s, the order of time reasonably corresponds to the time estimated from the AIDE-related crack growth rate. Based on this consideration, we assume that the trace of the plastic deformation that evolved at an angle of 45° in Fig. 9 was associated with the AIDE mechanism, and propose the following damage growth model, shown in Fig. 12. ⟨1⟩ Owing to AIDE, the dislocation emission at a crack tip is promoted, which assists crack tip deformation. ⟨2⟩ The AIDE-assisted micro-deformation increases stress triaxiality at the crack tip, which accelerates hydrogen accumulation in a region where the stress triaxiality is at a maximum. The local hydrogen accumulation causes micro-cracking via the HEDE mechanism. ⟨3⟩ Crack growth occurs through coalescence between the micro-crack and the main crack. After the coalescence, the tip shape of the main crack corresponds to that of the micro-crack, which is sharp. Repetition of processes ⟨1⟩ to ⟨3⟩ enables the maintenance of a sharp crack tip during crack growth and is a plausible mechanism by which hydrogen reduces damage arrestability in the damage growth regime.

The final fracture mechanism is also discussed here, based on the fractographic analyses (Fig. 10). The fracture surface of the uncharged specimen was fully covered with dimples, which indicated that the fracture occurred through the coalescence of voids. This is a typical mechanism of ductile fracture. In contrast, the H-charged specimen showed quasi-cleavage features in the central portion of the fracture surface, and the area fraction of the quasi-cleavage fracture region decreased closer to the edge of the fracture surface. Moreover, striation marks aligned perpendicular to the crack growth direction were observed on flat surface regions (Fig. 10(e′)), which was similar to a feature that appeared when the AIDE mechanism was activated.35) This fact also supports the occurrence of AIDE-related damage growth. Consequently, the AIDE-assisted HEDE model, which was suggested above, provides a comprehensive interpretation of hydrogen-accelerated damage evolution and associated premature fracture behaviors in the present DP steel with 0.32 mass ppm hydrogen.
5. Conclusions
In this study, we performed multi-probe characterizations of hydrogen-assisted damage evolution and associated microstructure in a DP steel with a tensile strength of 960 MPa. In particular, PAS, EBSD measurements, and ECC imaging were used to realize multi-scale analysis from the nano- to micrometer scales. Moreover, the effects of hydrogen (0.32 mass ppm H) on damage evolution were classified into damage initiation, arrest, and growth in terms of the shapes of the average damage size curves. Then, the specific effects of hydrogen at each stage were clarified. The obtained conclusions are as follows:
-
(1)
Hydrogen charging assisted the formation of damage in martensite. However, in the PAS measurements, no significant effect of hydrogen in assisting vacancy formation was observed.
-
(2)
Microstructural damages were once arrested, regardless of the presence of hydrogen. The critical damage size for damage arrest was confirmed to exist through statistically reliable damage quantification analysis. The critical damage size was decreased by hydrogen charging, from ∼1 µm2 to ∼0.5 µm2. According to the analyses of the aspect ratio of the damages, the critical damage size corresponded to the limit of crack tip blunting.
-
(3)
H-charging caused brittle-like damage growth on cleavage planes in ferrite grains and at the ferrite/martensite interfaces, which accelerated the damage growth. Cleavage crack growth in ferrite grains involved a significant contribution from local plastic deformation. It was suggested that hydrogen-assisted damage evolution occurred as a result of the cooperative action of local plasticity stemming from AIDE, and cleavage cracking associated with HEDE. Consequently, the hydrogen charging caused a large reduction in the total elongation from 17% to 4%.
Acknowledgements
This study was supported by the Japan Science and Technology Agency (JST) (grant: 20100113) under Industry-Academia Collaborative R&D Program ‘‘Heterogeneous Structure Control: Towards Innovative Development of Metallic Structural Materials”. M. Koyama and K. Tsuzaki acknowledge financial support from JSPS KAKENHI (JP16H06365; JP17H04956).
REFERENCES
- 1) T. Senuma: ISIJ Int. 41 (2001) 520–532.
- 2) C.C. Tasan, M. Diehl, D. Yan, M. Bechtold, F. Roters, L. Schemmann, C. Zheng, N. Peranio, D. Ponge, M. Koyama, K. Tsuzaki and D. Raabe: Annu. Rev. Mater. Res. 45 (2015) 391–431.
- 3) J. Marteau, H. Haddadi and S. Bouvier: Exp. Mech. 53 (2013) 427–439.
- 4) D. Yan, C.C. Tasan and D. Raabe: Acta Mater. 96 (2015) 399–409.
- 5) K. Park, M. Nishiyama, N. Nakada, T. Tsuchiyama and S. Takaki: Mater. Sci. Eng. A 604 (2014) 135–141.
- 6) G. Avramovic-Cingara, Ch.A.R. Saleh, M.K. Jain and D.S. Wilkinson: Metall. Mater. Trans. A 40 (2009) 3117–3127.
- 7) C.C. Tasan, J.P.M. Hoefnagels and M.G.D. Geers: Acta Mater. 60 (2012) 3581–3589.
- 8) N. Uehata, M. Koyama, S. Takagi and K. Tsuzaki: ISIJ Int. 58 (2018) 179–185.
- 9) S. Winkler, A. Thompson, C. Salisbury, M. Worswick, I. Riemsdijk and R. Mayer: Metall. Mater. Trans. A 39 (2008) 1350–1358.
- 10) M. Koyama, C.C. Tasan, E. Akiyama, K. Tsuzaki and D. Raabe: Acta Mater. 70 (2014) 174–187.
- 11) S. Matsuyama: Tetsu-to-Hagané 80 (1994) 679–684.
- 12) T.D. Lee, T. Goldenberg and J.P. Hirth: Metall. Trans. A 10 (1979) 439–448.
- 13) W.W. Gerberich, D.D. Stauffer and P. Sofronis: Proc. 2008 Int. Hydrog. Conf. (Eff. Hydrog. Mater. 2009) pp. 38–45.
- 14) P. Novak, R. Yuan, B.P. Somerday, P. Sofronis and R.O. Ritchie: J. Mech. Phys. Solids 58 (2010) 206–226.
- 15) A. Nagao, C.D. Smith, M. Dadfarnia, P. Sofronis and I.M. Robertson: Acta Mater. 60 (2012) 5182–5189.
- 16) M. Eldrup and B.N. Singh: J. Nucl. Mater. 251 (1997) 132–138.
- 17) R.W. Siegel: Annu. Rev. Mater. Sci. 10 (1980) 393–425.
- 18) K. Sato, T. Yoshiie, T. Ishizaki and Q. Xu: Phys. Rev. B 75 (2007) 094109.
- 19) M. Hatano, M. Fujinami, K. Arai, H. Fujii and M. Nagumo: Acta Mater. 67 (2014) 342–353.
- 20) T. Kumamoto, M. Koyama, K. Sato and K. Tsuzaki: Eng. Fract. Mech. (2019) under review.
- 21) J.M. Chilton and P.M. Kelly: Acta Metall. 16 (1968) 637–656.
- 22) T. Ohmura, K. Tsuzaki and S. Matsuoka: Scr. Mater. 45 (2001) 889–894.
- 23) P. Kirkegaard, M. Eldrup, O.E. Mogensen and N.J. Pedersen: Comput. Phys. Commun. 23 (1981) 307–335.
- 24) Y. Kamimura, T. Tsutsumi and E. Kuramoto: Phys. Rev. B 52 (1995) 879–885.
- 25) C. Hidalgo, G. González-Doncel, S. Linderoth and J. San Juan: Phys. Rev. B 45 (1992) 7017–7021.
- 26) K. Sakaki, T. Kawase, M. Hirato, M. Mizuno, H. Araki, Y. Shirai and M. Nagumo: Scr. Mater. 55 (2006) 1031–1034.
- 27) K. Takai, H. Shoda, H. Suzuki and M. Nagumo: Acta Mater. 56 (2008) 5158–5167.
- 28) M. Calcagnotto, Y. Adachi, D. Ponge and D. Raabe: Acta Mater. 59 (2011) 658–670.
- 29) R.A. Oriani: Annu. Rev. Mater. Sci. 8 (1978) 327–357.
- 30) M. Yamaguchi, K. Ebihara, M. Itakura, T. Kadoyoshi, T. Suzudo and H. Kaburaki: Metall. Mater. Trans. A 42 (2011) 330–339.
- 31) M. Nagumo: ISIJ Int. 41 (2001) 590–598.
- 32) M. Nagumo: Mater. Sci. Technol. 20 (2004) 940–950.
- 33) J. Sun, T. Jiang, Y. Sun, Y. Wang and Y. Liu: J. Alloy. Compd. 698 (2017) 390–399.
- 34) S.P. Lynch: Acta Mater. 36 (1988) 2639–2661.
- 35) S.P. Lynch: Metallography 23 (1989) 147–171.
- 36) X. Chen and W.W. Gerberich: Metall. Trans. A 22 (1991) 59–70.