Abstract
The selective laser melting could be employed in fabrication of near-net shape products for airplane and biomedical applications from Ti–6Al–4V alloy, which is difficult-to-process material. In this method, the localized laser irradiation forms the unique Ti–6Al–4V microstructures which correspond to the laser scanning patterns and local thermal history as it could be observed from sample cross-sections with OM or SEM. In this study, the effects of heat treatments on mechanical properties of Ti–6Al–4V samples produced by selective laser melting are discussed based on quantitative analysis of microstructures with image processing and machine learning tools. It was found that microstructures of heat-treated samples retained their original morphologies and secondary α phase precipitated regularly at β grain boundaries with increased treatment time. These microstructures were appropriately segmented and classified. Each α particle geometrical characteristics were successfully extracted and evaluated by image analysis. Importantly, the hardness of the heat-treated samples was lower compared to that of as-built ones and it tended to increase with the area fraction of α phase, the α particle width, and the nearest neighbor distance between α particles.

1. Introduction
Selective laser melting (SLM) is one of the additive manufacturing (AM) technologies based on powder bed fusion. SLM fabricates near-net-shaped components in one process by stacking a powder layer according to a slice data of the three-dimensional design. The computer aided design (CAD) model of the object to be produced is mathematically sliced into thin layers. Then, the object is fabricated by laser beam irradiation on deposited metal powder layer along the cross-section of the sliced object.1,2) The process has several advantages over conventional manufacturing methods such as reduction of the production steps, reuse of metal powder, and utilization of the high melting point materials. Therefore, it is expected to be applied in various fields such as aerospace, defense, automotive, and biomedical industries.3,4) Since titanium and its alloys have high specific strength and excellent corrosion resistance, they are used in various industries, such as aerospace, chemical processing, power generation, and so on.5) However, titanium and its alloys are difficult to process and machine because of their reactivity and low thermal conductivity.2) Thus, the application of SLM is being promoted for such materials.
For this study, we selected the Ti–6Al–4V composition, which is the most widely used α+β alloy and fabricated our samples by SLM. The formed microstructure was quite different from forged, cast, or rolled materials. Since the high-power laser beam in SLM scans on the Ti–6Al–4V powder layer, the material melts and solidifies rapidly. Such localized laser irradiation occurs continuously layer by layer and unique microstructure is formed. In addition, it was found that materials processed by SLM exhibit a non-equilibrium structure. For example, a fine acicular martensitic structure was reported for Ti–6Al–4V.6) Note that Ti–6Al–4V exhibits phase transformation at 995°C by changing from body-centered cubic (bcc) crystal structure (β phase) at high temperatures to the hexagonal close packed (hcp) structure (α phase) at lower temperatures.7) The martensitic transformation from β to α′ (non-equilibrium phase) occurs at high cooling rate of 18°C/s.8) Consequently, the martensitic transformation occurs in SLM, which is a rapid cooling process, and fine acicular α′ structure is formed.
Besides, Ti–6Al–4V could form other various types of microstructures such as martensite, lamellar, equiaxial, and bi-modal ones. These microstructures can be changed significantly by laser irradiation and heat treatment, and they have an important role in governing of the mechanical properties such as alloy strength, creep resistance, fracture toughness, etc.8) As shown in previous studies,3,6,9) the SLM process produces the martensitic α′ phase giving the high sample yield stress, high tensile strength, and low ductility compared to the traditionally fabricated Ti–6Al–4V samples. To improve the balance of the tensile properties of Ti–6Al–4V products fabricated by SLM, the suitable heat treatment must be performed, which will transform the martensitic α′ phase into other ones.
Although the microstructure of the Ti–6Al–4V greatly affects its mechanical properties, the researches on quantitative evaluations of the corresponding relation are limited. For example, B. Vrancken et al. have been reported that fine α′ of SLMed material coarsened by heat treatment below β-transus, and ductility improved as the heat treatment temperature increased.3) In addition, C.D. Formanoir et al. have been reported the influence of balance between α and prior-β phase formed by heat treatment on the tensile properties.10) Furthermore, the correlation between mechanical properties and averaged width of the α lath structure had been reported,11,12) but without sufficient analysis of complex microstructure patterns and based on limited number of α particles, which could affect the evaluation accuracy. Nevertheless, it showed the potential of image analysis for microstructure quantitative evaluations, corresponding correlations with Ti–6Al–4V mechanical properties, and possibilities of predictions of such properties for samples fabricated by novel SLM processes. Recently, it was also reported that Random Forest (RF) statistical algorithm of machine learning (ML) worked extremely well to segment the complex microstructure patterns in optical microscopy images of steels.13) In this regard, we had applied several new image processing/analysis techniques (including microstructure pattern recognition with ML) on Ti–6Al–4V samples fabricated by SLM, processed by heat treatment at different conditions, and characterized by hardness measurements.
2. Experimental Procedure
2.1 Sample fabrication
The schematics of the SLM machine (Mlab Cusing R, CONCEPT LASER) and laser scanning patterns used for preparing of Ti–6Al–4V specimens are shown in Fig. 1. The Yb:YAG fiber laser with 1070 nm wavelength, 95 W power, and 50 µm spot diameter was used to irradiate the Ti–6Al–4V powder beds. As shown in Fig. 1(b), the zigzag patterns with 100 µm pitch of laser scanning at 900 mm/s were employed. The scanning directions rotated by 90 degrees for each layer. An extra-low interstitial Ti–6Al–4V powder (CL 41Ti, CONCEPT LASER), which was produced via the gas-atomization process, was delivered on the baseplate for SLM. The layer thickness of 25 µm was controlled by a scraper. The powder particle size distribution was measured by using particle counter (MT3300, Microtrac BEL). The measured average size of powder beds was 29 µm. The argon gas was filled into the SLM machine to prevent the oxidation during fabrication process by keeping the oxygen concentration below ∼0.5%. Plate-like specimens of 10 mm × 2 mm × 60 mm dimensions were fabricated to have the major axis perpendicular to the substrate (parallel to the building direction).

In order to relieve the residual stress and control the microstructure, the heat treatment is usually performed on Ti–6Al–4V samples fabricated by additive manufacturing.3,10,14,15)
In this study, the heat treatments were carried out below the β-transus temperature in order to retain the original morphology of the SLMed microstructure. In addition, the long-time heat treatment was performed to investigate the effects of prior-β phase on mechanical properties. Prior to the heat treatment, the specimens were enclosed into the glass with argon gas atmosphere to prevent oxidation. The specimen with coarsen α particles were kept at 920, 940, 960, or 980°C for 2, 10, and 100 hours followed by air cooling (AC) as solution treatment. Then, aging treatment was conducted by keeping the specimens at 700°C for 2 hours, which was followed by furnace cooling (FC).
2.3 Sample observation and hardness test
The cross-sections of the samples were polished with water-based diamond suspensions of 9 µm and 3 µm particles. The final polishing was carried out with a mixture of colloidal silica suspension (0.06 µm) and H2O2 in the ratio of 5:2. Then, the surfaces were etched in Kroll’s reagent containing 90% of H2O, 8% of HNO3, and 2% of HF. The secondary electron images of the sample cross-sections were captured by scanning electron microscope (SEM, JSM-6010 LA, JEOL). All SEM images were taken with constant imaging area of 290 µm × 426 µm for consistent image analyses (see Sec. 2.4 for more details). The microstructures and crystal orientations were observed by electron backscatter diffraction (EBSD, JSM-7001F, JEOL).
In order to investigate the correlations between microstructures and mechanical properties, the micro Vickers hardness tests were performed by using the micro Vickers hardness tester (AMT-7FS, MATSUZAWA) with 1 kgf of loading force and 16 indentation points. The length of the indenter diagonal line was around 70 µm.
2.4 Image analysis
In order to evaluate the geometrical features of Ti–6Al–4V microstructures, the image processing and analysis were performed by using FIJI software package as shown in Fig. 2.16) Three SEM images of each heat-treated specimen were used for such image analyses. The SEM images in Fig. 2(a) show two phases with different contrasts, which correspond to α (primary and secondary) and prior-β phases. The ratio of the α phase was evaluated with RF ML algorithm (see Fig. 2(b) and (c)) by using Trainable Weka Segmentation, which is the FIJI plugin with such ML technique.17,18) It could classify each image pixel to the particular class (α or prior-β phase) with highest probability. The segmentation was performed on PC with i7 CPU and 32 GB RAM. The 200 decision trees, 2 random features per node, 2 decimal places for computational accuracy, and 5 image filters (Gaussian blur, Hessian matrix, Sobel, Gaussian distribution difference, and membrane projection) were used to create the RF Classifier. The out-of-bag (OOB) error for well-trained one was typically ∼1%.
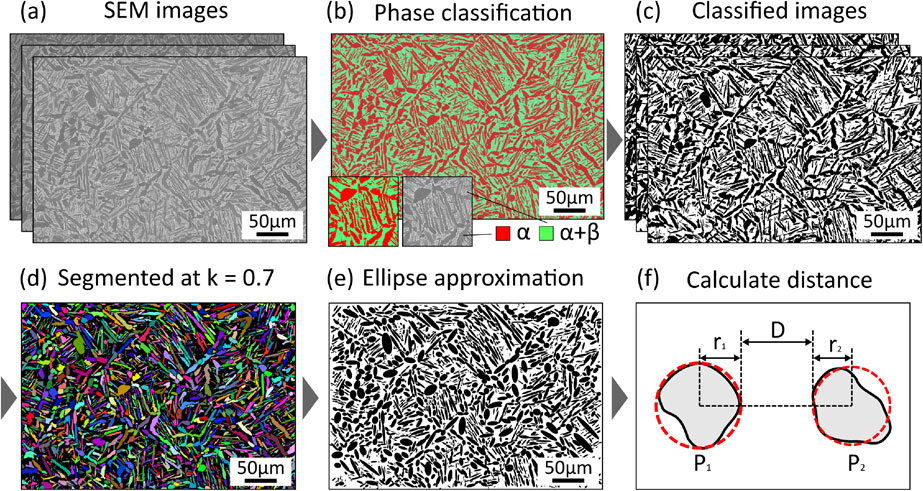
After image segmentation with RF Classifier on α and prior-β phases, the missed borders between α and prior-β phases were reconstructed with additional image processing technique in order to visualize and analyze the individual α particles (see Fig. 2(d) and (e)). In this process, the “Disconnect particles” Xlib plugin for FIJI was applied. This technique is dividing the interconnected particles by using modified watershed segmentation algorithm (MWSA) with user predefined constraint proportionality constant (0 < k < 1) for particle subdivisions.19) For k = 0, the particle divisions are not conducted and, for k = 1, the particles are split at any concavity in their shape. In this study, the k = 0.7 was used for all analyzed images as optimal or best compromise value. Then, ellipses were fitted into each segmented particle and their minor axis values were estimated and averaged for all particles in analyzed images.
In addition, the nearest neighbor distance (NND) between the α particles was also measured from Fig. 2(e) in order to evaluate their distributions in more details. The NND is the image processing plugin for FIJI that can be used to calculate the average size and distance between particles/objects located randomly in image of interest, i.e. it can estimate their closest neighbors in many-particle systems (see Fig. 2(f)). In NND technique, the information on centroid coordinates (X, Y) for each α particle is derived from fitted ellipse approximation. Then, each particle is fitted into the circle with its center at (X, Y) and radius r. The distance between α1 and α2 particles is calculated by following equation:
| \begin{equation}
d=\sqrt{(Y_{2}-Y_{1})^{2}+(X_{2}-X_{1})^{2}}-(r_{1}+r_{2})
\end{equation}
| (1) |
This distance was calculated for each particle and averaged.
20)
3. Results
3.1 Microstructures in SLM samples
Figure 3 shows the EBSD inverse pole figure (IPF) maps of the horizontal (laser irradiated) and vertical (building) cross-sections of as-built sample, which correspond to normal and in-plane incidences of the laser irradiation beam, respectively. The square-like lattice structures corresponding to the laser irradiation pattern are observed on horizontal cross-section (see Fig. 3(a)). The scale-like structures can be also seen at the same interval as the scanning pitch on the vertical sample cross-section (see Fig. 3(b)). Thus, the microstructure morphology depended on the SLM pattern and it was composed of fine α′ martensitic structures due to the high cooling rates.21) Each color in IPF maps indicates the crystal orientation of the α phase. The scale-like structure was composed of α′ particles with the same combination of crystal orientations as shown in Fig. 3(b).

Figure 4 shows the SEM images of the horizontal cross-sections of investigated heat-treated samples. Here, the light and dark gray colors indicate the β and α phases, respectively. Overall, the microstructure of the samples with heat treatment for 2 hours (see Fig. 4(a)–(d)) retained its original morphology such as square-like lattice pattern, primary α plates, and β grain boundaries (compare with Fig. 3(a)). On the other hand, as the heat treatment time increased to 10 and 100 hours, the equiaxed α particles appeared. In samples with the heat treatment at 920 and 940°C for 100 hours (see Fig. 4(i) and (j)), the primary α plates were additionally observed. In samples with heat treatment at 960 and 980°C for 100 hours (see Fig. 4(k) and (l)), only equiaxed α particles surrounded by prior-β phase were detected.

Figure 5 shows the microstructure in vertical cross-section of heat-treated sample at 960°C for 2 and 100 hours. In former case, the primary α plates were coarsened from acicular α′ structure (see Fig. 5(a)), but in later one (see Fig. 5(b)), the equiaxed α particles were regularly arranged similar to scale-like pattern on Fig. 3(b).
3.2 The phase classification by machine learning with Random Forest algorithm
The α and prior-β phases in horizontal cross-sections (see Fig. 4) were segmented with RF ML algorithm. Figure 6 shows the area fraction for primary and secondary α particles at each heat treatment condition obtained with such technique. The area fraction of α (fα) decreased with increase of the heat treatment temperature from 920 to 980°C. In general, the fraction of the prior-β phase (1 − fα) of Ti–6Al–4V increases rapidly with the heat treatment temperature above 900°C.22) The dashed line in Fig. 6 is fα measured by S.M.L. Sastry et al., i.e.23) As it can be seen, our estimated fα were consistent with literature data.
3.3 Evaluation of α particles
Figure 7 shows the average width of α particles estimated from Fig. 2(d) and (e) by using MWSA with k = 0.7. Each segmented particle was approximated by fitted ellipse with its minor axis defined to be the α particle width. From Fig. 7, the average width increased with the heat treatment time. However, the temperature dependence was less pronounced and conclusive compared to the reported increase of α particle width from 940 to 980°C for 100 hours treatment time.24) The deviation of our data point at 920°C for 100 hours was probably due to lower accuracy of image segmentation with MWSA.
3.4 Nearest neighbor distance
Figure 8 shows the result of the nearest neighbor distance between α particles. The distance between α particles gradually increased with heat treatment temperature and time, except 920°C data point due to above reason. As shown in Fig. 6, as the heat treatment temperature increased, the fα was decreased. As a result, the distance between α particles also increased. In addition, the prior-β phase coarsen as the heat treatment time becomes longer.
3.5 Micro Vickers hardness
In order to investigate the relationship between microstructures and the mechanical properties, the Vickers hardness test was performed. As shown in Fig. 9, the hardness of the heat-treated samples was smaller than as-built ones by ∼50 HV. Although, the difference of the hardness between heat-treated samples was small, the hardness decreased with the heat treatment time above 920°C (except for 2 hours treatment). The relationship between micro Vickers hardness and results of image analysis is shown in Fig. 10. The hardness tended to increase with fα, the α particle width, and NND. Again, the hardness of the samples with the heat treatment at 920°C deviated from this tendency.
4. Discussions
In this section, the results on microstructure formation, quantitative evaluation, and micro Vickers hardness test are discussed.
4.1 Microstructure
As shown in Fig. 5(b), the equiaxed α particles were observed after heat treatment along the sample building direction. In addition, such α particles appeared on the boundary of the scale-like structure, which are seen in vertical cross-section. In general, the high angle grain boundary of the β phase has higher interface energy, i.e. where the difference of crystal orientations is greater than 15 degree.25) Therefore, the α phase tends to nucleate preferentially at the high interface energy regions followed by precipitation of the α particles.7,26) As a result, the interface of the scale-like structure is the boundary of the prior-β grains. The mechanism of the scale-like structure formation is demonstrated on Fig. 11(a). As it is known, the laser irradiation forms a semi-circular melting pool and crystal grains grow from its edge to the center.27) Thus, the grains are oblique to the center of the melting pool. Since in SLM process the laser beam is scanned on the powder layer in zigzag pattern, the parts of the neighboring melting pools overlap, which leads to the same crystal orientation of the β phase. Then, the β phase transforms into the α′ martensitic structure during the cooling process in SLM (see Fig. 11(b)). In heat treatment process for 100 hours, the secondary α (equiaxed α) grains precipitate at interface of scale-like structure (see Fig. 11(c)).

The microstructure morphology after the heat treatment depends on used temperature and time. When sample was held between 920 and 940°C for 100 hours, the microstructure was composed of mixture of the α plates (primary α), equiaxed α (secondary α), and prior-β phases (see Fig. 4(i) and (j)). On the other hand, at higher temperatures between 960 and 980°C for 100 hours, just secondary α and prior-β were observed (see Fig. 4(k) and (l)). During heat treatment: 1) the α plates were coarsened from original fine acicular α′, 2) the equiaxed α was precipitated at the high angle grain boundary, and 3) the β phase transformed into the α′ martensite by air cooling. After that, the aging treatment at 700°C was applied to transform the α′ martensite into the fine acicular α and β grain boundaries.21) As the heat treatment temperature increased, the fα decreased (see Fig. 6)22) due to transformation of primary α inside of the scale-like structure into the β phase. Therefore, just two phases of secondary α and prior-β were mainly observed at higher temperatures after 100 hours treatments.
4.2 Evaluation of microstructure
Regarding segmentation results with MWSA at 920°C for 100 hours, the average α particle width must be less than for higher temperatures in contrast to actually estimated value. As shown in Fig. 12(a), some primary α and secondary equiaxed α particles were interconnected between prior-β phases. Then, with k = 0.7 in MWSA, some α particles were under-segmented as shown in Fig. 12(b). As a result, the average α width became larger for this heat treatment condition. On the other hand, the increase of k will cause the excessive segmentation for other heat treatment conditions. This demonstrates the limitation of current approach to use single k value for different treatment conditions and the necessity of deriving suitable criteria for different k applications in a future.
4.3 Hardness
The hardness of the heat-treated samples was lower compared to as-fabricated ones (see Fig. 9) due to decomposition of α′ martensite into stable α+β phase in heat treatments of Ti–6Al–4V above 600∼650°C.28) In addition, since the residual stress was relieved by the heat treatment, it was reasonable that hardness of the sample after the heat treatment decreased.21)
On the other hand, the hardness did not change clearly with heat treatment temperature and time (see Fig. 9). In this study, the aging treatment at 700°C for 2 hours was carried out after solution treatment for homogenizing the fraction of the β phase. Although fα varied depending on solution heat treatment temperature (see Fig. 6), the ratio of the precipitated α and β phases was similar for all specimens. This was probably the reason for hardness invariance on treatment temperature and time. In contrast, it can be predicted that water quenching after solution treatment will transform the prior-β phase into the α′ phase. This should lead to the dependence of hardness on heat treatment conditions. Therefore, it was concluded that balance between α, β, and α′ fractions should greatly affect the sample hardness.
In addition, the oxygen concentration and crystal orientation of the sample may also affect the hardness.29) For Ti–6Al–4V, the oxygen is the strong interstitial α-stabilizing element, which increases the hardness with larger oxygen content.30) As mentioned in Sec. 2.1, the chamber of the SLM machine was under the Argon atmosphere, which kept the oxygen concentration below 0.5%, but the oxidation of the sample may still occur during the SLM process. Besides, the mechanical properties depend on the crystal orientation of the α phase.7) The hardness is lower when the long axis of the indenter is parallel to the c-axis of the hcp lattice and it is larger for orthogonal case.31) Hence, the correlation between hardness and α phase orientation should be studied later in more details. In addition, other mechanical studies such as tensile, fatigue, and creep tests should be carried out and correlated with sample microstructures in a future.
5. Conclusion
Several heat treatments were performed on Ti–6Al–4V samples fabricated by SLM. The formed scale-like microstructures with fine α′ phase were governed by SLM process. At shorter heat treatment time and lower temperature, the microstructure transformation was as following: α′ → primary α (plates) + β grain boundaries. As the treatment time and temperature increased, the α′ transformed into α plates + prior-β + secondary α (equiaxial). Here, the α′ martensite phase coarsened to α plate and equiaxed α phase, which precipitated regularly at the high angle grain boundaries. The observed microstructures were evaluated by image analyses. In phase classification by machine learning with Random Forest algorithm, we successfully segmented the α phase for all heat treatment conditions. On the other hand, in the case of mixed α microstructure of equiaxial and plate phases, which were observed after the heat treatment at 920°C for 100 hours, the estimated width of α particles somewhat deviated from the trend for other heat treatments due to insufficient segmentation with MWSA. Hopefully, this could be improved in a future with k parameter fine tuning at different heat treatment condition. The hardness of the heat-treated samples was lower compared to that of as-built ones and it tended to increase with the area fraction of the α phase, the α particle width, and the nearest neighbor distance between α particles. In summary, the power of image analysis was demonstrated for studies of Ti–6Al–4V samples fabricated by SLM as well as current limitations and further possible improvements were outlined.
Acknowledgments
Part of this work was supported by JSPS KAKENHI Grant Number 17H01369.
REFERENCES
- 1) H.K. Rafi, N.V. Karthik, H. Gong, T.L. Starr and B.E. Stucker: J. Mater. Eng. Perform. 22 (2013) 3872–3883.
- 2) B. Wysocki, P. Maj, A. Krawczynska, K. Rożniatowski, J. Zdunek, K.J. Kurzydlowski and W. Swieszkowski: J. Mater. Process. Technol. 241 (2017) 13–23.
- 3) B. Vrancken, L. Thijs, J.P. Kruth and J.V. Humbeeck: J. Alloys Compd. 541 (2012) 177–185.
- 4) D.D. Gu, W. Meiners, K. Wissenbach and R. Poprawe: Int. Mater. Rev. 57 (2012) 133–164.
- 5) C. Leyens and M. Peters: Titanium and titanium alloys - Fundamentals and Applications, (Wiley-VCH, Weinheim, 2003) pp. 1–22.
- 6) L. Thijs, F. Verhaeghe, T. Craeghs, J.V. Humbeeck and J.P. Kruth: Acta Mater. 58 (2010) 3303–3312.
- 7) G. Lütjering and J.C. Williams: Titanium, 2nd ed., (Springer-verlag, Berlin, 2007) pp. 15–38.
- 8) J. Sieniawski, W. Ziaja, K. Kubiak and M. Motyka: Titanium alloys - Advances in Properties Control, Chapter: Microstructure and mechanical properties of high strength two-phase titanium alloys, (InTech, Rijeka, 2013) pp. 69–80.
- 9) L.E. Murr, S.A. Quinones, S.M. Gaytan, M.I. Lopez, A. Rodela, E.Y. Martinez, D.H. Hernandez, E. Martinez, F. Medina and R.B. Wicker: J. Mech. Behav. Biomed. Mater. 2 (2009) 20–32.
- 10) C.D. Formanoir, A. Brulard, S. Vivès, G. Martin, F. Prima, S. Michotte, E. Rivière, A. Dolimont and S. Godet: Mater. Res. Lett. 5 (2017) 201–208.
- 11) H. Galarraga, R.J. Warren, D.A. Lados, R.R. Dehoff, M.M. Kirka and P. Nandwana: Mater. Sci. Eng. A 685 (2017) 417–428.
- 12) G.V. Vander Voort and A. Roósz: Metallogr 17 (1984) 1–17.
- 13) D.S. Bulgarevich, S. Tsukamoto, T. Kasuya, M. Demura and M. Watanabe: Sci. Rep. 8 (2018) 2078.
- 14) L. Facchini, E. Magalini, P. Robotti, A. Molinari, S. Hoges and K. Wissenbach: Rapid Prototyping J. 16 (2010) 450–459.
- 15) J.P. Kruth, L. Froyen, J.V. Vaerenbergh, P. Mercelis, M. Rombouts and B. Lauwers: J. Mater. Process. Technol. 149 (2004) 616–622.
- 16) J. Schindelin, et al. Nat. Methods 9 (2012) 676–682.
- 17) I. Arganda-Carreras, V. Kaynig, C. Rueden, K.W. Eliceiri, J. Schindelin, A. Cardona and H. Sebastian Seung: Bioinformat. 33 (2017) 2424–2426.
- 18) L. Breiman: Mach. Learn. 45 (2001) 5–32.
- 19) B. Münch, P. Gasser, L. Holzer and R. Flatt: J. Am. Ceram. Soc. 89 (2006) 2586–2595.
- 20) M. Haeri and M. Haeri: J. Open Res. Softw. 3 (2015) e1.
- 21) G.M. Ter Haar and T.H. Becker: Materials 11 (2018) 146.
- 22) T. Seshacharyulu, S.C. Medeiros, W.G. Frazier and Y.V.R.K. Prasad: Mater. Sci. Eng. A 284 (2000) 184–194.
- 23) S.M.L. Sastry, R.J. Lederich, T.L. Mackay and W.R. Kerr: JOM 35 (1983) 48–53.
- 24) X.Y. Zhang, G. Fang, S. Leeflang, A.J. Böttger, A.A. Zadpoor and J. Zhou: J. Alloys Compd. 735 (2018) 1562–1575.
- 25) W.T. Read and W. Shockley: Phys. Rev. 78 (1950) 275.
- 26) S.M.C. van Bohemen, A. Kamp, R. Petrov, L.A.I. Kestens and J. Sietsma: Acta Mater. 56 (2008) 5907–5914.
- 27) K. Sindo: Welding metallurgy, 2nd ed., (John Wiley and Sons, Hoboken, 2003).
- 28) X. Tan, Y. Kok, W.Q. Toh, Y.J. Tan, M. Descoins, D. Mangelinck, S.B. Tor, K.F. Leong and C.K. Chua: Sci. Rep. 6 (2016) 26039.
- 29) Y.T. Lee and G. Welsch: Mater. Sci. Eng. 128 (1990) 77–89.
- 30) I. Sacristan, A. Garay, E. Hormaetxe, J. Aperribay and P.J. Arrazola: Int. Adv. Man. Tec. 86 (2016) 2989–3005.
- 31) F. Larson and A. Zarkades: MCIC report MCIC-74-20 (1974) pp. 16–23.


