Abstract
In order to understand the characteristics of the wastewater treatment method using zero-valent magnesium granules, the reaction between an aqueous solution containing boron and zero-valent magnesium granules was investigated by experiments and a reaction rate model. Particular attention was paid to the effect of adding hydrochloric acid before adding zero-valent magnesium and to the effect of adding sodium hydroxide to adjust the pH to 10.5 after 110 minutes. The following findings were obtained. The relationship between the pH and the dissolved magnesium concentration over time is determined by a reaction formula in which zero-valent magnesium granules react with an aqueous solution to generate Mg2+ ions while generating hydrogen. When magnesium hydroxide is produced, the pH becomes constant over time. Increasing the concentration of hydrochloric acid lowers the pH value reached. This relationship is determined in equilibrium with magnesium hydroxide. The reaction rate of the zero-valent magnesium granules is determined as the first-order reaction of the hydrogen ion activity when the pH was lower than 2.3 or higher than 8.5, and as the zero-order reaction of the hydrogen ion activity at pH from 2.3 to 8.5. The amount of magnesium hydroxide produced without the addition of sodium hydroxide is determined by the above-described reaction rate model of zero-valent magnesium granules. The boron concentration of the solution when the pH is adjusted to 10.5 by adding sodium hydroxide is determined by the Langmuir-type sorption isotherm of boron to the magnesium hydroxide produced. As described above, the behavior of removing boron from an aqueous solution using zero-valent magnesium granules can be well reproduced by the simple reaction rate model used in this study, and it can be said that it is useful for process design.
1. Introduction
Nickel plating is used for surface treatment of automotive parts etc. to improve corrosion resistance. A typical bath type of electro nickel plating is a Watts bath. The Watts bath contains about 30 to 40 g/L of H3BO3. The plating solution that adheres to the product after plating should be removed by washing with water, which generates wastewater containing boron. Since excessive boron intake can harm the human body, the World Health Organization (WHO) has set a drinking water quality guideline for boron below 2.4 mg/L.1) In Japan, the Ministry of the Environment has set an environmental standard of less than 1 mg/L and has set a uniform effluent standard of less than 10 mg/L when discharged into public water bodies other than sea areas.
Many methods have been proposed for treating wastewater containing boron, such as an adsorption method using various adsorbents such as chelating resins, and a membrane separation method such as electrodialysis or reverse osmosis.2–4) There is a coagulation sedimentation method that removes boron by coprecipitation with hydroxides produced by adding an alkali agent such as Ca(OH)2 together with a coagulant such as Al2(SO4)3 and poly aluminum chloride.5–7) This method has disadvantages to require large amounts of chemicals and hence to lead a large amount of generated sludge.
Removal methods using adsorbents such as metaethringite,8) Mg–Al layered double hydroxides, and the oxides prepared by calcining them9–12) have also been reported. Better processing methods with low cost and effectiveness to remove boron are being sought.
Generally, MgO is known as a neutralizing agent that has high sedimentation of sludge and is effective for the volume reduction.13–16) It is also known that the use of magnesium salts in the coagulation sedimentation method improves cohesion and improves processing performance.17) The surfaces of MgO and Mg(OH)2 have the following features: a positive charge over a wide pH range, an extremely high isoelectric points of pH 10.75 for MgO18) and pH 11 for Mg(OH)2,19) and a high cohesiveness due to a small surface charge under neutralization conditions.
Boron is generally considered difficult to be removed from water since it is present in aqueous solutions as an uncharged dissolved species in the acidic to neutral pH region and as an anion in the alkaline region. However it has been shown that boron can be removed by adsorption20–24) or coprecipitation25,26) with MgO or Mg(OH)2. Higashi et al.25) showed that adding a certain amount of MgCl2 to the simulated washing water for nickel plating and adjusting the pH to 10.5 reduced the B concentration to below the wastewater standard. However, Mg-based neutralizing agents are expensive and are currently used only to a limited extent.
On the other hand, a wastewater treatment method utilizing the strong surface activity of zero-valent magnesium has been proposed as a more efficient and low-cost treatment method.27) The increase in scrap accompanying the use of magnesium as a housing for personal computers and mobile phones has created a need for zero-valent magnesium recycling. Therefore, the use of zero-valent magnesium for wastewater treatment is expected as a method for recycling magnesium scrap recovered from the city.
When zero-valent magnesium granules are added to the solution, the pH increases with the generation of hydrogen, and Mg(OH)2 is produced on the surface of the zero-valent magnesium. In addition, zero-valent magnesium has the following advantages: its high activity, fast reaction and strong reducing action. Furthermore, removal by substitution precipitation, generation of ions or compounds having low valence, and generation of hydride can be expected. The easy separation of the added unreacted zero-valent magnesium granules from the generated hydroxide is effective in reducing the sludge amount.
So far, zero-valent magnesium granules have been shown to be able to remove As,28) B, Zn,29) Cr,30) and Ni31) from solutions to low concentrations under certain conditions. The removal mechanism is thought to be mainly the production of hydroxide due to the increase in pH with the generation of hydrogen, and the adsorption and compounding of the produced magnesium hydroxide but has not been quantitatively evaluated.
Other studies on wastewater treatment using zero-valent magnesium include reductive decomposition of nitric acid32,33) and reduction of hexavalent chromium.34,35) However, there are few studies on the basics of process characteristics for wastewater treatment using zero-valent magnesium granules.36) To expand and apply zero-valent magnesium granules to the treatment of various types of wastewater in the future, it is necessary to control the wastewater treatment system and evaluate the treatment using zero-valent magnesium granules. The quantitative clarification and understanding of the phenomenon are essential.
In this study, from the viewpoint of wastewater treatment for removing boron from aqueous solution, the reaction between aqueous solution containing boron and zero-valent magnesium granules was investigated by experiments and reaction rate models.
2. Experimental
Figure 1 shows the experimental apparatus for the boron removal treatment and Table 1 shows the experimental conditions. The initial boron concentration of the aqueous solution to be treated was set to 9.2 × 10⁻³ mol L−1 with reference to the actual operation of nickel plating.37)

Table 1 Experimental conditions for the boron removal treatment.
HCl was added to the aqueous solution to be treated, and the HCl concentration was set to 0.00, 0.12, 0.25, 0.49, 0.99 mol L−1 before adding the zero-valent magnesium granules. 200 mL of the aqueous solution to be treated was placed in a borosilicate glass 300 mL beaker with an inner diameter of 73.5 mm and with a height of 103 mm. The beaker was placed in a constant temperature water bath in a transparent glass container to set the temperature of the aqueous solution to be treated at 30°C. The solution was stirred at 500 rpm with a rod-type stirrer (35 mm × ϕ10 mm). pH was measured continuously with a glass electrode (Horiba 9621 GRT composite electrode), oxidation-reduction potential (ORP) was measured with a platinum electrode (Horiba 9300 Pt composite electrode), and dissolved oxygen concentration (DO) was measured with a diaphragm galvanic electrode (Horiba 9520). As the zero-valent magnesium, granules manufactured by EMD Millipore Corporation were used, having a purity of 99% and a size of 2 mm × 1 mm × 0.5 mm, and the average mass per granule was 1.15 mg. 4.0 g of zero-valent magnesium was added to the aqueous solution to be treated, and that time was defined as 0 min at the start of the experiment. At 110 min, a sodium hydroxide solution with a concentration of 4.0 mol L−1 was added to the solution to bring the pH to 10.5. The stirring was stopped at 140 min, and the solution was allowed to stand for 10 min. The solution was collected with a syringe at predetermined times, filtered under pressure, the filtrate was diluted with a nitric acid solution, and the boron and magnesium concentrations were measured by ICP-AES (Inductively Coupled Plasma-Atomic Emission Spectroscopy). By treating the solution containing no boron in the same manner, it was confirmed that boron was not eluted from the reaction vessel.
After the experiment, suction filtration was performed using a membrane filter (diameter 47 mm, pore size 0.2 µm, ADVANTEC A020A047A). The obtained product was frozen in a freezer for 2 hours, dried for 18 hours using a freeze dryer, and weighed. In addition, experiments in which the treatment was stopped at 110 minutes before the addition of the aqueous sodium hydroxide solution were also performed, and the products were similarly collected and measured for mass.
The amount of the sorbent was determined from the mass of the obtained product assuming that all the products were Mg(OH)2. On the other hand, the amount of the sorbed boron was determined from the initial volume of the solution and the boron concentrations before and after the experiment. The sorption density Q (mol-B mol-Mg(OH)2−1) was determined by dividing the amount of sorbed boron by the amount of sorbent material.
3. Reaction Kinetic Model
3.1 Overview
Magnesium is stable in the oxidized state in an aqueous solution. When zero-valent magnesium is added to the aqueous solution, the oxidation reaction proceeds on the surface, but unreacted zero-valent magnesium remains. The surface reaction of zero-valent magnesium is assumed as the rate-determining step in this kinetic model. Magnesium is supplied to the aqueous solution at a rate at which the zero-valent magnesium reacts with the aqueous solution, and the unreacted zero-valent magnesium exists as granules, and the size decreases with the reaction.
It was also assumed that equilibrium was established in the aqueous system supplied with zero-valent magnesium, including the solid phase Mg(OH)2. The reaction rate of the zero-valent magnesium (the rate of supply to the aqueous system) per unit surface area was also assumed to be dependent on the solution pH. Boron is assumed to be removed by isothermal sorption in Langmuir type to the precipitated Mg(OH)2. PHREEQC38) was used for the calculation, and the attached minteq.v4.dat was used as the thermodynamic data. As the solid phase of Mg(OH)2, there are two phases in the database: the stable Brucite and the metastable Mg(OH)2(active). It is assumed that only Mg(OH)2(active) precipitates with a saturation index of 0. Based on the above assumptions, the time-dependent changes in the concentrations of various dissolved species and the amount of precipitates were calculated. Additional information on the surface reaction rates and the isothermal sorption is described in the following sections.
3.2 Surface reaction rates
The first-order reaction to the hydrogen ion activity was assumed in the acidic region below pH1 (region I) and in the alkaline region above pH2 (region III). The zero-order reaction was assumed between those pHs (region II). Since the reaction rate value is continuous at the critical pH, the rate constants in regions II and III can be expressed using the rate constant in region I, kI, and the critical pH values of pH1 and pH2. The reaction rate per unit surface area of zero-valent magnesium, rMg (mol m−2 s−1), is given by the following equations.
| \begin{equation}
\text{Region I}\ (\text{pH} < \text{pH}_{1})\ r_{\text{Mg}} = k_{\text{I}}\,\text{a}_{\text{H+}} = k_{\text{I}} \times 10^{-\text{pH}}
\end{equation}
| (1) |
| \begin{equation}
\text{Region II}\ (\text{pH}_{1} \leq \text{pH} < \text{pH}_{2})\ r_{\text{Mg}} = k_{\text{II}} = k_{\text{I}} \times 10^{-\text{pH${_{1}}$}}
\end{equation}
| (2) |
| \begin{align}
\text{Region III}\ (\text{pH} \geq \text{pH}_{2})\ r_{\text{Mg}}& = k_{\text{III}}\,\text{a}_{\text{H+}} \\
& = k_{\text{I}} \times 10^{-\text{pH${_{1}}{}\,$+pH${_{2}}$}} \times 10^{-\text{pH}}
\end{align}
| (3) |
The difference in the pH dependence of the reaction rate of zero-valent magnesium in the pH range was determined with reference to Iitaka’s researches.39–42) In region I, the reaction rate depends on the hydrogen ion activity since zero-valent magnesium reacts with hydrogen ions as shown in eq. (4). In region II, the reaction rate does not change with the hydrogen ion activity since zero-valent magnesium reacts with water as shown in eq. (5). Although the reason why the reaction rate depends on the hydrogen ion activity in region III is not clear, it has been described that the high viscosity of the solution at high pH suppresses both the diffusion of the solution and hydrogen gas release.40)
| \begin{equation}
\text{Mg} + \text{2H$^{+}$} \to \text{Mg$^{2+}$} + \text{H$_{2}$}
\end{equation}
| (4) |
| \begin{equation}
\text{Mg} + \text{2H$_{2}$O} \to \text{Mg$^{2+}$} + \text{H$_{2}$} + \text{2OH$^{-}$}
\end{equation}
| (5) |
The reaction rate RMg (mol s−1) can be obtained by eq. (6) using the total surface area of zero-valent magnesium, S (m2).
| \begin{equation}
R_{\text{Mg}} = S\,r_{\text{Mg}}
\end{equation}
| (6) |
The shape of the used zero-valent magnesium is approximated as n spheres of uniform size. When the initial total amount of material is M0 (mol) and the amount of material Mt (mol) is consumed by the reaction, the total surface area S (m2) of the zero-valent magnesium is expressed by eq. (7). Here, the density and the molar mass of zero-valent magnesium were expressed as ρ (kg m−3) and m (kg mol−1).
| \begin{equation}
S = (36\pi n)^{1/3}\left(\frac{mM_{0}}{\rho}\right)^{2/3}\left(1-\frac{M_{t}}{M_{0}}\right)^{2/3}
\end{equation}
| (7) |
It is assumed that H2BO3− sorbs in Langmuir type to the generated Mg(OH)2. Denoting the saturated sorption density as Qs (mol-B mol-Mg(OH)2−1) and the sorption equilibrium constant as K (L mol−1), the relationship between the sorption density Qe (mol-B mol-Mg(OH)2−1) and the equilibrium activity of H2BO3− in the solution, $a_{e,\text{H}_{2}\text{BO}_{3}{}^{ - }}$, is given by eq. (8).
| \begin{equation}
Q_{e} = \frac{Ka_{e,\text{H${_{2}}$BO${_{3}}{^{-}}$}}}{1+Ka_{e,\text{H${_{2}}$BO${_{3}}{^{-}}$}}}Q_{s}
\end{equation}
| (8) |
Equation (9) gives the relationship between the equilibrium activity of H2BO3− in solution, $a_{e,\text{H}_{2}\text{BO}_{3}{}^{ - }}$ (mol L−1), and the molar concentration of total boron in the solution, Ce (mol L−1).
| \begin{equation}
a_{e,\text{H${_{2}}$BO${_{3}}{^{-}}$}} = \gamma C_{e,\text{H${_{2}}$BO${_{3}}{^{-}}$}} = \gamma fC_{e} = \gamma_{T}C_{e}
\end{equation}
| (9) |
γ (−) is the activity coefficient of H
2BO
3−,
$C_{e,\text{H}_{2}\text{BO}_{3}{}^{ - }}$ (mol L
−1) is the molar concentration of H
2BO
3−,
f (−) is ratio of the molar concentration of H
2BO
3− to the molar concentration of total boron, and γ
T (= γ
f) (−) is the total activity coefficient of H
2BO
3−. γ is specified in minteq.v4.dat to be calculated by the extended Debye-Huckel equation.
f is obtained by the equilibrium calculation.
Table 2 shows the values of factors relating to the reaction rate and the sorption isotherm used in the calculation. The factors related to the reaction rate were determined so that the calculated results of the time-dependent changes in pH agree with the measured results, which will be explained in section 4.3 and for Fig. 7. Figure 2 shows the pH dependence of the zero-valent magnesium supply rate per unit surface area of the zero-valent magnesium, rMg. The factors related to the sorption isotherm were determined so that the calculated results of the sorption isotherm agreed with the literature isotherm and the experimental isotherm in this study, which will be explained in section 4.6 and for Fig. 15.

Table 2 Values of factors relating to the reaction rate and the sorption isotherm used in the calculations.
4. Results and Discussion
4.1 Temporal change of measured values
Figure 3 shows the temporal change in the measured values of (a) pH, (b) magnesium concentration and (c) boron concentration, for each HCl concentration. First, the behavior from the addition of zero-valent magnesium to 110 min before the addition of sodium hydroxide solution will be described. As shown in Fig. 3(a), regardless of the concentration of HCl, the pH rapidly increased within 10 min after the addition of zero-valent magnesium, and then became constant. At 10 min, the pH was 9.9 for the HCl concentration of 0.00 mol L−1, and the pH was 9.2 for the HCl concentration of 0.99 mol L−1. The higher the HCl concentration, the lower the pH reached. As shown in Fig. 3(b), the magnesium concentration sharply increased for 10 min from the start of the experiment, and then became constant. The magnesium concentration at 110 min was 2.8 × 10⁻³ mol L−1 for the HCl concentration of 0.00 mol L−1 and 407 × 10−3 mol L−1 for the HCl concentration of 0.99 mol L−1. The higher the hydrochloric acid concentration, the higher the magnesium concentration reached. Zero-valent magnesium dissolves by reaction with acid as shown in eq. (4) or by reaction with water as shown in eq. (5). The effect of dissolution due to the reaction with the acid shown in eq. (4) was significant, indicating that the concentration of Mg2+ supplied from zero-valent magnesium could be controlled by the concentration of HCl. As shown in Fig. 3(c), when the HCl concentration was 0.25 mol L−1 or more, the boron concentration decreased by 1 × 10⁻³ mol L−1 from the initial concentration of 9.2 × 10⁻³ mol L−1 within 1 min after the addition of zero-valent magnesium. After that, it gradually decreased and reached 7 × 10⁻³ mol L−1 at 110 min.
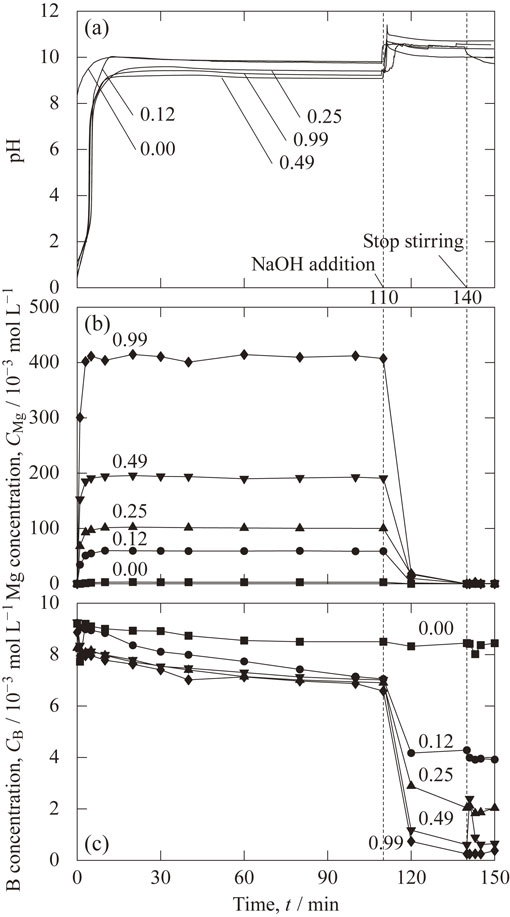
Next, the behavior after adjusting the pH to 10.5 by adding sodium hydroxide solution at 110 min will be described. The magnesium concentration was 0 × 10−3 mol L−1 regardless of the hydrochloric acid concentration. The boron concentration rapidly decreased and was lower with the higher hydrochloric acid concentration. When the stirring was stopped at 140 min, the boron concentration tended to slightly decrease upon standing, but the decrease was small.
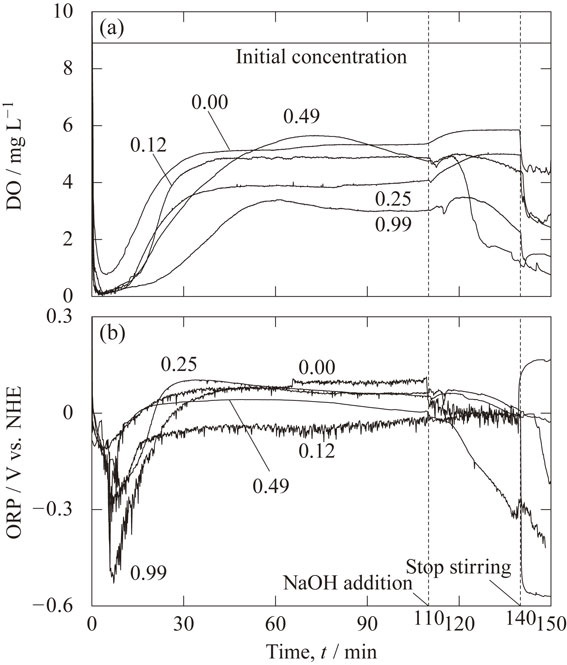
Figure 4 shows the temporal change in the measured values of (a) DO and (b) ORP, for each HCl concentration. The DO decreased from 8.9 mg L−1 at the start of the experiment for 5 min, then increased slowly and became constant at 3 to 6 mg L−1. The reason why the oxygen was removed from the water is considered to be that hydrogen bubbles were generated by the reaction with the acid as shown in eq. (1) in the early stage, and the dissolved oxygen moved to the bubbles with low oxygen partial pressure. After 20 min, the pH is high (Fig. 3(a)), but hydrogen bubbles are generated by the reaction with water shown in eq. (5). Since oxygen is supplied from outside the reactor and the generation rate of hydrogen bubbles is lower in the alkaline region than in the acidic region, the DO in the alkaline region is higher than in the acidic region. Nevertheless, since the DO is lower than the initial value of 8.9 mg L−1, it is considered that dissolved oxygen is being removed by the generated hydrogen bubbles even in the alkaline region. The DO is not stable with respect to conditions and time since the supply of oxygen from outside the reactor is not strictly controlled. It was found that the ORP decreased with decreasing the DO and increased with increasing the DO.
In Fig. 3 as explained in section 4.1, both the Mg2+ concentration and pH increased by the reaction of zero-valent magnesium with the acid as shown in eq. (4), but became almost constant after 30 min. The relationship between the pH and the dissolved magnesium concentration over time is shown in Fig. 5. The plot points show the measured values, and the solid lines show the calculated values. The dissolved magnesium concentration increases as the hydrochloric acid concentration increases, and it can be seen that the concentration change in the acidic region is large except when hydrochloric acid is not added. In other words, it was confirmed that the mass balance of the reaction shown in eq. (4) could explain the temporal change of pH and Mg concentration.

In Fig. 5, the relationship between the pH and the dissolved magnesium concentration is shown by the broken line when Mg(OH)2 is present and the reaction shown in eq. (10) is in equilibrium. The activity coefficient was set to 1. Both the Mg2+ concentration and the pH increased and reached constant values after 30 min as shown in Fig. 3. This can be attributed to the generation of Mg(OH)2. Under equilibrium with Mg(OH)2, the higher Mg2+ concentration increases the H+ concentration (lower pH). It can be said that the reached pH becomes lower with the higher HCl concentration because the Mg2+ concentration with the higher HCl concentration is higher when Mg(OH)2 starts to form.
| \begin{equation}
\text{Mg$^{2+}$} + \text{2 H$_{2}$O} = \text{Mg(OH)$_{2}$} + \text{2 H$^{+}$}
\end{equation}
| (10) |
The solid line showing the calculated value for each HCl concentration reaches the right side slightly beyond the broken line. This is due to the calculated activity coefficient of Mg2+ from 0.3 to 0.6 for the ionic strength from 0.01 to 1.5 mol L−1. On the other hand, the value reached in the experiment is slightly to the left of the dashed line, indicating that more stable magnesium hydroxide was formed than the metastable Mg(OH)2 (active) used in the calculation.
Figure 6(a) shows the measured and calculated effect of hydrochloric acid concentration on the dissolved magnesium concentration reached at 110 min just before adding the sodium hydroxide solution. Both the measured and calculated dissolved magnesium concentration increases linearly with increasing hydrochloric acid concentration. Half of the added hydrochloric acid concentration becomes the reached magnesium concentration because two hydrogen ions generate one magnesium ion according to the reaction shown in eq. (4). The experimental magnesium concentration was lower than the relationship, but the cause is unknown.
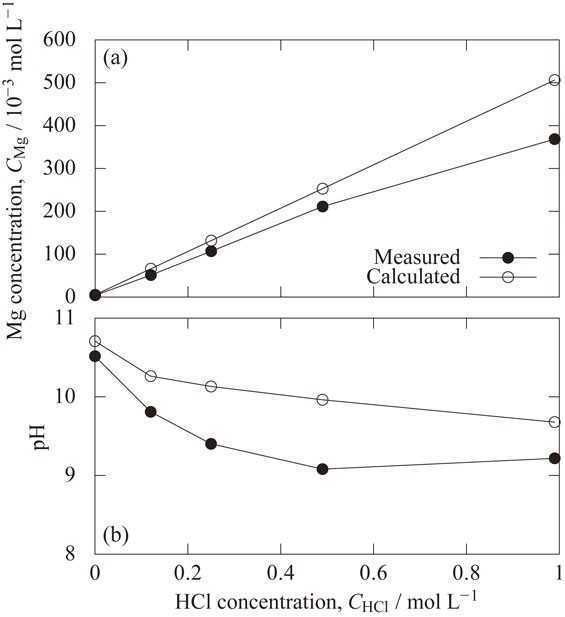
Figure 6(b) shows the measured and calculated effect of hydrochloric acid concentration on the pH reached at 110 min just before adding the sodium hydroxide solution. Both the measured and calculated pH decreases with increasing hydrochloric acid concentration due to the higher magnesium concentration as shown in Fig. 6(a). The measured pH is lower than the calculated value. This is presumably because, as explained in Fig. 5, magnesium hydroxide was formed which was more stable than the metastable Mg(OH)2 (active) used in the calculation.
4.3 Dependence of decreasing rate of hydrogen ion activity on pH
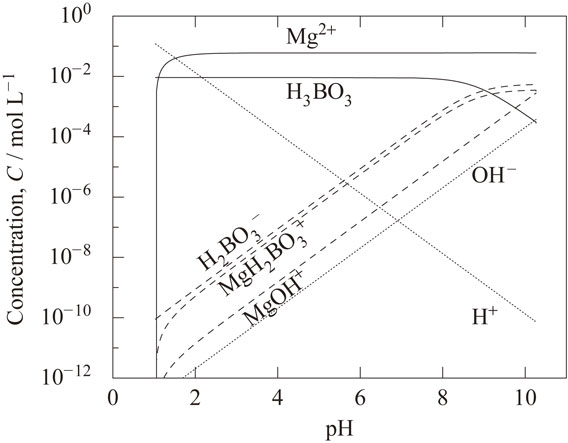
Figure 7 shows the dependence of the decreasing rate of hydrogen ion activity on pH after the addition of zero-valent magnesium. The solid line shows the measured value and the broken line shows the calculated value. The log of the decreasing rate decreased proportionally with pH in the range of pH 1 to 2.3. It was constant in the range from pH 2.3 to 5 and decreased with pH above 5. The measured and calculated results agree well. Therefore, the assumption shown in section 3.2 was determined to be appropriate; the reaction rate (supply rate) of magnesium is proportional to the hydrogen ion activity in the region I (below pH 2.3) and region III (above pH 8.5) and is constant in region II (from pH 2.3 to 8.5). Although the supply rate of magnesium in the pH range from 4 to 7 is set constant irrespective of pH, the decreasing rate of the hydrogen ion activity decreases with pH as shown in Fig. 7. Figure 8 shows the calculated relationship between pH and the concentrations of the dissolved species. The addition of zero-valent magnesium not only decreases the H+ concentration according to eq. (4) but also increases in concentrations of H2BO3−, MgH2BO3+ and MgOH+. The formation reactions of these dissolved species as shown in eq. (11) to eq. (13) supply hydrogen ion, which means that they exhibit a buffering action against the pH change.
| \begin{equation}
\text{H$_{3}$BO$_{3}$} = \text{H$_{2}$BO$_{3}{}^{-}$} + \text{H$^{+}$}
\end{equation}
| (11) |
| \begin{equation}
\text{Mg$^{2+}$} + \text{H$_{3}$BO$_{3}$} = \text{MgH$_{2}$BO$_{3}{}^{+}$} + \text{H$^{+}$}
\end{equation}
| (12) |
| \begin{equation}
\text{Mg$^{2+}$} + \text{H$_{2}$O} = \text{MgOH$^{+}$} + \text{H$^{+}$}
\end{equation}
| (13) |
Since the concentrations of H2BO3− and MgH2BO3+ become higher than the concentration of H+ at pH above 5.5 as shown in Fig. 8, the buffering action by these species become strong around this pH. This is the reason why the decreasing rate of the hydrogen ion activity decreases with pH as shown in Fig. 7 although the supply rate of magnesium in the pH range from 4 to 7 is set constant.
4.4 Concentration of precipitated magnesium hydroxide
Figure 9(a) shows the effect of hydrochloric acid concentration on the concentration of precipitated magnesium hydroxide at 110 min before NaOH addition. Regarding the measured values, the concentration of the precipitated magnesium hydroxide was 1.3 × 10⁻³ mol L−1 with the hydrochloric acid concentration of 0.00 mol L−1, and 7.6 × 10⁻³ mol L−1 with the hydrochloric acid concentration of 0.99 mol L−1. Higher precipitated magnesium hydroxide concentrations were obtained at higher HCl concentrations. The values obtained from the reaction rate model agree well with the experimental values. The reason that the concentration of precipitated magnesium hydroxide increases with hydrochloric acid concentration is that the higher the HCl concentration, the lower the reached pH, as shown in Fig. 6(b), and the higher the magnesium supply rate, as shown in Fig. 2.
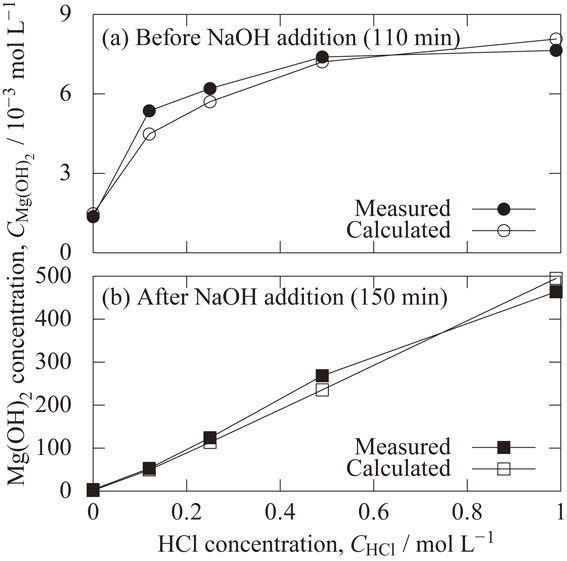
Figure 9(b) shows the effect of hydrochloric acid concentration on the concentration of precipitated magnesium hydroxide at 150 min after NaOH addition. The concentration of precipitated magnesium hydroxide is proportional to the concentration of hydrochloric acid, with a slope of 0.5. It is consistent with the reached dissolved magnesium concentration before the addition of the sodium hydroxide solution shown in Fig. 6(a). Therefore, adding sodium hydroxide solution to adjust the pH to 10.5 means that most of the dissolved magnesium became precipitated magnesium hydroxide. It was confirmed that the concentration of dissolved magnesium reached before the addition of sodium hydroxide could be controlled by the concentration of hydrochloric acid, and that the concentration of precipitated magnesium hydroxide could be controlled by adjusting the pH to 10.5.
4.5 Calculated mole fractions of dissolved boron species and activity of H2BO3−
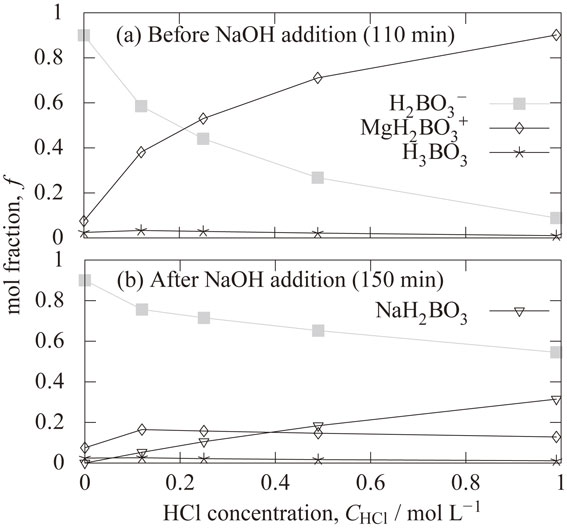
Figure 10(a) shows the calculated effect of hydrochloric acid concentration on the mole fractions of dissolved boron species reached at 110 min just before adding the sodium hydroxide solution. It can be seen that the mole fraction of H3BO3 is low. This is because the equilibrium of the reactions of eq. (11) and eq. (12) have shifted to the right due to the high pH from 9.7 to 10.7 as shown in Fig. 6(b). The decrease in the H2BO3− mole fraction and the increase in the MgH2BO3+ mole fraction were found as the hydrochloric acid concentration increased. Equation (14) is obtained from eq. (11) and eq. (12).
| \begin{equation}
\text{H$_{2}$BO$_{3}{}^{-}$} + \text{Mg$^{2+}$} = \text{MgH$_{2}$BO$_{3}{}^{+}$}
\end{equation}
| (14) |
Equilibrium of eq. (14) suggests that the ratio of H2BO3− and MgH2BO3+ concentrations is independent of pH, increasing Mg2+ concentration lowers H2BO3− concentration and increases MgH2BO3+ concentration. The reasons for the decrease in the H2BO3− mole fraction and the increase in the MgH2BO3+ mole fraction with the hydrochloric acid concentration as shown in Fig. 10(a), is attributed by the increase in Mg2+ concentration as shown in Fig. 6(a). When the hydrochloric acid concentration was changed from 0 mol L−1 to 0.99 mol L−1, the mole fraction of H2BO3− decreased from 0.90 to 0.09. It becomes 1/10 times by the addition of the hydrochloric acid.
Figure 10(b) shows the calculated effect of hydrochloric acid concentration on the mole fractions of dissolved boron species at 150 min (at pH of 10.5 after NaOH addition). The decrease in the H2BO3− mole fraction and the increase in the NaH2BO3 mole fraction were found as the hydrochloric acid concentration increased. The added NaOH concentration required to bring the pH to 10.5 increases with higher HCl concentration. H2BO3− changed to NaH2BO3 according to eq. (15) due to high concentration of Na+.
| \begin{equation}
\text{H$_{2}$BO$_{3}{}^{-}$} + \text{Na$^{+}$} = \text{NaH$_{2}$BO$_{3}$}
\end{equation}
| (15) |
Figure 11 shows the effect of hydrochloric acid concentration on the ionic strength. The ionic strength is 1.5 times of hydrochloric acid concentration at 110 min (before NaOH addition) and 1.0 times at 150 min (at pH of 10.5 after NaOH addition). This can be explained by changes in major dissolved species. The major dissolved species changes from HCl to MgCl2 from start of experiment to 110 min (before NaOH addition) as shown by eq. (16). After NaOH addition, the major dissolved species changes from MgCl2 to NaCl as shown by eq. (17).
| \begin{equation}
\text{HCl} + \frac{1}{2}\ \text{Mg} = \frac{1}{2}\ \text{MgCl$_{2}$} + \frac{1}{2}\ \text{H$_{2}$}
\end{equation}
| (16) |
| \begin{equation}
\frac{1}{2}\ \text{MgCl$_{2}$} + \text{NaOH} = \text{NaCl} + \frac{1}{2}\ \text{Mg(OH)$_{2}$}
\end{equation}
| (17) |
Figure 12 shows the calculated effect of hydrochloric acid concentration on the activity coefficient of H2BO3−. The activity coefficient was 0.88 when the HCl concentration was 0 mol L−1, and the activity coefficient decreased with increasing HCl concentration. When the HCl concentration was 0.99 mol L−1, the activity coefficient was 0.49 at 110 min (before NaOH addition), and 0.52 at 150 min (at pH of 10.5 after NaOH addition). The reason why the activity coefficient increases from 110 min to 150 min is that the ionic strength decreases as shown in Fig. 11.

The overall activity coefficient γ in eq. (9) is obtained by the product of f shown in Fig. 10 and γ shown in Fig. 12. Figure 13 shows the calculated effect of hydrochloric acid concentration on the total activity coefficient of H2BO3−. The total activity coefficient was 0.80 when the HCl concentration was 0 mol L−1, and the total activity coefficient decreased with increasing HCl concentration. When the HCl concentration was 0.99 mol L−1, the total activity coefficient was 0.043 at 110 min (before NaOH addition), which is 0.05 times of values without HCl addition. The total activity coefficient was 0.28 at 150 min (at pH of 10.5 after NaOH addition), which is 0.35 times of values without HCl addition. The stronger effect of the HCl concentration on the total activity coefficient at 110 min (before NaOH addition) comes from the stronger effect of the HCl concentration on the mole fractions f of H2BO3− as shown in Fig. 10(a).
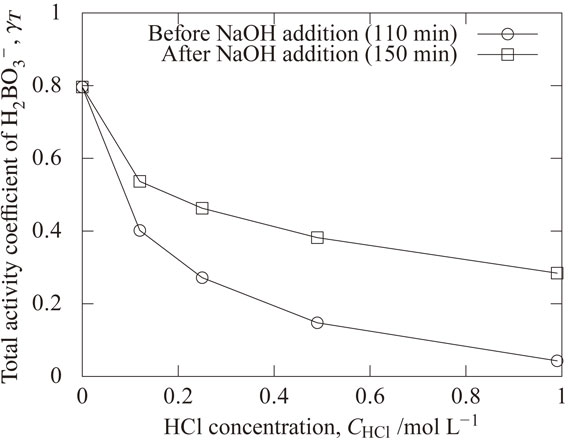
Figure 14 shows the measured and calculated effect of hydrochloric acid concentration on the boron concentration before and after the addition of sodium hydroxide solution. At 110 min (before NaOH addition), the concentration of boron was 7 × 10⁻³ mol L−1 irrespective of the concentration when HCl was added for the measurements. The concentration of boron was 9 × 10⁻³ mol L−1 irrespective of the concentration when HCl was added for the calculations and was higher than for the measurements.

At 150 min (after NaOH addition), the concentration of boron decreases with increase in the hydrochloric acid concentration for the measurements. The concentration of boron with the hydrochloric acid concentration above 0.49 mol L−1 was below 0.92 × 10⁻³ mol L−1 which is the effluent standard for boron. It was 0.4 × 10⁻³ mol L−1 with the hydrochloric acid concentration of 0.99 mol L−1. For the calculations, the concentration of boron decreases with increase in the hydrochloric acid concentration as in the experiment. The concentration of boron was 0.7 × 10⁻³ mol L−1 with the hydrochloric acid concentration of 0.99 mol L−1.
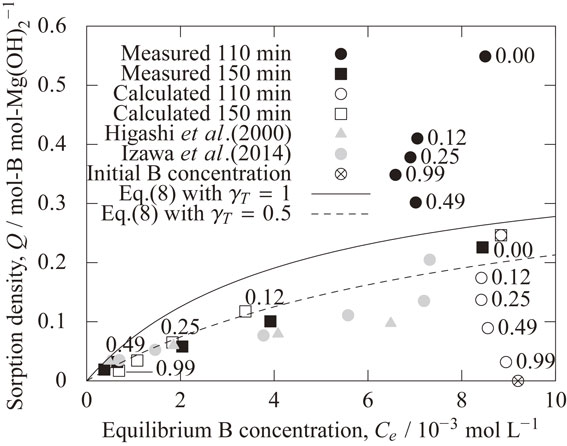
Figure 15 shows the effect of the boron concentration in solution on the sorption density of boron on the magnesium hydroxide. The values of Qs and K were determined so that the calculated results agreed with the literature and the experimental values of this study. For reference, the relationship between the sorption density and the boron concentration of the solution calculated by eq. (8) with γT = 1 is shown. The relationship is also shown using γT = 0.5 which is the order of the overall activity coefficient at 150 min as shown in Fig. 13. The figure also shows the literature value25,26) obtained by the coprecipitation method at pH 10.5. It was confirmed that the experimental values at 150 min (at pH of 10.5 after NaOH addition) were close to the literature value. On the other hand, the boron concentration of experiments at 110 min (before NaOH addition) was from 6.5 × 10⁻³ mol L−1 to 8.5 × 10⁻³ mol L−1, and the sorption density tended to be higher than the sorption isotherm calculated with γT = 0.5. The calculated data at 110 min (before NaOH addition) with HCl addition is to the right of the sorption isotherm. This is because the calculated value of the total activity coefficient γT at 110 min (before NaOH addition) is very low as shown in Fig. 13 since the mole fraction of MgH2BO3+ is very high with the addition of hydrochloric acid. In addition, the measured values of sorption density at 110 min (before NaOH addition) were significantly higher than those in the calculation. According to Izawa et al.,26) the sorption isotherm is BET-type in the coprecipitation method, and three-dimensional boron sorption occurs due to surface precipitation and multilayer adsorption with higher concentration of boron in the solution. In this experiment, three-dimensional B sorption may also occur when the boron concentration in the solution is high. However, it is possible that the error in the sorption density in this experiment at 110 min (before NaOH addition) is large since the sorption density in this experiment was obtained from the mass of the recovered product and the difference in boron concentration of the solution before and after the experiment. The mass of the recovered product was small as shown in Fig. 9(a), and the difference in boron concentration in the solution before and after the experiment was also small as shown in Fig. 14. Therefore, further investigation may be necessary to clarify the sorption behavior at 110 min. Under the condition at pH 10.5, the dissolved magnesium concentration was low and the sorption behavior was well reproduced by Langmuir type. Under such conditions, the values of K and Qs obtained in this study are useful information for setting conditions such as the amount of sorbent added and multi-stage treatment.
5. Conclusions
In order to understand the characteristics of the wastewater treatment method using zero-valent magnesium granules, the reaction between an aqueous solution containing boron and zero-valent magnesium granules was investigated by experiments and a reaction rate model, and the following findings were obtained.
-
(1)
The relationship between the pH and the dissolved magnesium concentration over time is determined by a reaction formula in which zero-valent magnesium granules react with an aqueous solution to generate Mg2+ ions while generating hydrogen.
-
(2)
When magnesium hydroxide is produced, the pH becomes constant over time. Increasing the concentration of hydrochloric acid lowers the pH value reached. This relationship is determined in equilibrium with magnesium hydroxide.
-
(3)
The reaction rate of the zero-valent magnesium granules is determined as the first-order reaction of the hydrogen ion activity when the pH was lower than 2.3 or higher than 8.5, and as the zero-order reaction of the hydrogen ion activity at pH from 2.3 to 8.5.
-
(4)
The amount of magnesium hydroxide produced without the addition of sodium hydroxide is determined by the above-described reaction rate model of zero-valent magnesium granules.
-
(5)
The boron concentration of the solution when the pH is adjusted to 10.5 by adding sodium hydroxide is determined by the Langmuir-type sorption isotherm of boron to the magnesium hydroxide produced.
Acknowledgments
This work was partially supported by JSPS KAKENHI Grant Number JP25420793.
REFERENCES
- 1) World Health Organization: Guidelines for Drinking-Water Quality: Fourth Edition Incorporating the First Addendum, (World Health Organization, Geneva, 2017).
- 2) J. Wolska and M. Bryjak: Desalination 310 (2013) 18–24.
- 3) B. Wang, X. Guo and P. Bai: Colloids Surf. A 444 (2014) 338–344.
- 4) Z. Guan, J. Lv, P. Bai and X. Guo: Desalination 383 (2016) 29–37.
- 5) Y. Taguchi, Y. Takahashi, T. Iwakura, T. Yamaguchi and S. Baba: J. Environ. Chem. 11 (2001) 557–565.
- 6) S. Kudo and M. Sakata: Bull. Chem. Soc. Jpn. 2 (2002) 265–268.
- 7) H. Ikatsu, M. Aramoto and T. Miyahara: Bulletin of School of Policy Management, (Kibi International University, 2006) pp. 13–20.
- 8) A. Iizuka, M. Takahashi, T. Nakamura and A. Yamasaki: Mater. Trans. 58 (2017) 1761–1767.
- 9) S. Moriyama, K. Sasaki and T. Hirajima: J. MMIJ 127 (2011) 708–713.
- 10) T. Kameda, J. Oba and T. Yoshioka: J. Hazard. Mater. 293 (2015) 54–63.
- 11) T. Kameda, J. Oba and T. Yoshioka: J. Environ. Manage. 165 (2016) 280–285.
- 12) T. Kameda, J. Oba and T. Yoshioka: J. Environ. Manage. 188 (2017) 58–63.
- 13) J.E. Schiller and S.E. Khalafalla: Min. Eng. 36 (1984) 171–173.
- 14) A. Bekin and I. Matsuoka: J. MMIJ 114 (1998) 553–559.
- 15) T. Yoshida, T. Igarashi, K. Asakura, H. Miyamae, N. Iyatomi and K. Hashimoto: J. MMIJ 120 (2004) 577–583.
- 16) G.C. Badulis, C. Tokoro and H. Sasaki: J. MMIJ 122 (2006) 406–414.
- 17) L. Semerjian and G. Ayoub: Adv. Environ. Res. 7 (2003) 389–403.
- 18) M. Kosmulski: J. Colloid Interface Sci. 253 (2002) 77–87.
- 19) O.S. Pokrovsky and J. Schott: Geochim. Cosmochim. Acta 68 (2004) 31–45.
- 20) M.M.F. Garca-Soto and E.M. Camacho: Separ. Purif. Tech. 48 (2006) 36–44.
- 21) K. Morimoto, T. Sato and T. Yoneda: J. Clay Sci. Soc. Jpn. 48 (2009) 9–17.
- 22) K. Sasaki, X. Qiu, S. Moriyama, C. Tokoro, K. Ideta and J. Miyawaki: Mater. Trans. 54 (2013) 1809–1817.
- 23) K. Sasaki and S. Moriyama: Ceram. Int. 40 (2014) 1651–1660.
- 24) T. Kameda, Y. Yamamoto, S. Kumagai and T. Yoshioka: J. Water Process Eng. 26 (2018) 237–241.
- 25) K. Higashi and K. Otsuka: Bulletin of Tokyo Metropolitan Industrial Technology Research Institute 3, (Tokyo Metropolitan Industrial Technology Research Institute, 2000) pp. 75–78.
- 26) S. Izawa, M. Maeda, C. Tokoro and K. Sasaki: J. MMIJ 130 (2014) 155–161.
- 27) F. Noguchi, K. Kakimoto, T. Tachibana, K. Kawata and N. Sakamoto: Toku Kai 2006-167564.
- 28) F. Noguci, M. Yamane, K. Kakimoto, N. Sakamoto, T. Tachibana and K. Kawata: CAMP-ISIJ 18 (2005) 286.
- 29) N. Sakamoto, K. Kawata, K. Kakimoto, H. Itou, T. Takasu and F. Noguchi: Proceedings of The 26th International Japan-Korea Seminar on Ceramics, (2009) pp. 241–244.
- 30) F. Noguchi, M. Yamane, N. Sakamoto, K. Kawata and K. Kakimoto: CAMP-ISIJ 20 (2007) 238.
- 31) N. Sakamoto, K. Kawata, K. Kakimoto, H. Itou, T. Takasu and F. Noguchi: CAMP-ISIJ 22 (2009) 305.
- 32) M. Kumar and S. Chakraborty: J. Hazard. Mater. 135 (2006) 112–121.
- 33) A. Siciliano, G.M. Curcio and C. Limonti: Water 11 (2019) 1276.
- 34) G. Lee, J. Park and O.R. Harvey: Water Res. 47 (2013) 1136–1146.
- 35) O. Ayyildiz, E. Acar and B. Ileri: Water Air Soil Pollution 227 (2016) 363.
- 36) G. Lee and J. Park: Geochim. Cosmochim. Acta 102 (2013) 162–174.
- 37) K. Mori, T. Sunaba and H. Koga: Research Report, (Fukuoka Industry, Science & Technology Foundation, 2012) p. 7.
- 38) D.L. Parkhurst and C.A.J. Appelo: Description of Input and Examples for PHREEQC Version 3— A Computer Program for Speciation, Batch-Reaction, One-Dimensional Transport, and Inverse Geochemical Calculations. Techniques and Methods 6— A43, (U.S Geological Survey, Denver, 2003).
- 39) I. Iitaka: Tetsu-to-Hagané 16 (1930) 438–447.
- 40) I. Iitaka: Tetsu-to-Hagané 16 (1930) 655–666.
- 41) I. Iitaka: Tetsu-to-Hagané 16 (1930) 1057–1063.
- 42) I. Iitaka: Tetsu-to-Hagané 16 (1930) 1184–1189.