Abstract
Amorphous (Sm0.8Zr0.2)1.1(Fe0.9Co0.1)11.3Ti0.7 samples prepared by the rapid-quenching method were annealed under various conditions (848–1223 K and 1–60 min) in a pure Ar atmosphere (PO2 < 10−2 Pa). The powders obtained at low annealing temperatures (<1073 K) were predominantly composed of the 1-9 phase (SmFe9), whereas those obtained at high annealing temperatures (>1123 K), were mostly composed of the 1-12 phase (ThMn12). However, the highest coercivity (Hc) of more than 400 kAm−1 (5 kOe) was observed for samples containing a mixture of the 1-9 and 1-12 phases, which were obtained by annealing at intermediate temperatures of 1123–1173 K for 10–30 min. Domain structure observations revealed that the sample with the highest Hc (magnetic anisotropy field (Ha) of approximately 6 MAm−1) was composed of single-domain particles. Moreover, Hc was decreased to approximately 160 kAm−1 (2 kOe) by the formation of a domain structure (approximately 500 nm in width) in samples of the 1-12 mono-phase, despite high Ha of approximately 9 MAm−1. A mechanism for these coercivity variations is proposed.

1. Introduction
Magnetic materials with a ThMn12 (1-12) structure have been studied since the 1990s.1,2) In the previous studies cited in the summary reports,1,2) almost all reported materials were RFe12−xMx (R = Nd cases, –Ny) composition, here R = rare earth elements, M = third metal elements for the stability of ThMn12 structure, and the contents were x ≥ 1.0. Typical third elements for phase stability were M = Ti, Mo, and W, and their contents were 1.0 < x < 2.0 in many cases, but it was impossible to stabilize the structure in the cases of x < 1.0. There are a few reports that attempted the preparation of x < 1.0 compounds.3,4),1)* In R = Nd materials, N contents were y = 1.0∼2.0 for appearance of sufficient magnetic anisotropy, that was predicted from a ThMn12 crystal structure of the prepared materials.
Therefore, there was no report about successful preparation of x < 1.0 compounds which is expected to show high saturation polarization (Js) and high magnetic properties as well known Nd2Fe14B magnets. Moreover, there was a few report indicating reliable coercivity and maximum energy product of this ThMn12-type magnet. One of the reasons of the little information about the magnetic properties of this type of magnets comes from that the almost all prepared magnet samples were magnetic isotropic powders.1,2) We made the following studies for the preparation of x < 1.0 compounds of this type magnet having high Js and magnetic anisotropy field (Ha), and high Curie temperature (Tc).
We previously reported the preparation of (R,Zr)(Fe,Co)12−xTixNy compounds (x < 1.0, R = Nd, y = 1.0–1.5, and R = Sm, y = 0), which have magnetic properties superior to those of the well-known Nd2Fe14B phase, especially in the high-temperature region.5–7) The additives Zr and Co play a key role in stabilizing the 1-12 structure even for compounds with x < 1.0.5,6) There is also the possibility of preparing high-density magnets using R = Sm compounds, because these compounds are stable up to sintering temperatures of approximately 1373 K.8,9)
Recently, we synthesized R = Sm or Nd above compounds with x = 0.7 that were almost free of the α-(Fe,Co) phase and exhibited promising magnetic properties at room temperature (RT), including saturation magnetic polarization (Js) values of 1.55 (Sm) and 1.74 T (Nd–N1.5) and magnetic anisotropy field (Ha) values of 8.6 (Sm) and 9.3 (Nd–N1.5) MAm−1, respectively. The Curie temperatures (Tc) of these compounds exceeded 950 K.10)
Although the fundamental magnetic properties, such as Js, Ha, and Tc, of the newly prepared 1-12 magnetic compounds are satisfactory, but improved coercivity (Hc) is required for the preparation of magnets based on these compounds.
In unpublished preliminary experiments, we attempted to perform sintering of powders of the above compounds in the presence of several additives, such as Sm–Cu alloys and SmCo5 magnetic powder. However, we were unable to achieve high-density sintered magnets.
We also examined the preparation of fine particles of these compounds via ball milling and obtained pulverized powders with Hc values of 100 kAm−1 (R = Sm, –Ti0.7), 140 kAm−1 (R = Nd, –Ti0.7N1.5), and 210 kAm−1 (R = Nd, –Mo1.0N1.3).11) However, the pulverized samples exhibited clearly diminished Js, Ha, and, consequently, low Hc values owing to oxidation and mechanical damage during pulverization.11)
In this study, we therefore aimed to prepare high-coercivity powders starting from amorphous powders synthesized by the rapid-quenching (RQ) method followed by heat treatment under a pure Ar atmosphere. This method is a promising approach for the preparation of high-coercivity samples owing to sample crystallization during heat treatment to afford an improved microstructure and less oxidation due to annealing in a pure Ar atmosphere. This technique is expected to result in a well-crystallized 1-12 phase with an optimum grain size and microstructure.
2. Experiments and Results
2.1 Preparation of starting alloy
(Sm0.8Zr0.2)1.1(Fe0.9Co0.1)11.3Ti0.7 was prepared by the RQ method. The composition of this compound was selected based on previous experiments aimed at optimizing magnetic properties, such as Js, Ha, and Tc. Based on a compound with a similar composition prepared using the strip-casting method, the following magnetic properties were expected: Js of 1.5 T, Ha of 7.0 MAm−1, and Tc exceeding 900 K.10,11) The composition of the starting sample was tuned to be slightly rich in Sm owing to the expected evaporation of Sm during heat treatment.
The quenching rate in the RQ method, which is controlled by the rotation rate of the cooling roller, was set to 40 ms−1, and the sample was produced by Santoku Co., Ltd., Japan. The prepared ribbons show approximately 1.3 mm wide and 10 µm thick.
2.2 Heat-treatment conditions
The specimens were subjected to heat treatment using an infrared gold image furnace (MILA-5000, ULVAC-RIKO) to minimize the heating and cooling times. The heating rate to the treatment temperature was approximately 100 K min−1 and the cooling time from the final temperature of 848–1223 K to RT was approximately 20–45 min. During the heat treatment, the furnace was initially evacuated to 10−5 Pa and a pure Ar was subsequently introduced.
Figure 1 presents a thermogravimetry/differential thermal analysis (TG-DTA) curve for the starting amorphous compound as obtained using a TG-DTA 2020s/MS system (Netzsch). An exothermic peak was observed at approximately 860 K, which is considered to correspond to crystallization of the amorphous compound. Therefore, the heat treatment was performed at temperatures of 848–1223 K for 1–60 min.
2.3 Effect of heat-treatment temperature on crystal structure
All the samples were lightly pulverized to a particle diameter of less than 32 µm (sieving). Figure 2 shows X-ray diffraction (XRD; Cu-Kα, Rigaku SmartLab) patterns of the starting amorphous alloy with a composition of (Sm0.8Zr0.2)1.1(Fe0.9Co0.1)11.3Ti0.7 and several samples subjected to heat treatment at various temperatures (1023–1223 K) for 30 min. The XRD line patterns for SmFe11Ti (ICDD No. 03-065-5363) and SmFe9 (ICDD No. 00-043-1311) are also shown at the bottom of the figure with the diffraction peaks displayed as vertical lines.
The XRD patterns were used to identify the 1-12 and 1-9 phases. We refer to the phase displaying an XRD pattern similar to that of the SmFe11Ti standard shown in Fig. 2 as the 1-12 phase, neglecting the slight differences in the lattice constants (i.e., the slight differences in the diffraction angles of the XRD peaks). Analogously, we refer to the phase exhibiting an XRD pattern similar to that of the SmFe9 standard shown in Fig. 2 as the 1-9 phase.
The amorphous starting material exhibited no obvious XRD peaks. The sample subjected to heat treatment at 1023 K for 30 min displayed XRD peaks corresponding to the 1-9 phase. Upon heat treatment at 1123 K for 30 min, clear peaks corresponding to the 1-12 phase appeared in the XRD pattern, indicating that this sample was composed of a mixture of the 1-9 and 1-12 phases. In the samples treated at higher temperatures of 1173 and 1223 K for 30 min, only the 1-12 phase was detected by XRD. We classified these samples as being mainly composed of the 1-9 phase (<1073 K), a mixture of the 1-9 and 1-12 phases (1073–1123 K), and the 1-12 phase (>1123 K with comparatively long heating times, or heated at higher temperatures). This classification scheme was used for all of the samples in this study, which were treated at 848–1223 K for 1–60 min, as will be discussed in the following sections.
2.4 Magnetic properties
The treated samples were lightly pulverized, mixed with epoxy resin, and allowed to solidify into 6 mm (φ) × 4.5 mm (L) cylindrical samples. The magnetic properties were then measured by vibrating-sample magnetometry (5T-VSM, TOEI; 9T-PPMS-VSM, EverCool, Quantum Design Inc., USA; and 15T-VSM, HFLSM, IMR, Tohoku University). High magnetic fields exceeding 7.2 MAm−1 are necessary for determining Js and Ha using the law of approach to ferromagnetic saturation (LAFS) method.10,12) However, a field of 4 MAm−1 is sufficient for measuring Hc of the samples used in this study.
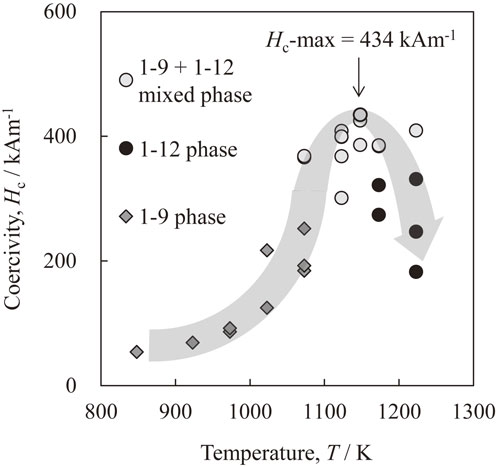
Figure 3 presents a typical demagnetization curve for measurement of the coercivity of the sample subjected to heat treatment at 1148 K for 10 min. A maximum coercivity of 434 kAm−1 (5.46 kOe) was determined for this sample.
2.4.1 Js and Ha values
The Js and Ha values of the samples subjected to heat treatment under various conditions (848–1223 K, 1–60 min) were examined using the LAFS method and the results are summarized in Fig. 4.13) The samples were classified into three groups as described in the previous section.
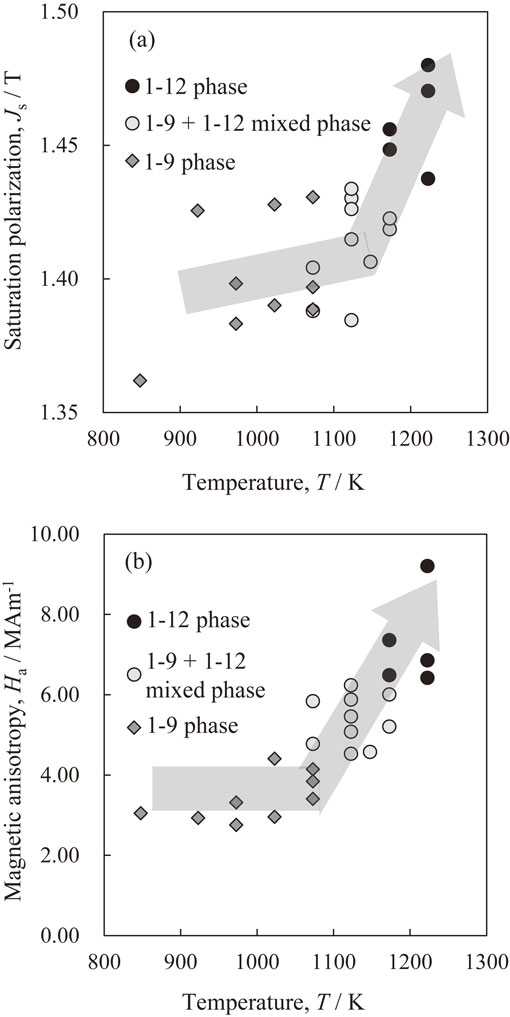
As shown in Fig. 4(a), samples heated for a longer duration at the same temperature displayed higher Js values. For example, the sample heated at 1123 K for 1 min showed a Js value of approximately 1.38 T, whereas the sample heated at the same temperature for 60 min displayed a Js value of approximately 1.46 T. Furthermore, all the samples heated at temperatures of 1023 K or lower were composed of the 1-9 phase irrespective of the heating duration. The XRD patterns of the samples heated at 1023–1173 K indicated a mixture of the 1-9 and 1-12 phases, although the results were also dependent on the heating duration. In contrast, the XRD patterns of the samples heated at 1173 K for 30 and 60 min and all of the samples heated at 1223 K indicated that these samples were composed of the 1-12 phase. The results clearly demonstrate that the samples composed of the 1-12 phase exhibited higher Js values than those composed of the 1-9 phase or a mixture of the 1-9 and 1-12 phases.
Furthermore, as shown in Fig. 4(b), the Ha values of the samples also clearly increased with the emergence of the 1-12 phase. The samples composed of a mixture of the 1-9 and 1-12 phases obtained via heat treatment at 1023–1173 K displayed clearly higher Ha values compared with those composed of only the 1-9 phase. The samples composed of the 1-12 phase with high Js values also exhibited high Ha values. The emergence of the 1-12 phase had a clear effect of increasing the Ha values, in contrast to the effect on Js.
2.4.2 Effect of heat-treatment temperature on observed Hc values
The coercivity of the samples was measured from demagnetization curves, such as the representative example shown in Fig. 3. Interestingly, the highest Hc values were observed for the samples composed of the mixed 1-9 and 1-12 phases. As shown in Fig. 5, the Hc value abruptly increased for these samples subjected to heat treatment at 1073–1173 K.13) In this study, the maximum value of Hc of 434 kAm−1 (5.46 kOe) was observed for the sample treated at 1148 K for 10 min. Conversely, the samples composed solely of the 1-12 phase displayed lower Hc values, despite their high Ha values.
It should be noted that, for the samples heated at temperatures of up to 1123 K, a longer heating duration of 30 or 60 min led to higher Hc values. In contrast, when the heating temperature was 1148, 1173, or 1223 K, a shorter heating duration of 1 or 10 min afforded higher Hc values.
In addition, the isotropic powder sample exhibiting the best coercivity (434 kAm−1) was also found to display a remanence of 0.67 T.
2.4.3 Temperature dependence of Hc for the high-coercivity sample
The temperature dependence of Hc for one of high-coercivity sample (= 408 kAm−1 at RT) was measured using a 9T-PPMS system and the results are presented in Fig. 6. For a Dy-free Nd2Fe14B magnet with a Hc of 736 kAm−1 (9.2 kOe) at RT, the reduction rate of Hc from RT to 473 K was measured to be approximately 0.43%K−1 under our measurement conditions, whereas the reduction rate for the sample displaying the high Hc synthesized in this study was only 0.34%K−1.
The residual Hc at 473 K was approximately 160 kAm−1 for both Nd2Fe14B and our 1-12 powder sample. Therefore, the temperature dependence of Hc was clearly smaller for the 1-12 compound than for the Nd2Fe14B magnet.
2.5 Microstructures and domain structures of heat-treated samples
The microstructures and domain structures of the heat-treated samples were examined using atomic force microscopy (AFM) and magnetic force microscopy (MFM) using a scanning probe microscope (E-sweep, Hitachi High-Tech Science Co., Ltd., Japan), and using also scanning electron microscopy (SEM, JSM-IT100 JEOL, Ltd., Japan). It was very difficult, however, to observe clearly the microstructure of the samples, for instance the observed grain sizes were notably different in as-prepared particles and in etched particles. For an example in 1223 K/30 min treated sample (sample (C)), the grain sizes in the former particles were estimated to be 200 nm using SEM, but it was finer as about 50 nm in the latter particles using AFM.
More careful preparation of samples and accurate observation technique should be necessary for the determination of grain sizes in the samples (as TEM). Therefore, in this paper, we only discuss about MFM observations. The powder samples were embedded in resin and polished using a conventional grinding wheel and abrasives. The domain structures of the sample particles were examined using MFM.
Figure 7 presents MFM images of the samples subjected to heat treatment at 1023 K (A), 1123 K (B), and 1223 K (C) for 30 minutes. The Hc values of the samples subjected to heat treatment at 1023 K (A), 1123 K (B), and 1223 K (C) for 30 min were approximately 216, 408, and 184 kAm−1, respectively.
As estimated from the shape of the XRD peaks, the crystallinity should increase with increasing treatment temperature. For the samples treated at 1023 K (A), 1123 K (B), and 1223 K (C), the observed phases were the 1-9 phase (A), a mixture of the 1-9 and 1-12 phases (B), and the 1-12 phase (C), respectively, as shown in Fig. 2.
From the MFM images, the domain structures of the three samples could be distinguished into two types, as shown in Fig. 7. Samples A and B generally appeared to be composed of fine magnetically isolated particles (i.e., single-domain particles), whereas sample (C) contained domains of approximately 500 nm in width, that spread over many primary particles. It can be concluded that this domain structure formation observed in sample (C) led to the reduced Hc value.
It is in good agreement with our experience of Nd2Fe14B sintered magnets that the presence of a large volume fraction of single-domain grains in the thermally demagnetized state should result in high coercivity.14) Conversely, the presence of a considerable volume fraction of multi-domain grains, domain structures spread over many primary grains, should lead to a lower Hc owing to the facile motion of the domain walls during the demagnetization process.14)
3. Discussion
In this study, we successfully prepared a sample exhibiting the comparatively high Hc of approximately 434 kAm−1 by the annealing of a rapidly quenched amorphous sample of (Sm0.8Zr0.2)1.1(Fe0.9Co0.1)11.3Ti0.7.
Upon heat treatment of this sample, crystallization began to occur at approximately 860 K, as shown in Fig. 1. The 1-9 phase initially appeared at the comparatively low annealing temperature of less than 1023 K, and XRD peaks corresponding to the 1-12 phase gradually emerged in the samples annealed at temperatures of 1073 K or above. The maximum Hc (434 kAm−1) value observed in this study was that for the sample subjected to heat treatment at 1148 K for 10 min, which was composed of a mixture of the 1-9 and 1-12 phases.
As shown in Fig. 4, the Ha value (= 2K1/Ms, where Ms is the saturation magnetization) of the 1-9 phase was approximately 3 MAm−1, whereas that of the 1-12 phase was greater than 8 MAm−1. If we estimate Hc using the equation,
| \begin{equation}
H_{c} \propto H_{a}
\end{equation}
| (1) |
the samples composed of the 1-12 phase would be expected to exhibit comparatively large
Hc values. The maximum
Hc value observed in this study, however, was that for a sample composed of a mixture of the 1-9 and 1-12 phases as shown in
Figs. 4 and
5, and the
Ha value of this sample was approximately 6 MAm
−1, which was not the highest value observed in this study.
The above discussion can be considered in terms of the case where Hc is described by the Kronmüller equation as follows:
| \begin{equation}
H_{c} = \alpha H_{a} - N_{\textit{eff}}M_{s}
\end{equation}
| (2) |
where α and
Neff are constants representing microstructural parameters related to the magnetic anisotropy and local demagnetizing field.
15,16) In this case,
Hc also increases with increasing
Ha, although the demagnetizing field may influence it to a certain extent.
Figure 8(a) depicts the relationship between Ha and Hc alongside the apparent phases identified using XRD. The Hc does not appear in the samples with Ha values of approximately 3 MAm−1. Upon a slight increase in Ha to approximately 4 MAm−1, Hc increased to about 320 kAm−1. In the samples with Ha values of 4.5–6.3 MAm−1 composed of a mixture of the 1-9 and 1-12 phases, Hc reached a maximum value of approximately 400 kAm−1.
In contrast, for the samples composed of the 1-12 phase, which displayed Ha values of 6.5–9 MAm−1, Hc decreased with increasing Ha. These results are clearly inconsistent with the above discussion regarding the relationship between Ha and Hc.
Consequently, we present an alternative analysis of the same results in Fig. 8(b). This analysis is based on the domain structure observations using MFM shown in Fig. 7. It is apparent from the MFM images that the samples displaying large Hc values in this study, namely, those with Ha values of less than 6.5 MAm−1, were composed of agglomerated single-domain particles. For example, the domain structure observed in sample (C) with a high Ha of greater than 6.5 MAm−1 was not observed in samples (A) and (B). The domain structure in sample (C) should be spread over many primary particles, because the average domain width appeared to be approximately 500 nm as indicated by the MFM image shown in Fig. 7. This domain structure formation in the sample composed of a large number of primary fine grains, therefore, exerted a detrimental effect on Hc.
It is considered that the mixed 1-9 and 1-12 phases in sample (B) behave as single-domain particles. On the other hand, the domain is spread over on a large number of fine particles composed of the 1-12 phase in sample (C). In the former case, the anisotropy field of the mixed phase particles should be intermediate between those of the 1-9 and 1-12 phases, although they behaved as single-domain particles. Meanwhile, for the fine particles composed of the 1-12 phase, which as a higher Ha value, a domain structure emerged and Hc decreased owing to the facile domain wall motion.
A more precise explanation of the mechanism through which the comparatively large Hc of the samples in this study emerges will require more comprehensive data, which is a goal for future research.
4. Conclusion
A maximum coercivity of Hc = 434 kAm−1 was achieved via heat treatment of amorphous (Sm0.8Zr0.2)1.1(Fe0.9Co0.1)11.3Ti0.7 at 1148 K for 10 min. This sample was composed of a mixture of the 1-9 and 1-12 phases, which agglomerated into apparently single-domain particles and exhibited Ha of approximately 6 MAm−1. Lower annealing temperatures (≤1023 K) afforded samples with the 1-9 phase that exhibited Ha values of less than 4 MAm−1 and Hc values of less than 240 kAm−1. Samples subjected to higher annealing temperatures (≥1173 K) were composed of the 1-12 structure and displayed Ha values of 6–9 MAm−1, although their Hc values were less than 320 kAm−1. However, these high Ha samples exhibited a clear domain structure with a width of approximately 500 nm that was spread over numerous primary particles. In conclusion, the samples having intermediate Ha values but composed of agglomerated single-domain particles showed the highest Hc values in this study.
Acknowledgments
This paper is based on results obtained from the future pioneering program “Developments of magnetic materials technology for high efficiency motors” commissioned by the New Energy and Industrial Technology Development Organization (NEDO).
REFERENCES
- 1) H.S. Li and J.M.D. Coey: Handbook of Magnetic Materials, vol. 6, ed. by K.H.J. Buschow, (North Holland, Amsterdam, 1991) Chap. 1, pp. 1–83 (especially Fig. 3.5 in p-17; 1)*).
- 2) H. Fujii and H. Sun: Handbook of Magnetic Materials, vol. 9, ed. by K.H.J. Buschow, (North Holland, Amsterdam, 1991) Chap. 3, pp. 303–404.
- 3) S. Sugimoto, A. Kashima, M. Okada and M. Homma: Mater. Trans. JIM 32 (1991) 1180–1183.
- 4) W.-W. Ho and Z.-Q. Huang: Proc. 10th Int. Workshop on R.E. Magnets (1), (1982) p. 23.
- 5) S. Suzuki, T. Kuno, K. Urushibata, K. Kobayashi, N. Sakuma, K. Washio, H. Kishimoto, A. Kato and A. Manabe: AIP Adv. 4 (2014) 117131.
- 6) S. Suzuki, T. Kuno, K. Urushibata, K. Kobayashi, N. Sakuma, K. Washio, H. Kishimoto, A. Kato and A. Manabe: J. Magn. Magn. Mater. 401 (2016) 259–268.
- 7) N. Sakuma, S. Suzuki, T. Kuno, K. Urushibata, K. Kobayashi, M. Yano, A. Kato and A. Manabe: AIP Adv. 6 (2016) 056023.
- 8) K. Kobayashi, D. Furusawa, S. Suzuki, T. Kuno, K. Urushibata, N. Sakuma, M. Yano, T. Shoji, A. Kato, A. Manabe and S. Sugimoto: Mater. Trans. 59 (2018) 1845–1853.
- 9) S. Hiraguchi, T. Furusawa, S. Suzuki and K. Kobayashi: J. Magn. Magn. Mater. (to be accepted).
- 10) T. Kuno, S. Suzuki, K. Urushibata, K. Kobayashi and S. Sugimoto: J. Magn. Magn. Mater. 498 (2020) 166114.
- 11) T. Kuno, K. Urushibata, S. Suzuki, K. Kobayashi and S. Sugimoto: Mater. Trans. 60 (2019) 1697–1706.
- 12) T. Kuno, S. Suzuki, K. Urushibata, K. Kobayashi, N. Sakuma, K. Yokota, M. Yano, A. Kato and A. Manabe: J. Jpn. Soc. Powder Powder Metallugy 63 (2016) 1053–1059.
- 13) K. Kobayashi, T. Kuno, K. Urushibata, S. Suzuki and T. Yamamoto: Proc. of Technical Meeting “Magnetics”, IEE Japan, MAG-19-211, (2019) pp. 11–16.
- 14) K. Kobayashi, K. Urushibata, Y. Une and M. Sagawa: J. Appl. Phys. 113 (2013) 163910.
- 15) H. Kronmüller: MRS Int’l Mtg. On Adv. Mats. 11 (1989) 3.
- 16) S. Sugimoto and H. Kato: Eikyujishaku, ed. by M. Sagawa, M. Hamano and M. Hirabayashi, (AGNE Gijutsu Center Co., Ltd., Tokyo, 2007) pp. 106–121 (in Japanese).