Abstract
The effect of Fe on the corrosion behavior of Ni20Cr–xFe alloys in an oxidizing chlorine-containing atmosphere using air mixed with the salt vapor mixture of NaCl–KCl–CaCl2 at 570°C was investigated. The results revealed that the corrosion performance of the Ni–20Cr alloys in the oxidizing-chlorine atmosphere was improved by Fe addition. The oxide scale structure formed on all of the alloys containing Fe was similar with that formed on the Fe-free alloy. The potassium chromate and the internal precipitate zone were observed on all of the alloys. However, the internal Cr-chloride penetration and the Cr-depletion zone became thinner on the alloys with Fe addition. The Fe-oxide formed above Cr2O3 scale on the alloys with Fe addition helped Fe inhibit the chromate formation and maintained low chlorine potential at the alloy surface. Thus, a protective Cr2O3 scale can be maintained for a longer corrosion period.
1. Introduction
High-temperature alloys and coatings are significantly damaged in an oxygen–chlorine containing atmosphere at elevated temperatures. This type of corrosion is often referred to as “active oxidation” and is caused by the circulation of chlorine across a less protective oxide scale due to the formation of chloride vapor at the scale/alloy interface and the oxidation of chloride vapor at the scale surface.1,2) It was also reported that the corrosion became more accelerated when the chlorine was supplied by alkali chlorides, since the alkali ions induced the breakdown the protective oxide scale and acted as a catalyst in the corrosion process.3–6)
Ni-based alloys and coatings are widely used in the waste-to-energy industry due to their good mechanical properties and high temperature corrosion resistance. Ni-based alloys and coatings often contain Fe as an alloying element, and numerous studies have reported the effect of Fe on corrosion behavior in atmospheres containing oxygen and chlorine.5,7–12) In these literatures, there were mainly two different conditions were used: oxidizing atmospheres with 1–2% Cl2 and oxidizing atmospheres with deposits of alkali metal chlorides (e.g. KCl).
In the oxidizing atmospheres containing 1–2% Cl2, the corrosion performance of Ni–Cr based alloys with/without Fe and austenitic Fe–Ni–Cr alloys (Cr ≥ 20 mass%) improved with the addition of Fe up to about 9 mass%, however, further Fe addition more than 20 mass% decreased the corrosion resistance. All alloys which contains Fe formed an outer porous iron oxide scale and an inner chromia. The outer porous Fe oxide scale was explained to form due to evaporation of FeCl2 and its oxidation, and allowed chlorine to penetrate into the alloy surface, resulting in the formation of volatile metal chlorides. The alloys which have higher Fe content formed more iron chlorides below the Cr2O3 scale, which resulted in higher Fe consumption. Thus, the addition of higher Fe content was contributed to cause the alloys became less corrosion resistance.7,9,10) With the presence of alkali metal chlorides deposits (e.g. KCl) in the oxidizing atmospheres at 600°C, the addition of 4–7 mass% Fe to the Ni–20–27 mass% Cr based alloys was also reported to improve the corrosion resistance, however, austenitic Fe based alloys showed the poor corrosion performance.11,12)
Above studies have suggested that small Fe addition is beneficial but higher Fe content is detrimental for the corrosion resistance of Ni–Cr-based alloys in chlorine-and/or-chloride containing atmospheres, although, the mechanism underlying this behavior is not clearly understood.
Our previous study on the corrosion of Ni–Cr-based alloys in air containing KCl–NaCl–CaCl2 salt-vapor revealed that the formation of chromates by the reaction between the salt-vapor and Cr2O3 scale accelerated the corrosion as a result of concomitant generation of chlorine.13) Therefore, a formation of an oxide scale such as NiO and Fe2O3 that is less reactive with alkali chlorides above a protective Cr2O3 scale is expected to increase the corrosion resistance by reducing the Cl2 potential. Indeed, we found in our previous study that Mo addition to Ni–Cr-based alloys promoted a NiO formation, which improved the corrosion resistance.13)
In this study, the corrosion behavior of Ni20Cr–xFe alloys in atmospheres containing air and salt-vapor at 570°C was studied to elucidate the effect of Fe addition on the corrosion behavior of NiCr-based alloys in salt-vapor-containing atmosphere. Fe additions of 4 and 30 mass% were chosen to represent the effect of low and high Fe contents on corrosion behavior based on above previous studies.
2. Experimental Procedure
2.1 Samples preparation
In this study, Ni20Cr–xFe alloys with various Fe contents (x = 0, 4 and 30 mass%) were prepared from high-purity metals (ca. 99.99%) via Ar arc-melting. All alloys used in this study were fully γ structure. The alloy ingots were homogenized under vacuum at 1200°C for 48 h. Samples with a thickness of approximately 1 mm were then cut from the homogenized ingots, mechanically grounded using SiC papers, and finished by polishing with 3 µm diamond paste. Prior to the corrosion tests, the samples were ultrasonically cleaned for 15 min.
2.2 Corrosion tests
The corrosion tests were conducted at 570°C for up to 100 h in an atmosphere containing air and salt-vapor mixture using a furnace with two heat zones, as shown in Fig. 1. The detailed experimental setup was described in our previous study.13) To obtain the salt-vapor, an alkali-salt mixture with a molar composition of 40% NaCl, 40% KCl, and 20% CaCl2 (Tm.p. = 565°C) was placed in the first heat zone, which was heated to 600°C. The salt vapor was carried to the samples in the second heat zone, which was heated to 570°C, by passing air through the furnace at a linear velocity of 0.33 cm/sec. The corrosion mass change was measured at room temperature after the specified corrosion time (25, 50 or 100 h). A fresh salt mixture was used for each corrosion cycle.

To evaluate the corrosion behavior in the chlorine-containing atmosphere, the samples were subjected to a chemical treatment procedure to remove the corrosion products as described in elsewhere.13) The corrosion mass gain (ΔWg) was determined by dividing the change in mass of specimens before (W1) to after (W2) the corrosion test by total area of the sample surface. The ΔWg contains the mass gain by formation of reaction products and the mass loss of metal chlorides due to the evaporation $(W_{\text{M}}^{\text{in MCl2(g)}})$. Then, the measured mass after the chemical descaling treatment (W3) was used to determine the total mass loss (ΔW1) due to corrosion by calculating the change in mass between W1 and W3 and dividing the change in mass by the total area of sample surface. The ΔW1 exhibited the total mass loss due to corrosion and evaporation per unit area of the sample surface. The different value of W3 and W2 determined the mass amount in the external corrosion scale which consisted of mass of solid oxides and solid metal chlorides. By assuming that the solid metal chlorides underwent complete oxidation, thus can be neglected. Then, mass of formed oxide per unit area of sample surface $(W_{\text{M}}^{\text{in oxide}})$ can be obtained by using the change in mass between W3 and W2 and dividing the change in mass by the total area of sample surface, thus the $W_{\text{M}}^{\text{in MCl2(g)}}$ can be evaluated by following equation by using the total area of sample surface, A.
| \begin{equation}
W_{\text{M}}^{\text{in MCl2(g)}} = (W_{1} - W_{3})/A - W_{\text{M}}^{\text{in oxide}}
\end{equation}
| (1) |
In order to avoid the loss of metal chlorides that would occur during sample preparation using water, focused ion beam milling (JEOL JIB-4601F) was used to prepare cross-sections of all samples. Prior to milling, C or W was deposited on the sample surface. The cross-sections obtained after the corrosion tests were examined using field-emission scanning electron microscopy and the distribution of each element was analyzed by energy-dispersive X-ray spectroscopy (FESEM-EDS; JEOL, JSM-7001FA). Phase analysis of the corrosion products were performed by X-ray diffraction (XRD; Rigaku SmartLab) in the Bragg-Brentano geometry using Cu Kα1 radiation (λ = 0.15405 nm) in the range of 20–90° with a step size of 0.02 and 4 s per step. The QualX2 software14) with the POW_COD database was used to identify the structural phases from XRD patterns.
3. Results
3.1 Corrosion kinetics
Figure 2(a) shows the corrosion mass gain kinetics of the alloys. The kinetics displayed parabolic-like behavior. The corrosion mass gain (ΔWg) of the Fe containing alloys was considerably lower than that of the Fe-free alloy, indicating that Fe addition improved the corrosion resistance of the Ni20Cr alloy. The maximum benefit was observed for 4 mass% of Fe addition, and further increasing Fe contents to 30 mass% decreased the corrosion resistance. Figure 2(b) shows the profile of total mass loss (ΔW1) after the corrosion test. The mass loss profiles exhibited a trend similar to that of the mass gain profiles. The Fe-free alloy displayed the greatest mass loss, which tended to decrease linearly over time, whereas the alloy with 4 mass% Fe exhibited the lowest mass loss. The mass loss kinetics of Fe-containing alloys exhibited parabolic behavior.
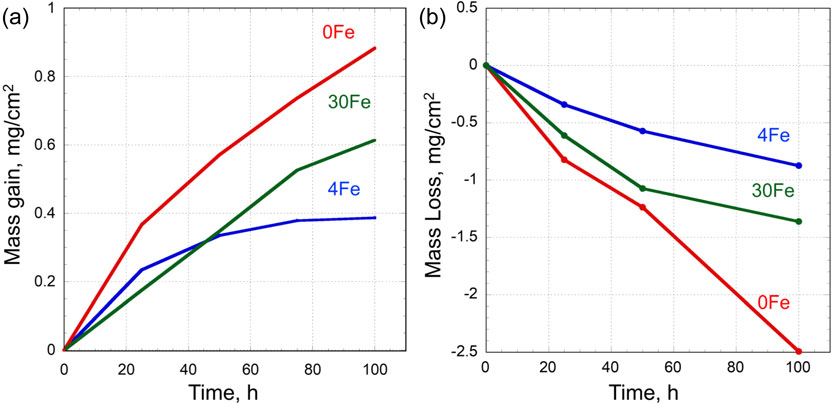
Figure 3 shows the calculated metal loss due to evaporation of metal chlorides $(W_{\text{M}}^{\text{in MCl2(g)}})$, which increased exponentially with increasing corrosion time for all three alloys. Among the three alloys, the highest amount of metal chloride evaporation was observed for the Fe-free alloy from the start of the corrosion test. The mass of evaporation of the metal chlorides decreased with increasing Fe contents. Although, the order of $W_{\text{M}}^{\text{in MCl2(g)}}$ is much smaller than that of ΔW1 and ΔWg, the evaporation of the chlorides does not strongly affect the corrosion kinetics, higher evaporation of metal chlorides may be one of the reasons for the linear mass loss kinetics observed for the Fe-free alloy. The plots shown in Figs. 2 and 3 suggested that Fe addition was beneficial for reducing the evaporation of metal chlorides.
3.2 Surface morphologies of corroded samples
Figures 4–6 show the surface morphologies and elemental distribution maps of the corroded samples after a corrosion test for 100 h. The surfaces of all samples were covered by oxide scale, and dendritic-structured products were confirmed on the surface of oxide scale. The size and distribution of these dendritic-structured products were independent of the Fe content of the alloy. Based on EDS mapping images, the dendritic products were predominantly composed of NaCl (Figs. 5 and 6). The oxide scale could be divided into two areas with bright or dark contrast. The EDS mapping images in Figs. 5 and 6 revealed that the dark-contrast area was predominantly composed of K, Cr and O, whereas the bright-contrast area mainly contained Fe, Cr, and O. These results suggest that dark- and bright-contrast areas were potassium chromate and iron–chromium spinel, respectively. The dark-contrast area tended to decrease with increasing Fe contents in the alloy, which indicates that Fe addition reduced potassium chromate formation. The chromate formation has been confirmed by the XRD profile (Fig. 7) through identification some peaks with chromate phases, e.g. K2CrO4, K2Cr2O7, and Na2CrO4.

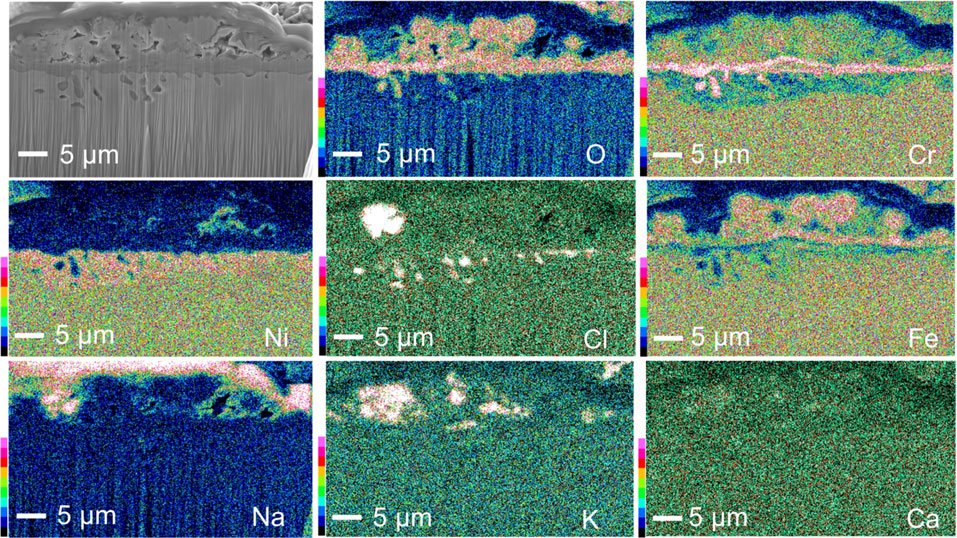
Cross-sections of the samples after corrosion test for 25, 50 and 100 h are shown in Fig. 8. All of the alloys exhibited a similar oxide scale structure, including an internal precipitation zone beneath the oxide scale. The oxide scales of the Fe-containing alloys were thinner than those of the Fe-free alloy, and their thickness decreased with increasing Fe contents until at least 50 h of corrosion. However, the oxide scale formed on 30 mass% Fe alloy was thicker than that formed on the 4 mass% Fe alloy after 100 h of corrosion. As shown in Figs. 9–11, EDS mapping revealed that a Ni-rich Cr-containing oxide scale was formed on the Fe-free alloy13) and a Ni–Cr–Fe containing oxide scale was formed on the 4 mass% Fe alloy, whereas, an Fe rich-Cr containing oxide was formed on the 30 mass% Fe alloy. Fe addition suppressed the amount of Ni-containing within the oxide scale. Beneath these complex oxide scales, a Cr-rich oxide layer developed in all of the alloys. The Cr-rich oxide layer formed on the Fe-free alloy appeared discontinuous, whereas this layer was continuous for the alloys with higher Fe content. As expected from the surface analysis (Figs. 5 and 6) and the XRD profile (Fig. 7), the presence of potassium chromate was confirmed above the outer oxide layer formed on all of the alloys. The internal precipitation zone beneath the oxide scale on all of the alloys consisted of two parts, outer subsurface Cr-oxide penetration and inner internal Cr-chloride precipitates. A Cr-depletion zone was well developed in the alloys. Although, no Cl signal was detected beneath the oxide scale in Fig. 11 for the 30 mass% Fe alloy, Cr-chloride precipitates were observed in other localized areas where the outer oxide scale grew thicker, as shown in Fig. 12. The observation of these two different areas in the 30 mass% Fe alloy suggests that internal Cr-chloride formation increased the growth rate of the outer Fe-rich oxide scale. The thickness of these zones of internal oxidation/chlorination and Cr-depletion decreased with increasing Fe content.

Figure 13 presents the internal chlorination kinetics. The internal chlorination zone was defined as the region from the oxide/alloy interface to the tips of the internal chloride precipitates. The kinetics of internal oxidation/chlorination were initially slow up to approximately 25 h and then exhibited parabolic-like behavior for longer corrosion times. The growth rate of the internal oxidation/chlorination zone decreased with increasing Fe content, which may indicate that the penetration of chlorine into the alloy substrate decreased with Fe addition.
4. Discussion
The Fe-containing alloys were found to perform better corrosion resistance superior to that of the binary Ni20Cr alloy in an atmosphere containing air and salt-vapor at 570°C, which demonstrates that Fe addition is beneficial for improving the corrosion resistance of Ni20Cr-based alloys in chlorine-containing oxidizing atmospheres.
The calculated chlorine potential $(P_{\text{Cl}_{2}})$ during the corrosion tests using FactSage software was 3.7 × 10⁻⁶ atm.13) As a reference, the “quasi”-stability diagrams for oxides and chlorides on Ni20Cr alloys with and without Fe are presented in Fig. 14, using the calculated $P_{\text{Cl}_{2}} = 3.7 \times 10^{ - 6}$ atm in the atmosphere and the activities of each element in the alloys (Ni20Cr: aNi = 0.5718, aCr = 0.1406; Ni20Cr–30Fe: aNi = 0.2316, aCr = 0.3277, aFe = 0.3055). The regions of the gas phases of the metal chlorides and oxychlorides in these diagrams indicate only a gas potential of greater than 9.87 × 10⁻⁵ atm, which was proposed to be the critical pressure for affecting the corrosion behavior, corresponding to a metal consumption rate of 1 mm·y−1.15) The horizontal (or diagonal) lines for metal chlorides and oxychloride does not mean to separate the stable areas between metal and volatilized products. Thus, it does not indicate that chlorination is not occurred below the horizontal lines, i.e., below these lines, the volatile corrosion products are still being formed but to a lesser extent. The $P_{\text{Cl}_{2}} $ in the atmosphere used in this study was insufficient to form the chlorides, which have higher vapor pressures than the critical pressures; thus, it can be expected that oxides should be formed initially.13) In fact, cross-sections of the 30 mass% Fe alloy after 4 h of corrosion indicated the formation of Fe rich-Cr oxide nodules, as shown in Fig. 15. Although the oxide scale was too thin to observe via FE-SEM, the protective Cr rich oxide layer is expected to form beneath these nodules. This oxide structure is similar to that observed in a previous study for oxidation of Fe–20Cr–34Ni alloy at 600°C.16) As we previously confirmed the formation of a protective Cr2O3 scale on an Fe-free alloy during oxidation in air,13) the difference in the oxidation behavior of alloys with and without Fe addition is the formation of Fe-rich oxide nodules on the Fe-containing alloys.

Dendritic deposits of NaCl were observed on the surfaces of all of the alloys. The formation of these deposits was ascribed to the condensation of salt-vapor at the oxide scale surface. However, potassium was not detected in these deposits, which indicates that this element was consumed by the formation of chromate according to the following reactions:
| \begin{equation}
\text{4KCl(g)} + \text{Cr$_{2}$O$_{3}$ (s)} + \text{5/2O$_{2}$(g)}\to \text{2K$_{2}$CrO$_{4}$(s)} + \text{2Cl$_{2}$(g)}
\end{equation}
| (2) |
| \begin{equation*}
\Delta G^{\circ}\ (2) = -243.053\,\text{kJ$\,$mol$^{-1}$}
\end{equation*}
|
| \begin{equation}
\text{2KCl(g)} + \text{Cr$_{2}$O$_{3}$ (s)} + \text{2O$_{2}$(g)}\to \text{K$_{2}$Cr$_{2}$O$_{7}$(s)} + \text{Cl$_{2}$(g)}
\end{equation}
| (3) |
Because no thermodynamic data for reaction (3) could be found in the literature, we will limit our discussion to reaction (2).
Potassium chromate formation generates chlorine, which increases the local chlorine potential at the potassium chromate/Cr2O3 interface. The chlorine potential due to a potassium chromate formation was calculated to be $P_{\text{Cl}_{2}} = 1.11 \times 10^{ - 5}$ atm at 570°C under the assumption that the vapor pressure of KCl, PKCl is 1.56 × 10⁻⁶ atm at equilibrium in a static atmosphere. This calculated chlorine potential is approximately three times higher than that in the furnace atmosphere, which could directly affect the alloy surface because the Cr2O3 was consumed by potassium chromate formation, resulting in enhanced internal chlorination in the alloy.
In this study, potassium chromate formation was confirmed from the EDS mapping shown in Figs. 5, 6, and 9–12. Moreover, K2CrO4, K2Cr2O7, and Na2CrO4 were identified in the XRD patterns shown in Fig. 7. Unfortunately, ΔG° value for K2Cr2O7 formation could not be calculated owing to the absence of this reaction in thermodynamic databases. Thus, Fe addition did not completely suppress the formation of chromates, which resulted in an increased local $P_{\text{Cl}_{2}}$ at the oxide scale surface due to reactions (2) and (3). Moreover, the Cr activities in Ni–20Cr and Ni–20Cr–30Fe alloys were 0.14 and 0.33, respectively, as calculated using FactSage software.17) Thus, the alloy with a higher Fe content is more likely to form internal Cr-chloride precipitates. However, as mentioned above, the formation of internal Cr-chloride decreased, and the internal oxidation/chlorination kinetics was also decreased with increasing Fe content (Figs. 8 and 13). Thus, it is reasonable to consider that chlorine penetration into the alloy substrate decreased with Fe addition. The areas of potassium chromate tended to decrease with increasing Fe content, suggesting that Fe addition inhibited chromate formation.
The reactions between salt-vapor (KCl and NaCl) and Fe2O3, as described by the reactions (4) and (5), are thermodynamically less favorable than those involving Cr2O3.17)
| \begin{equation}
\text{2KCl(g)} + \text{Fe$_{2}$O$_{3}$(s)} + \text{1/2O$_{2}$(g)}\to \text{2KFeO$_{2}$(s)} + \text{Cl$_{2}$ (g)}
\end{equation}
| (4) |
| \begin{equation*}
\Delta G^{\circ}\ (4) = 74.264\,\text{kJ$\,$mol$^{-1}$}\ (\text{at 570${{}^{\circ}\text{C}}$})
\end{equation*}
|
| \begin{equation}
\text{2NaCl(g)} + \text{Fe$_{2}$O$_{3}$(s)} + \text{1/2O$_{2}$(g)}\to \text{2NaFeO$_{2}$(s)} + \text{Cl$_{2}$ (g)}
\end{equation}
| (5) |
| \begin{equation*}
\Delta G^{\circ}\ (5) = -2.022\,\text{kJ$\,$mol$^{-1}$}\ (\text{at 570${{}^{\circ}\text{C}}$})
\end{equation*}
|
Therefore, once Fe2O3 had formed on the alloy substrate, it prevented the formation of chromates on the Cr2O3 scale surface and thus the increase in local chlorine potential. Figure 16 shows a proposed model for the corrosion of Ni20Cr alloy and the effect of Fe addition on the corrosion behavior. In the initial stage of corrosion, a Cr-rich oxide scale is formed on the Fe-free alloy (Fig. 16(a)), whereas Fe-rich nodules are formed on the Cr2O3 scale of Fe-containing alloys (Fig. 16(d)). The Fe content in the Cr-rich oxide scale or the number of Fe-rich nodules increases with increasing Fe content. The internal oxidation and chlorination of Cr does not occur or proceeds only very slowly during this initial oxidation stage up to approximately 25 h, because the chlorine potential at the scale/alloy interface remains low. Chromates formation then occurs on both the Fe-free alloy and Fe-containing alloys, mainly via reactions (2) and (3), which increases the local $P_{\text{Cl}_{2}}$ at the chromate/oxide interface. The generated Cl2 migrates through cracks and/or pores in the oxide scale and penetrates into the alloy substrate, leading to chlorination of the alloy and resulting in the formation of internal Cr-chloride precipitates, which consumes the Cr in the subsurface region to form a Cr-depletion zone (Figs. 16(b) and (e)). However, the areas of chromate formation are limited on the Fe-containing alloys. Because there is less chromate formation on the alloys with the higher Fe content, the $P_{\text{Cl}_{2}}$ at the surface does not increase, which results in slower internal oxidation/chlorination kinetics and a thinner Cr-depletion zone. Greater metal chloride formation on the Fe-free alloy results in higher evaporation of Cr-chloride, as shown in Fig. 3. Since the Cr-depletion of the alloys with higher Fe content is low owing to reduced internal chlorination, these alloys can maintain a continuous Cr2O3 scale beneath the Fe-rich oxide scale (Figs. 9–11), which is favorable for reducing the corrosion kinetics of the alloy.

5. Conclusion
The corrosion behavior of Ni20Cr alloys containing various Fe contents (0, 4, or 30 mass%) was investigated. The obtained results can be summarized as follows:
-
(1)
Fe addition to Ni20Cr alloy led to improve the corrosion resistance in an oxidizing chlorine-containing environment.
-
(2)
Ni20Cr alloys with different Fe contents exhibited an oxide scale structure and internal precipitation zone similar to those in the Fe-free alloy, albeit with reduced internal Cr-chloride penetration and a thinner Cr-depletion zone.
-
(3)
For the Fe-containing alloys, Fe-oxide formation above the Cr2O3 scale inhibited chromate formation and maintained a low chlorine potential at the alloy surface. Thus, the protective Cr2O3 scale could be maintained for a longer corrosion period.
Acknowledgments
The study has been supported by RISET-Pro Kemenristekdikti. The authors would like to thank the Laboratory of Nano-Micro Materials Analysis (NMA) and the Laboratory of High Voltage Electron Microscope (HVEM), Graduate School of Engineering, Hokkaido University.
REFERENCES
- 1) H.J. Grabke, E. Reese and M. Spiegel: Corros. Sci. 37 (1995) 1023–1043.
- 2) A. Zahs, M. Spiegel and H.J. Grabke: Corros. Sci. 42 (2000) 1093–1122.
- 3) Y. Shinata: Oxid. Met. 27 (1987) 315–332.
- 4) K. Segerdahl, J. Pettersson, J.-E. Svensson and L.-G. Johansson: Mater. Sci. Forum 461–464 (2004) 109–116.
- 5) Y.S. Li, M. Spiegel and S. Shimada: Mater. Chem. Phys. 93 (2005) 217–223.
- 6) S. Karlsson, J. Pettersson, L.G. Johansson and J.E. Svensson: Oxid. Met. 78 (2012) 83–102.
- 7) J. Oh, M. McNallan, G. Lai and M. Rothman: Metall. Mater. Trans. A 17 (1986) 1087–1094.
- 8) A.S. Kim and M.J. McNallan: Corrosion 46 (1990) 746–755.
- 9) C. Schwalm and M. Schütze: Mater. Corros. 51 (2000) 34–49.
- 10) R. Bender and M. Schütze: Mater. Corros. 54 (2003) 652–686.
- 11) C. Pettersson, J. Pettersson, H. Asteman, J.-E. Svensson and L.-G. Johansson: Corros. Sci. 48 (2006) 1368–1378.
- 12) S. Kiamehr, K.V. Dahl, M. Montgomery and M.A.J. Somers: Mater. Corros. 66 (2015) 1414–1429.
- 13) H. Izzuddin, S. Hayashi, S. Yoneda, T. Kogin, E. Ishikawa and M. Noguchi, Mater. Corros. (2020). https://doi.org/10.1002/maco.201911469.
- 14) A. Altomare, N. Corriero, C. Cuocci, A. Falcicchio, A. Moliterni and R. Rizzi: J. Appl. Cryst. 48 (2015) 598–603.
- 15) R. Bender and M. Schütze: Mater. Corros. 54 (2003) 567–586.
- 16) W.M. Stobbs, S.B. Newcomb and E. Metcalfe: Philos. Trans. R. Soc. London, Ser. A 319 (1986) 219–247.
- 17) C.W. Bale et al. Calphad 54 (2016) 35–53.